I’ve been trying to come up with a word that best describes the San Francisco and Bay Area real estate market in 2023, but even with a degree in literature the best I can come up with is: weird. It has been one of the strangest markets in many, many years, mostly due to either very high or very low interest rates. While the year started off fairly strong and typical, a series of interest rate hikes resulted in buyers either pausing their search or being knocked out of the market completely. By July, interest rates were over 7% and by October they were over 8%, the highest they’ve been in over 22 years. Rates then started lowering toward the end of the year but were mostly still over 7%.
Meanwhile, sellers who didn’t have to sell sat tight. With near-record low interest rate loans, owners made do with their current circumstances especially if they needed a replacement home. To swap that low interest rate for a new loan at a higher rate didn’t make sense financially or emotionally. As a result, inventory dropped to even lower than usual levels.
San Francisco wasn’t unique in this odd market. According to the National Association of Realtors, the number of homes that sold in the U.S. in 2023 was the lowest in 30 years. Sales overall were down here in San Francisco as well. The condo market, which plummeted soon after the beginning of the pandemic, continued to be a challenge. And yet as always here in our strange and wonderful city, there are still many stories of properties selling well over asking price and sometimes with a dozen or more offers.
This new year comes with more bulllish predictions. As inflation has eased, fears of a deep recession are also easing. Economists are now more confident that a “soft landing” is possible for the U.S.. Many are also predicting interest rates to decline especially in the second half of the year. (see my 2024 Predictions blog here). One potential snag in this theory is that it’s also a national election year and it’s predicted to be a volatile one, which can lead to uncertainty.
And now on to the 2023 wrap-up.These stats are for San Francisco, but if you are interested in a different local area or neighborhood, just reach out and I can also provide them to you.
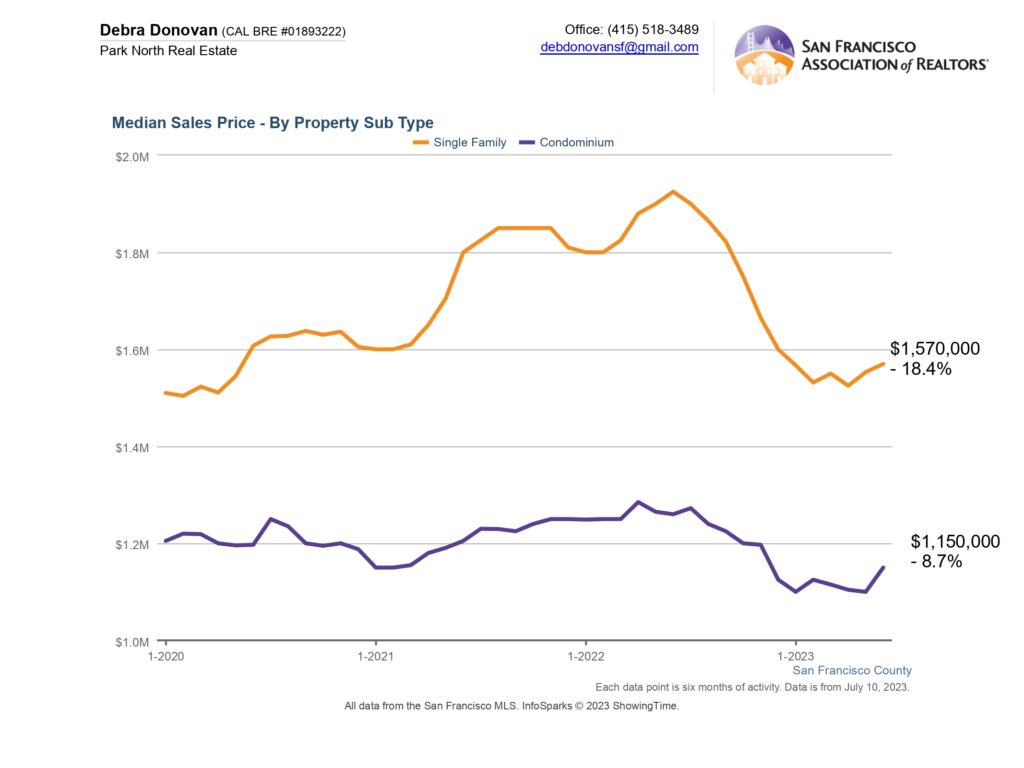
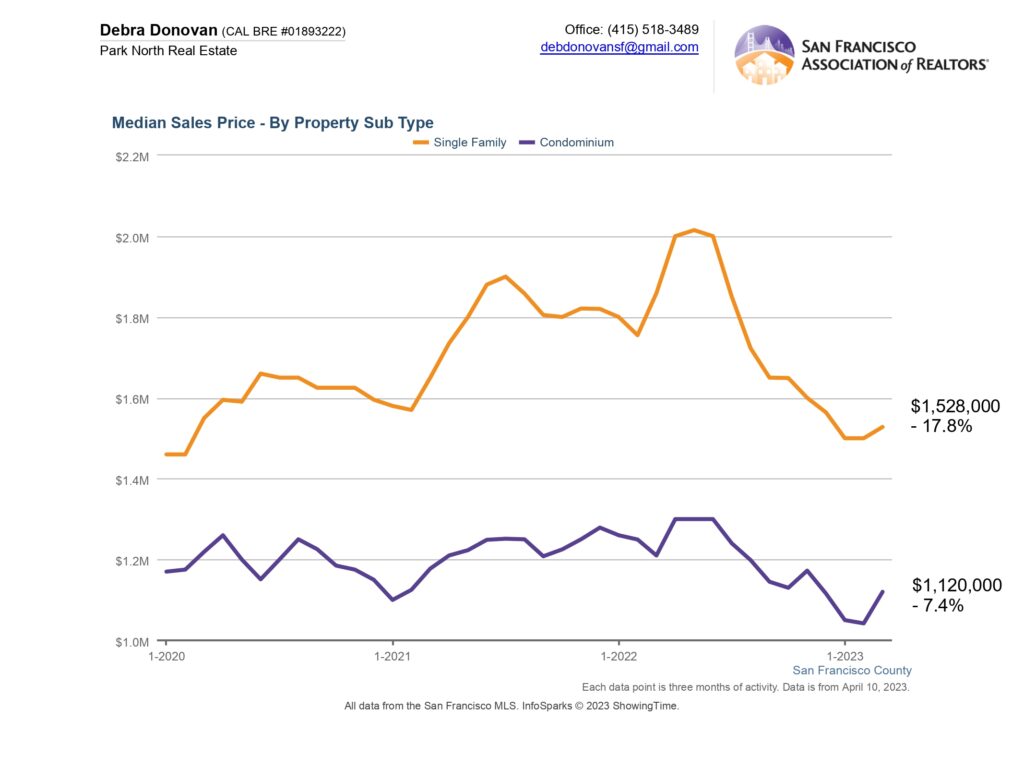
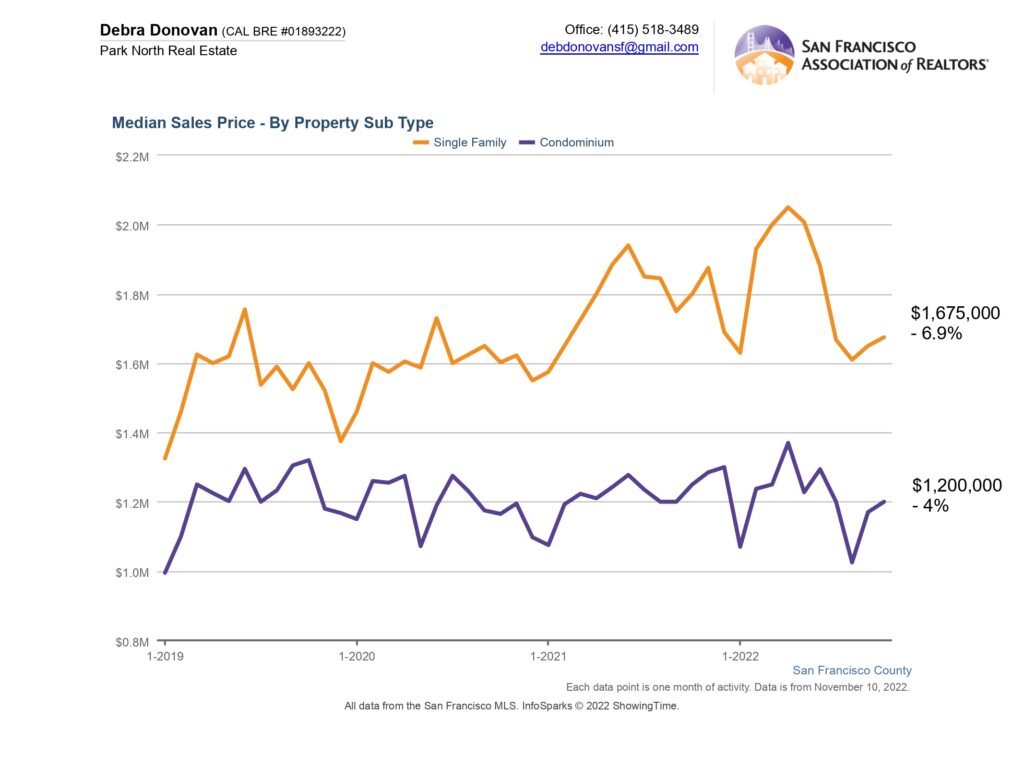
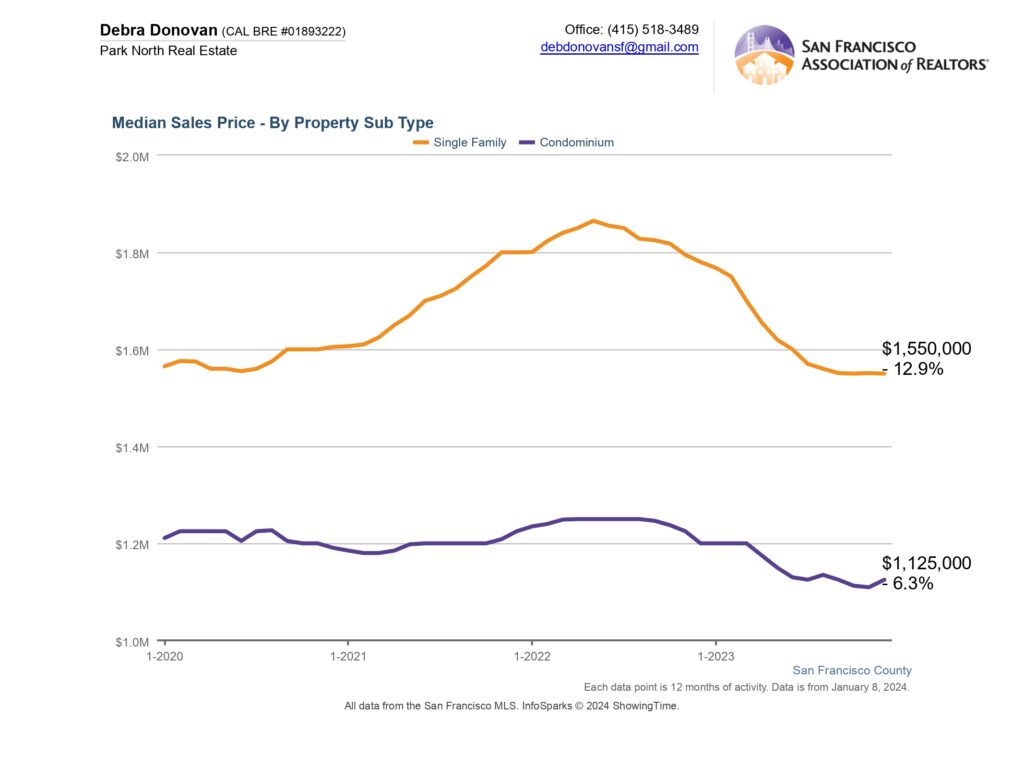
Median Price:
Overall, median prices in San Francisco decreased in 2023. The median price dropped to $1,550,000 for a single family home, down 13% while condo prices dropped 6% to $1,125,000 on a year over year basis. But as always, these decreases were not across the board. In the single family home market the higher end of the market market ($2.5 Million or more grew slightly. In the condo market the mid-range ($1M – 1.5M) grew slightly as did the higher end, which grew 8%.
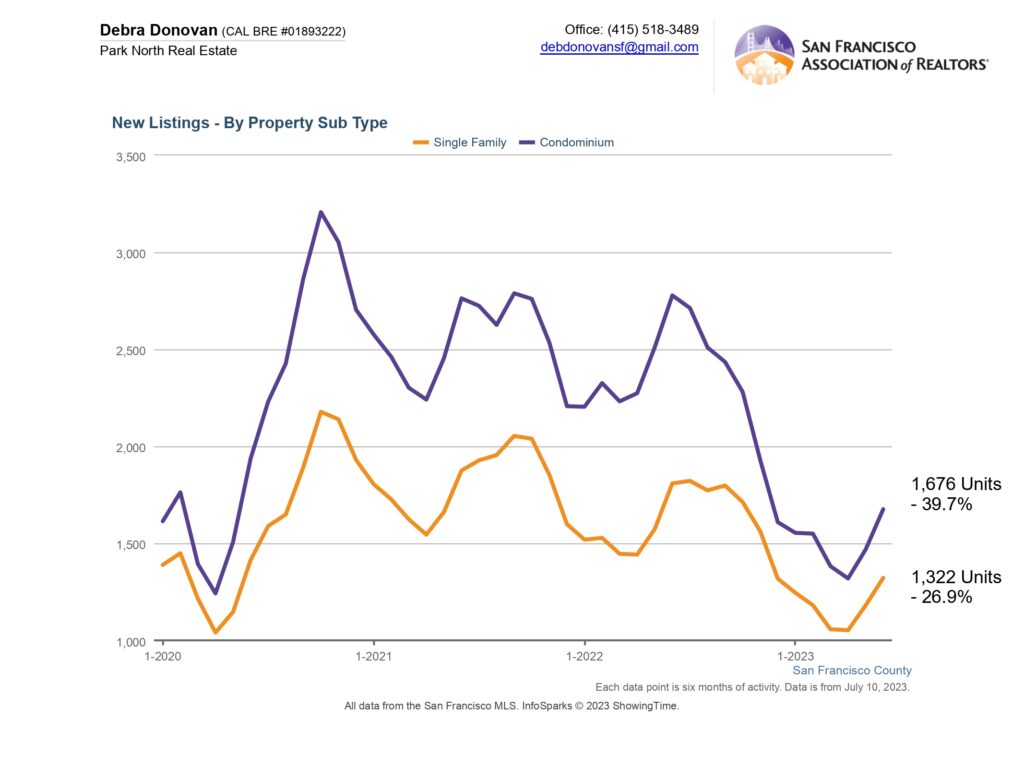
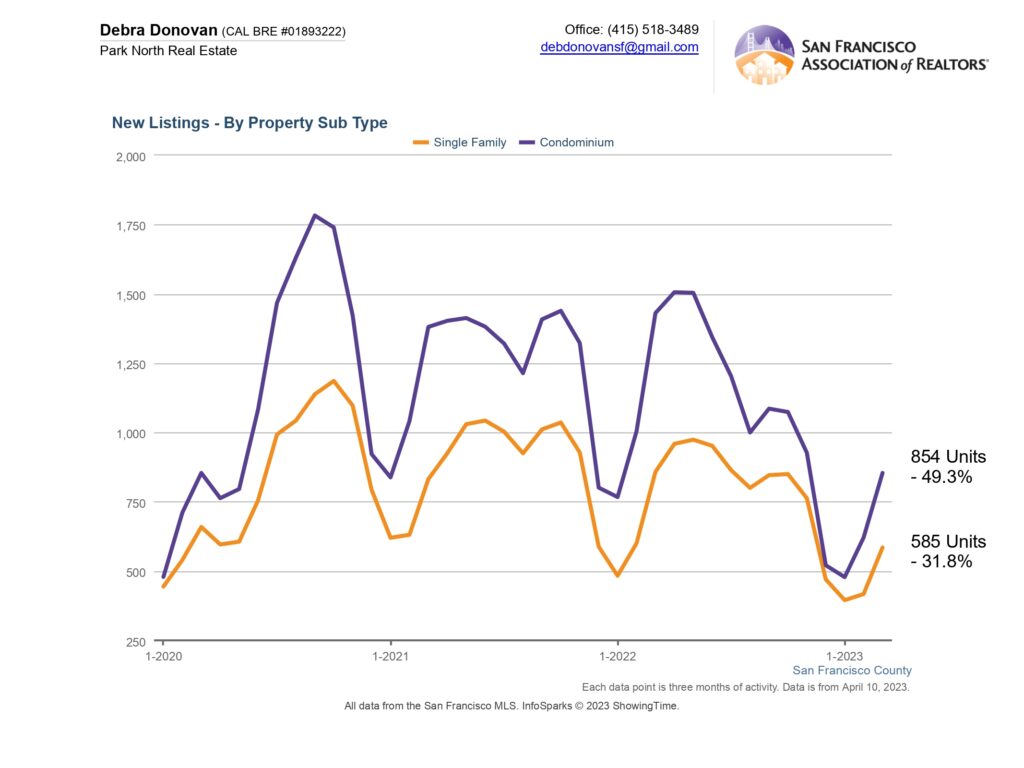
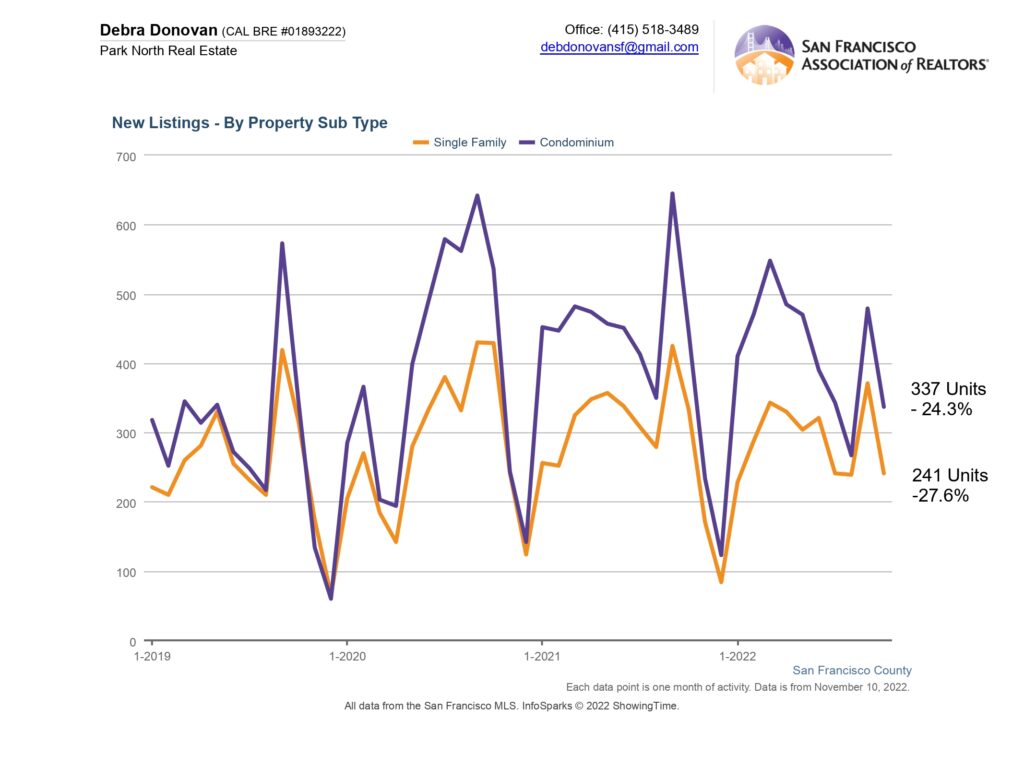
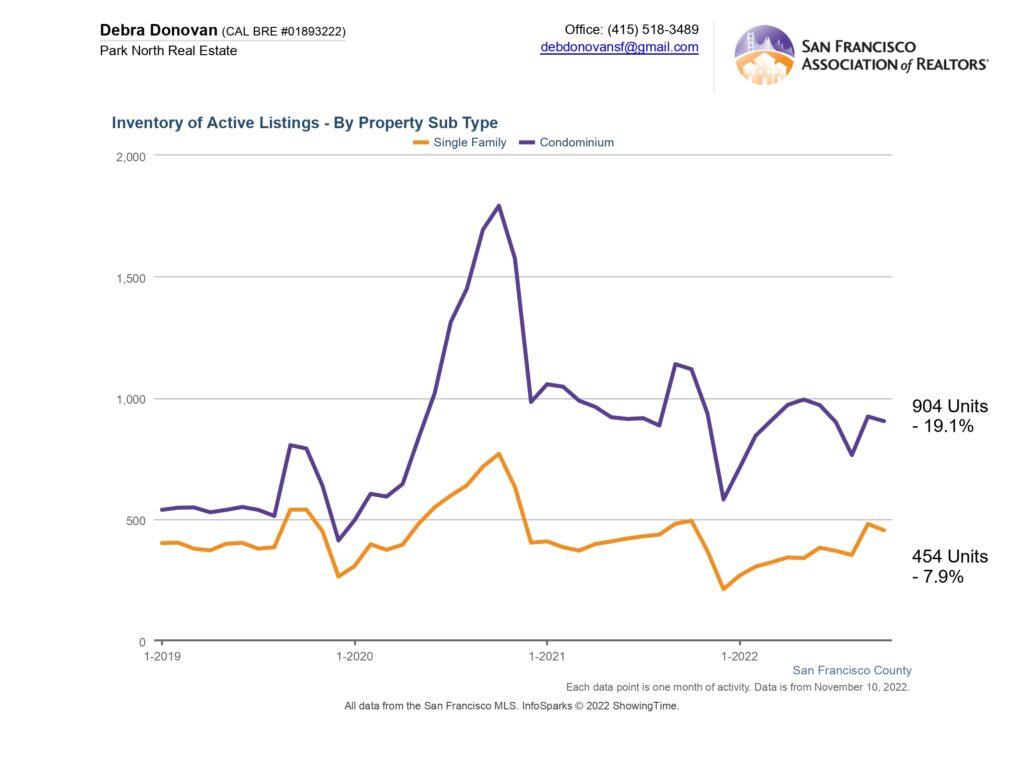
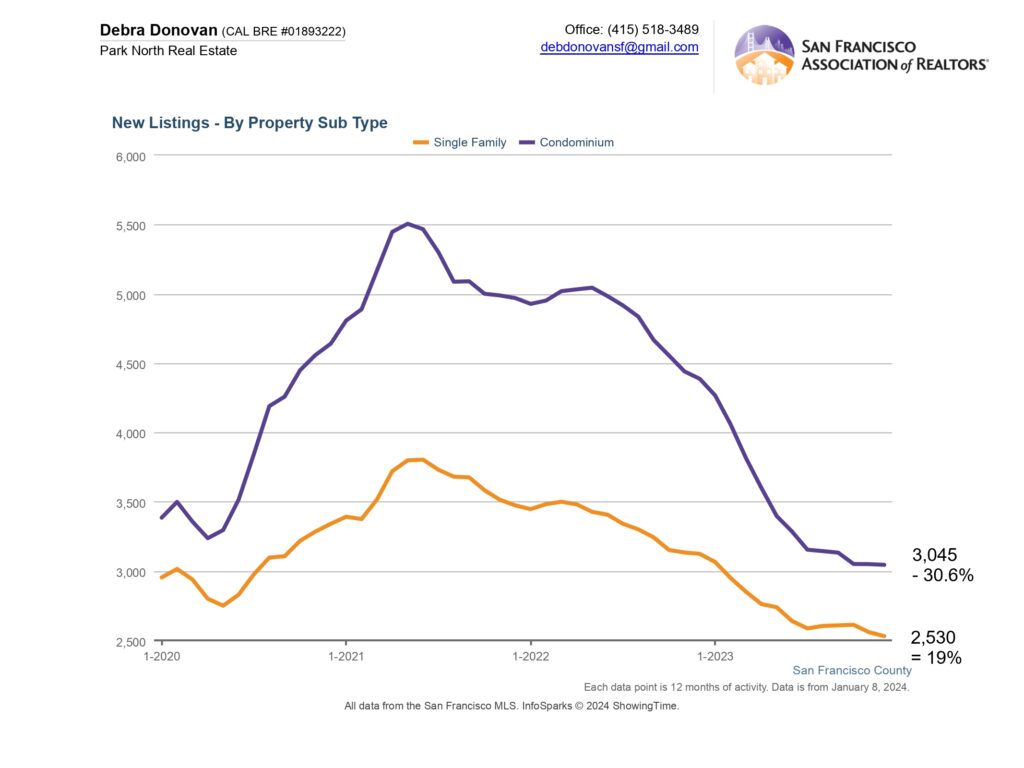
New Listings:
While median prices for properties dropped in 2023, so too did the number of listings. New single family home listings were down almost 20%, while condo listings were down by more than 30%.
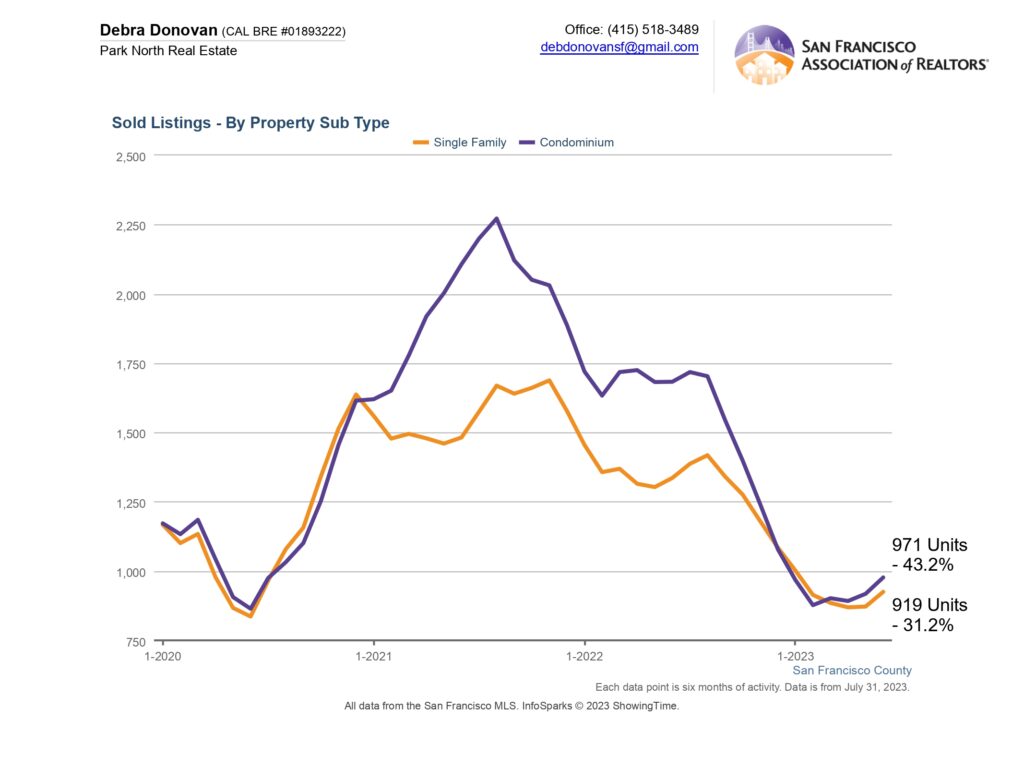
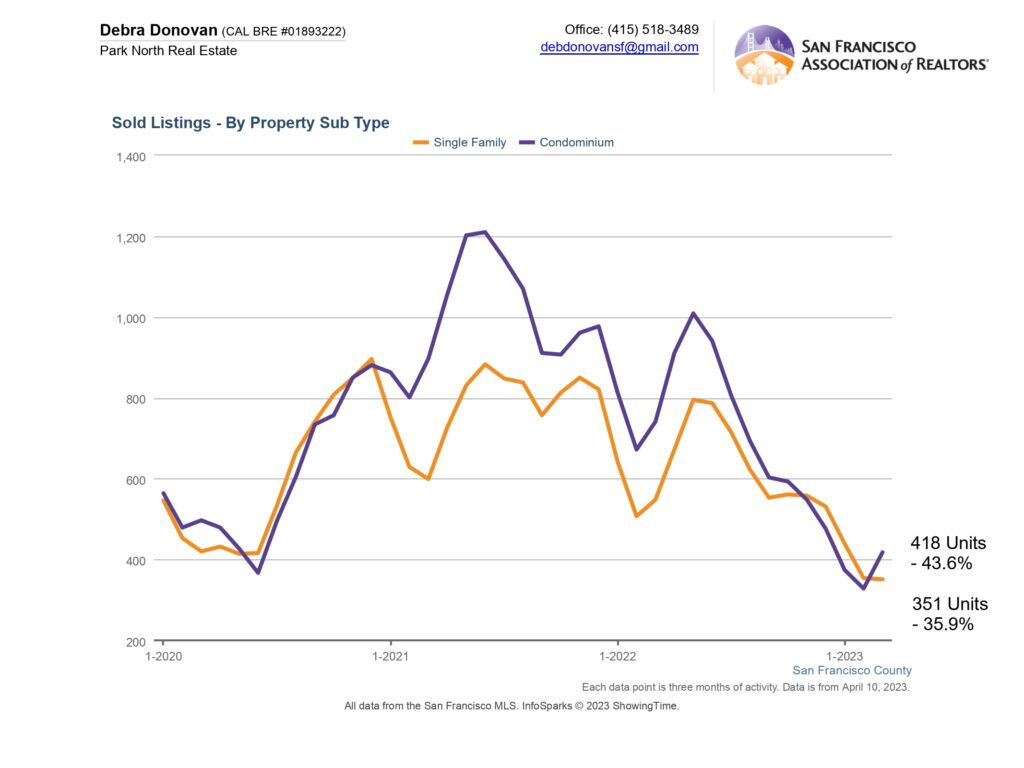
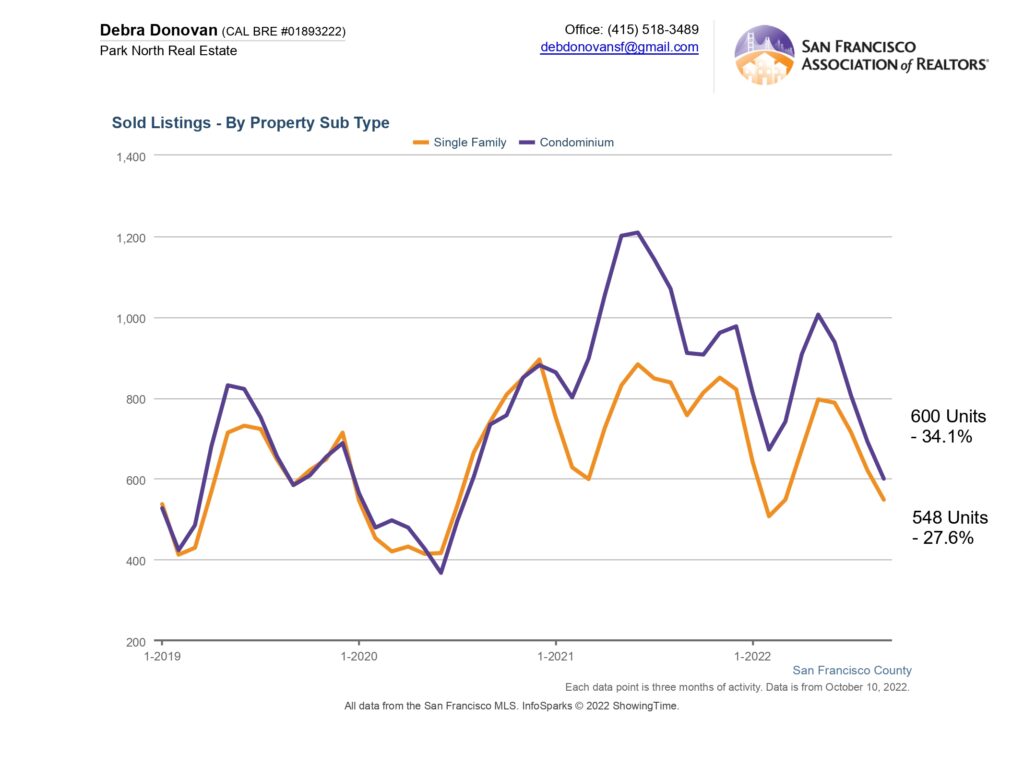
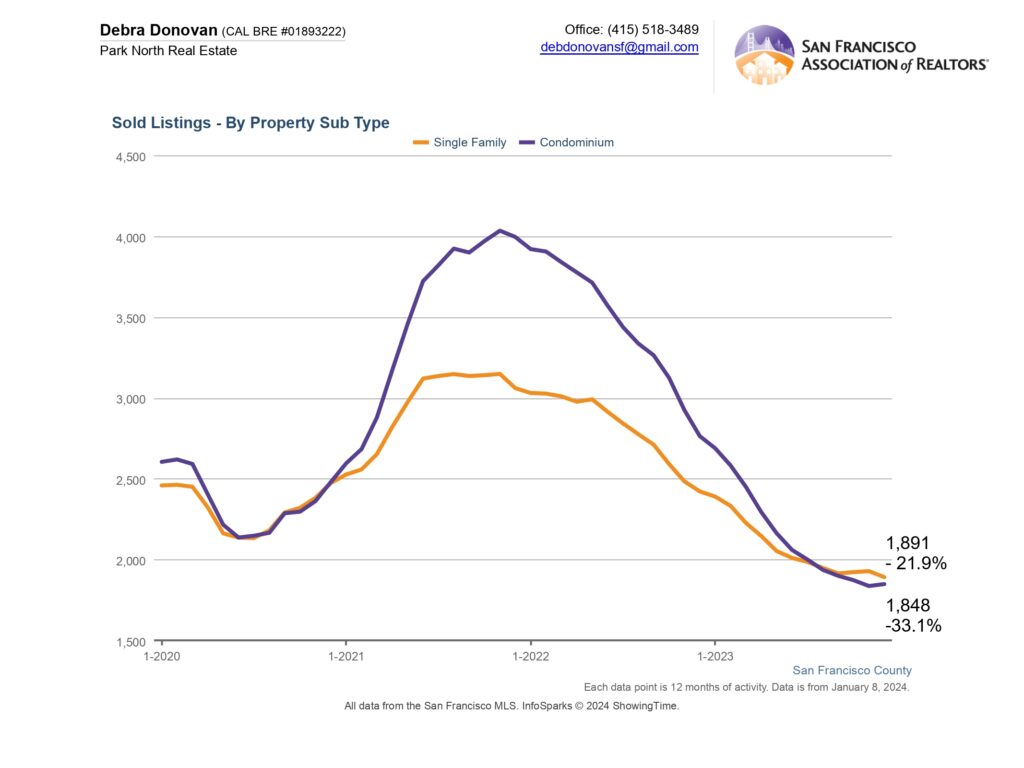
Sold Listings:
As mentioned above, sold homes nationwide were at their lowest levels in 30 years. Here in San Francisco, single family home sales decreased 22% year over year, while condo sales decreased by one-third.
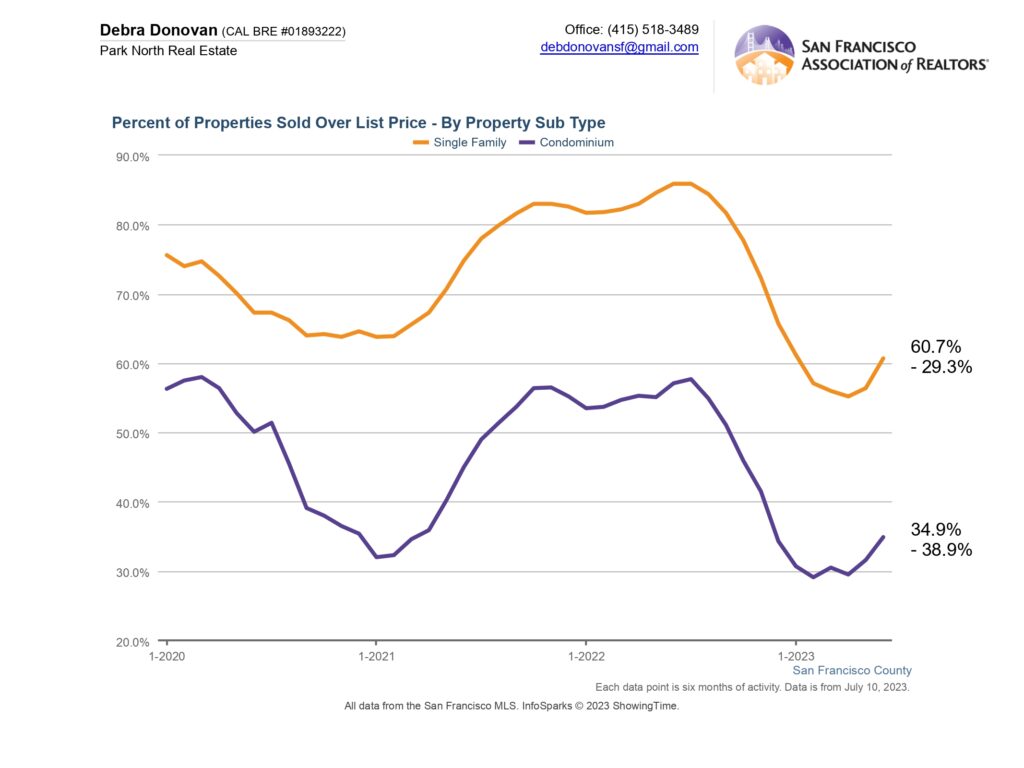
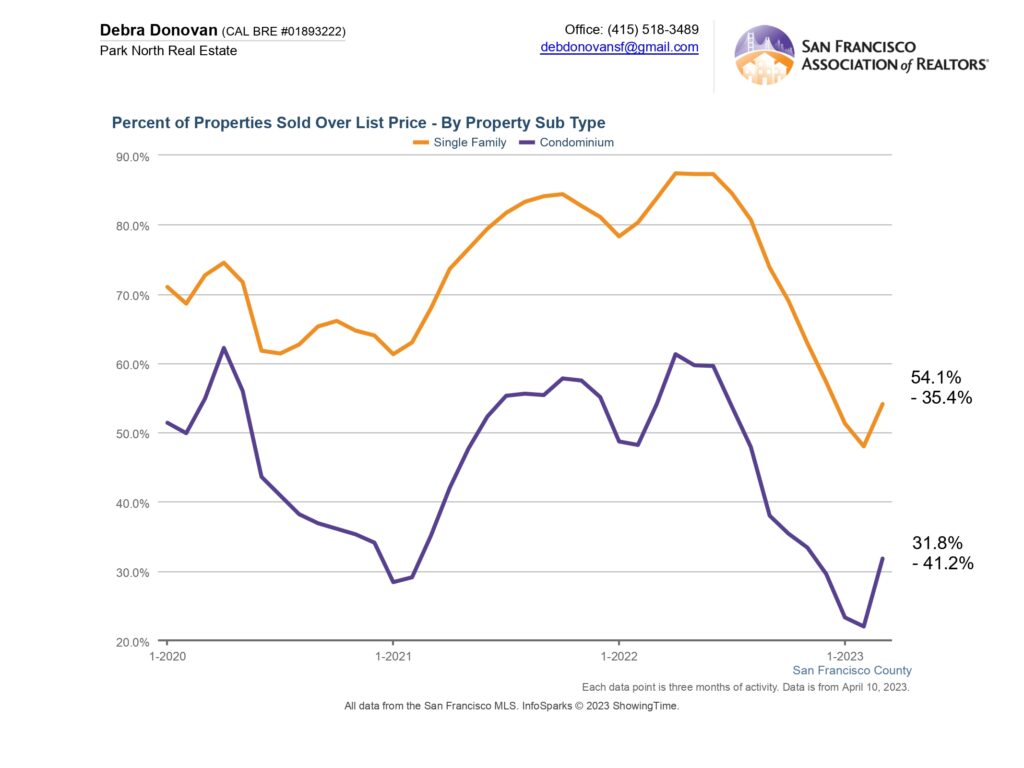
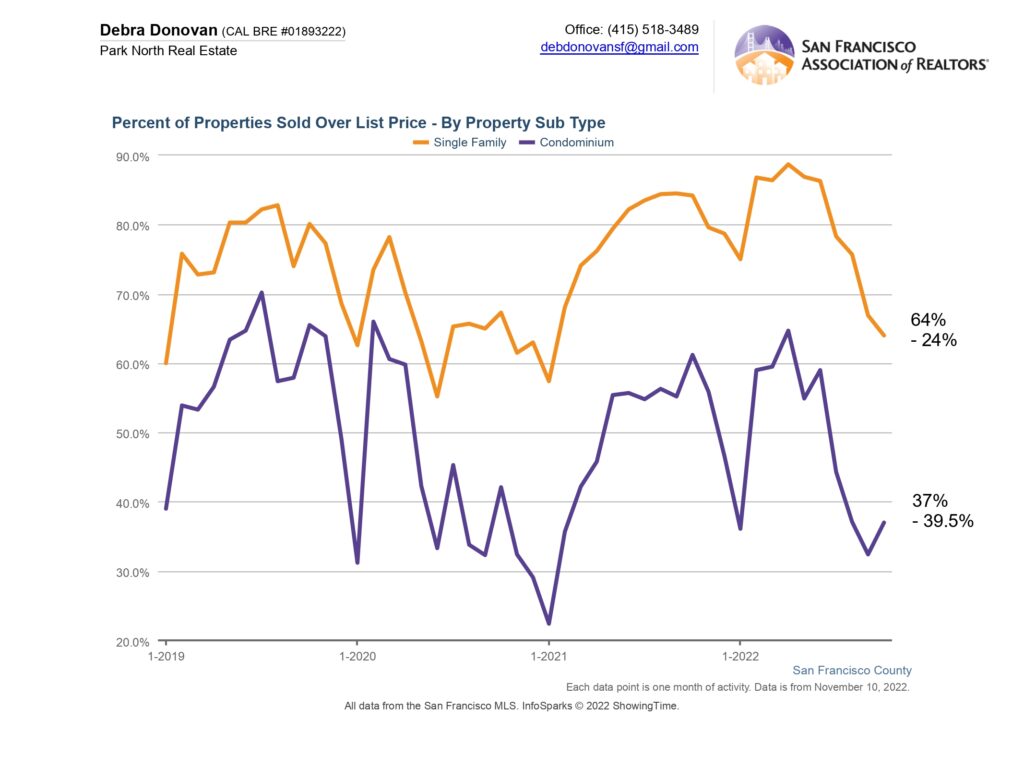
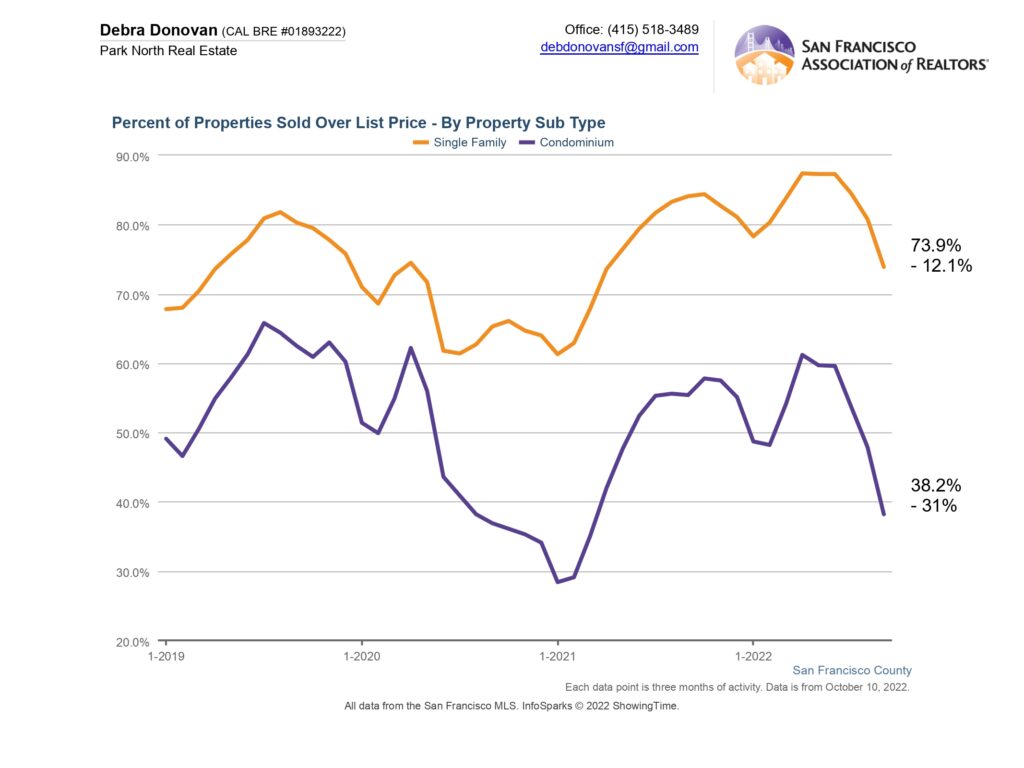
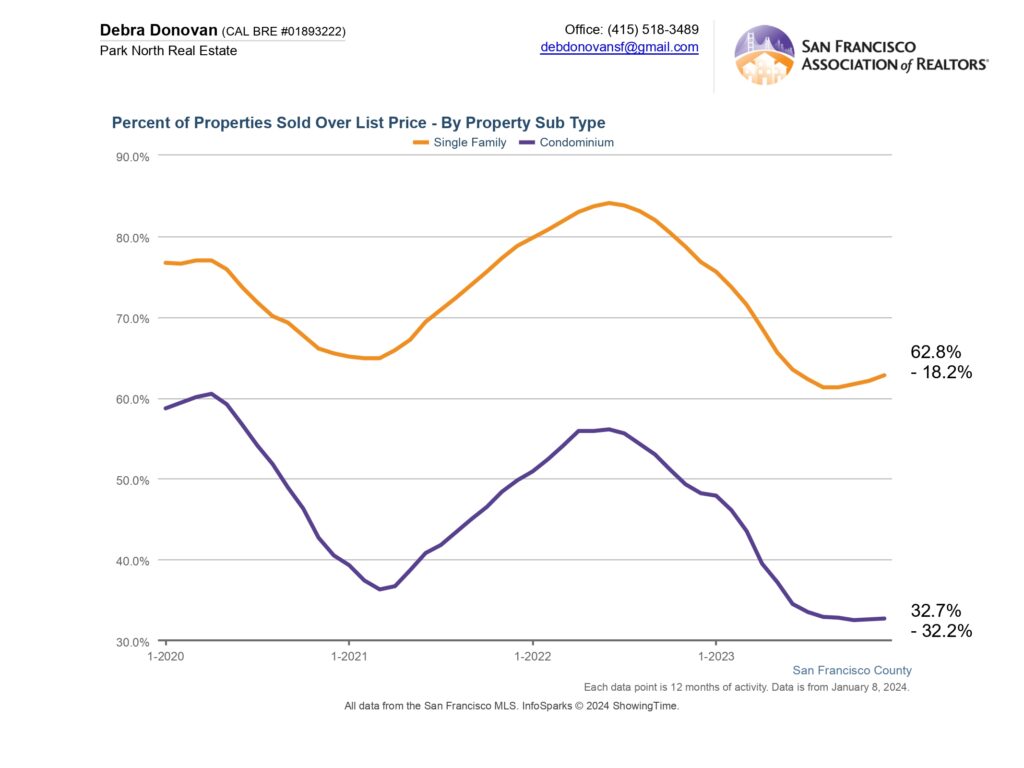
Percentage of Properties Selling Over List Price:
In spite of all of the doom and gloom that you hear about in the media, homes in San Francisco were still getting multiple offers and selling over list price, just not as pervasively as in years past. Sixty-three percent of single family homes sold over their list price, down 18%. About a third of condos sold for over their list price year over year, also down about a third compared to 2022.
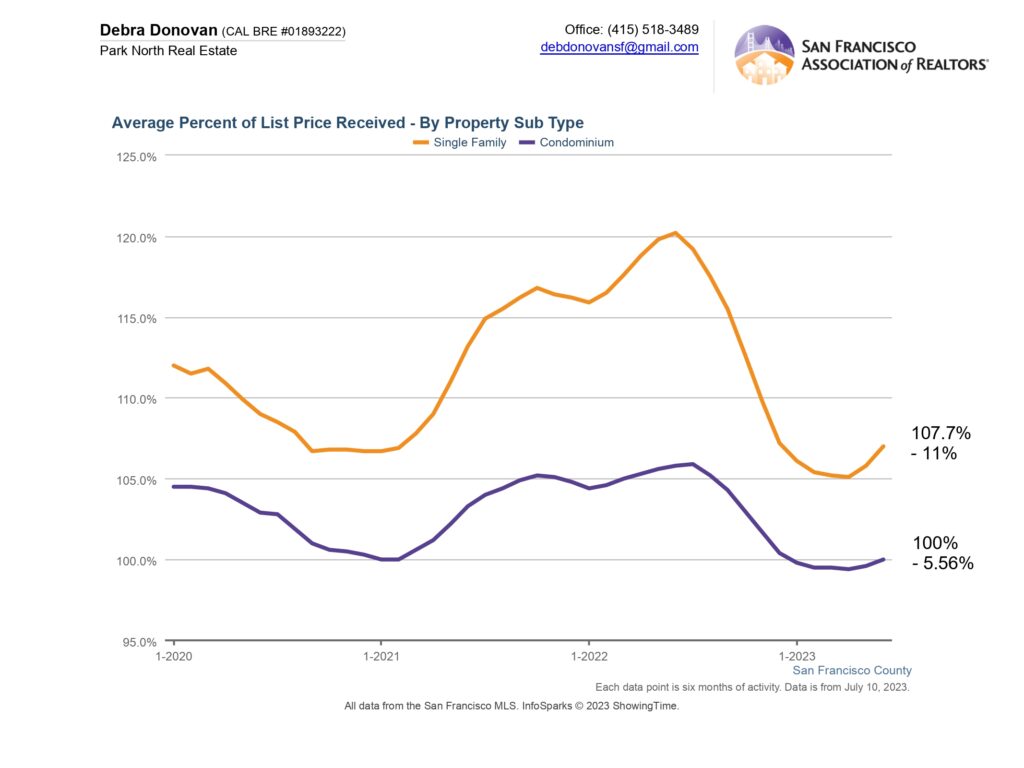
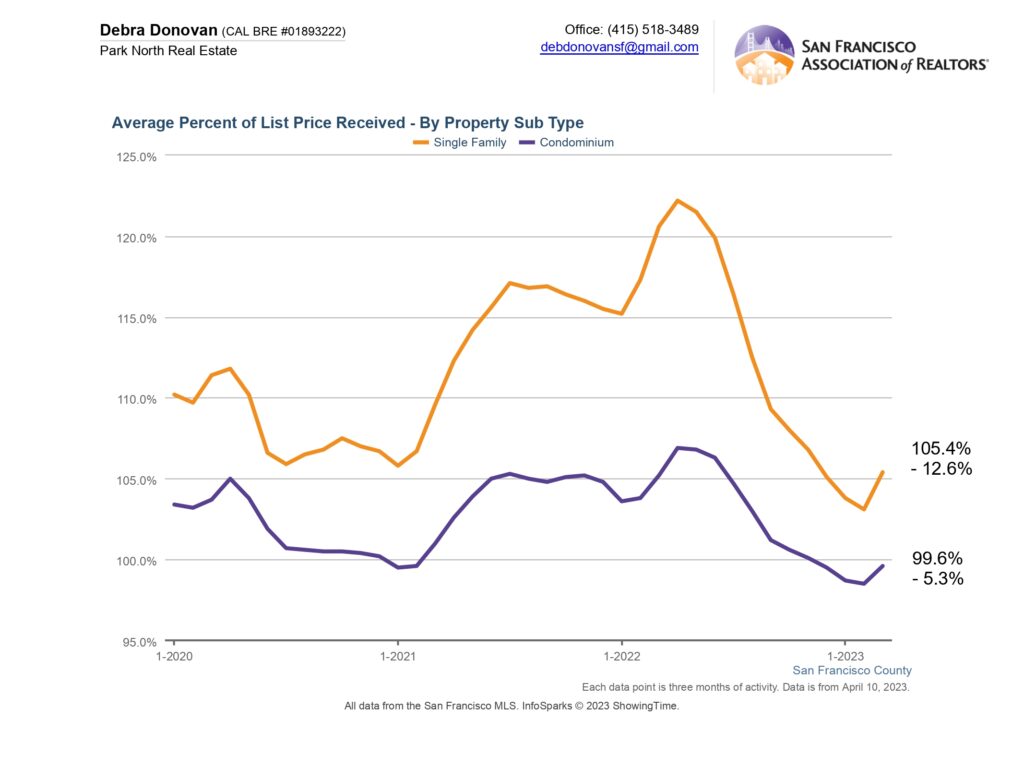
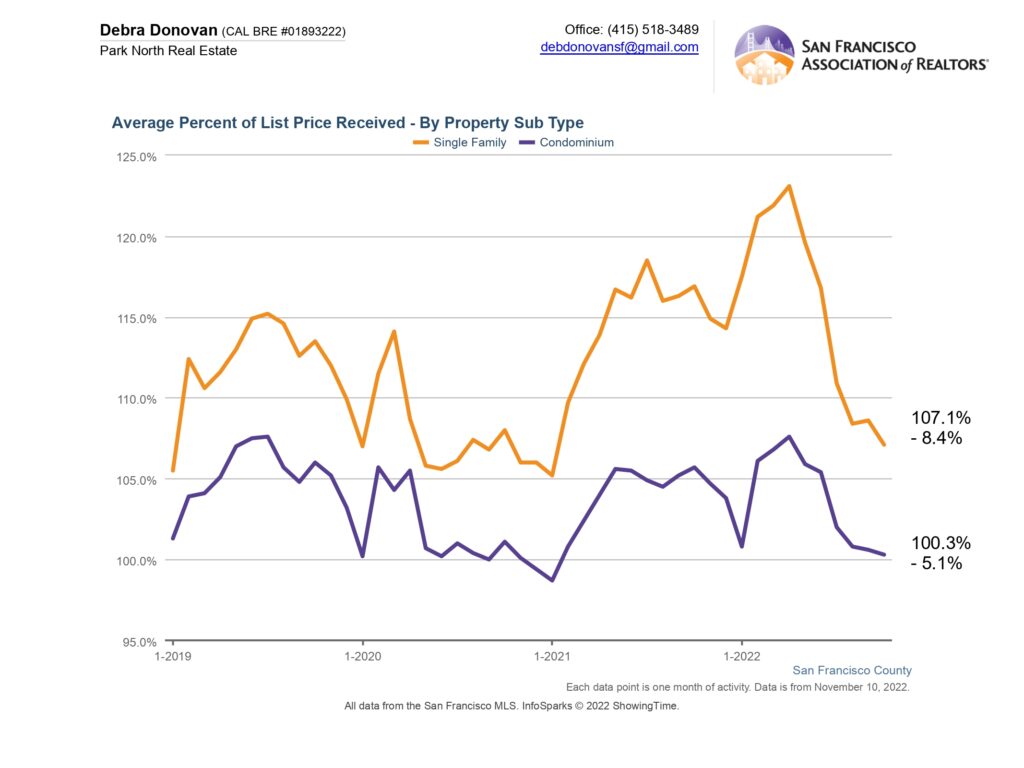
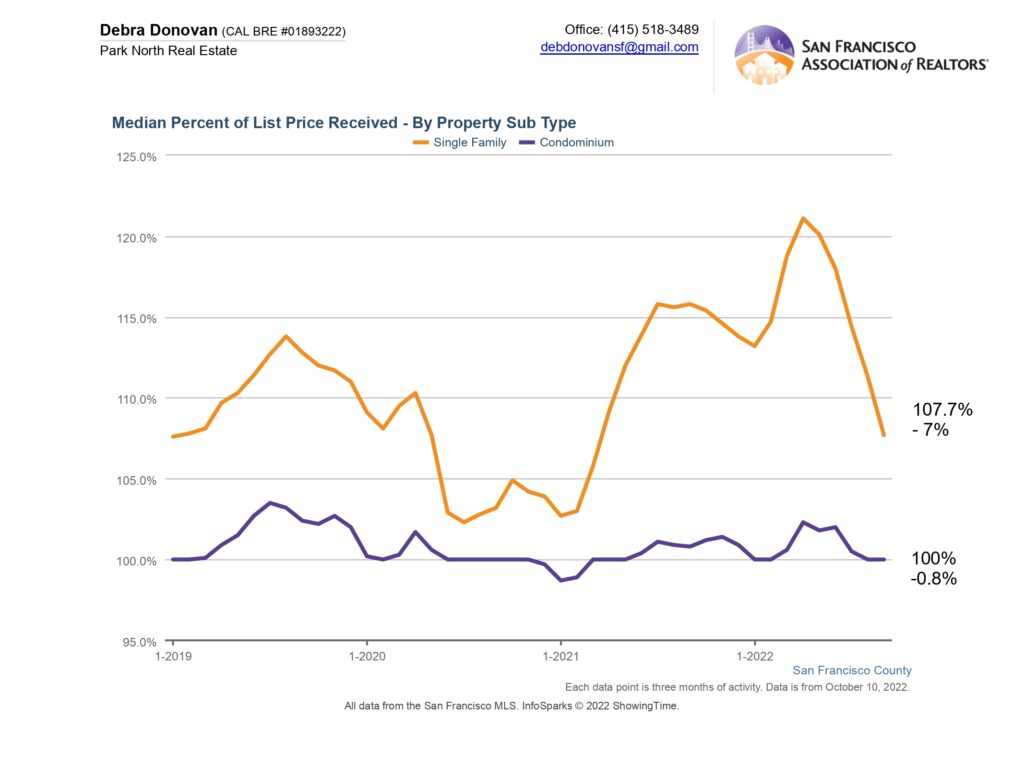
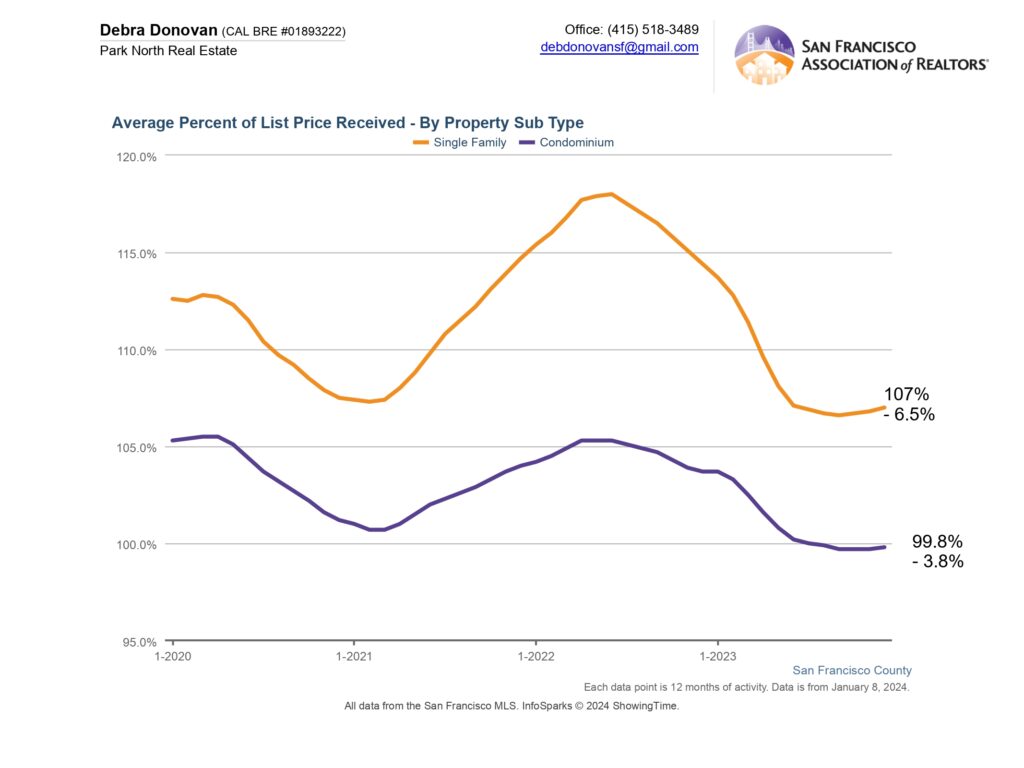
Average Percentage of List Price Received:
Single family homes sold an average of 107% of their list price in 2023, down 6.5% year over year. Condos sold at an average of 99.8%, down 4%.
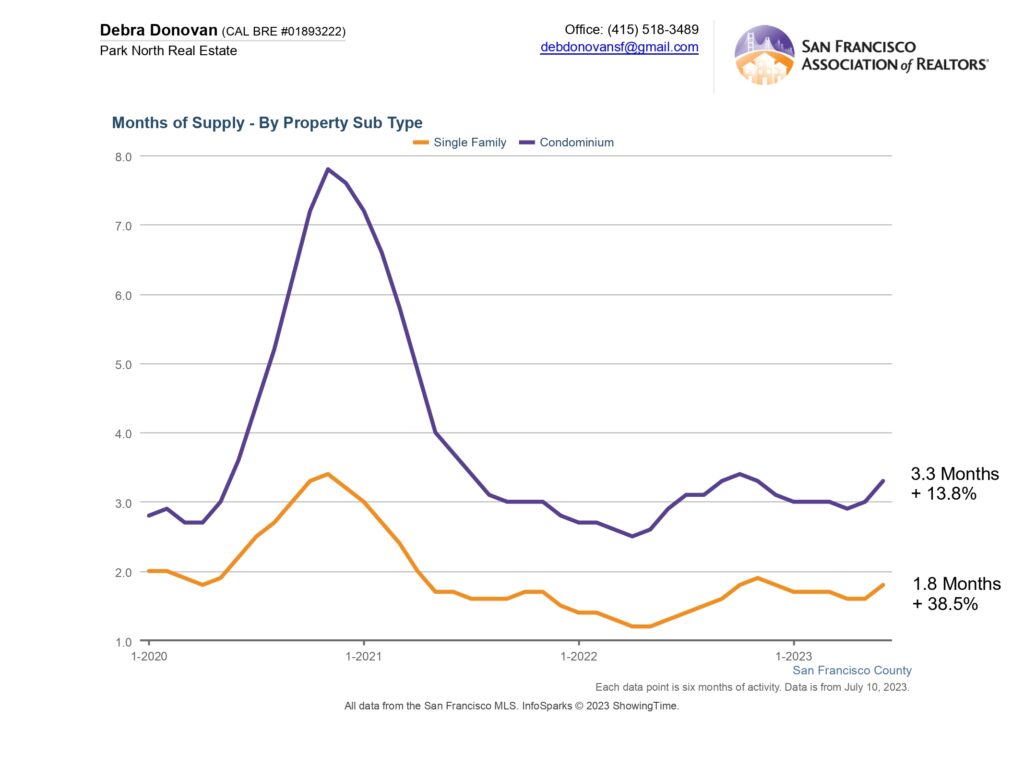
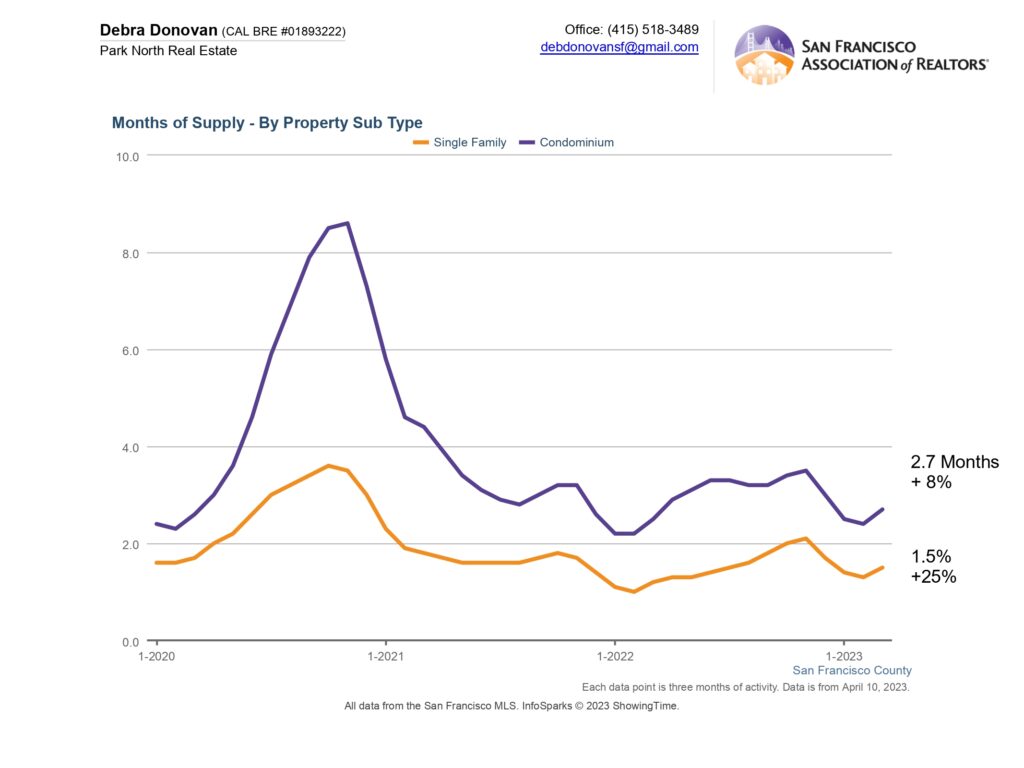
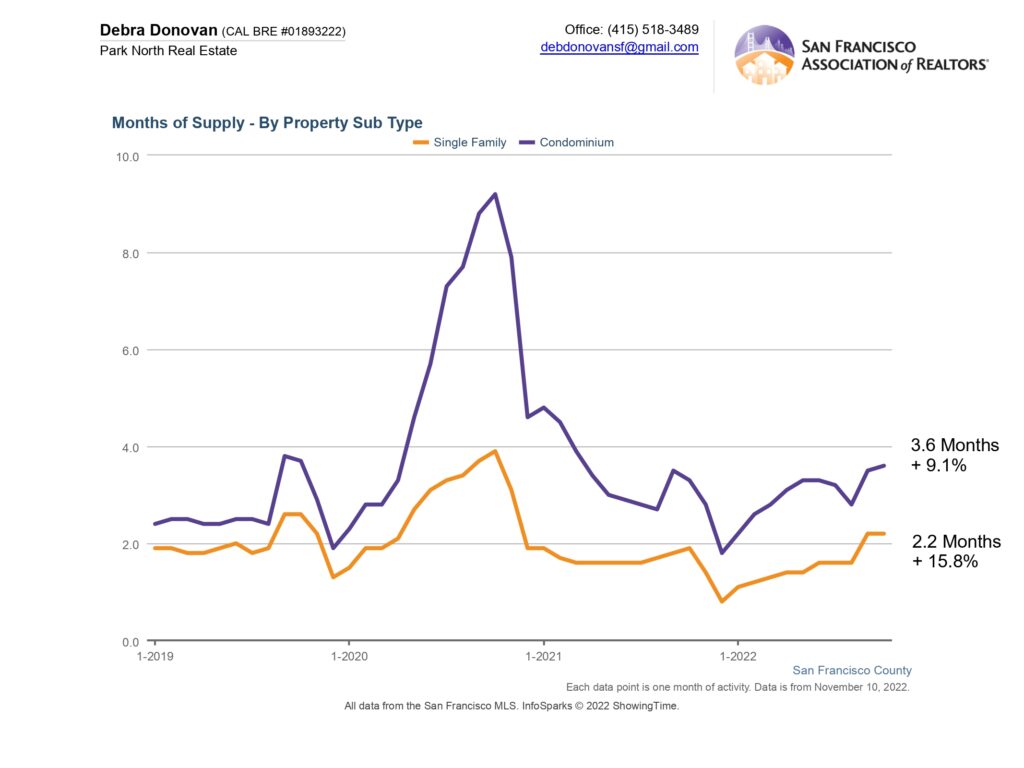
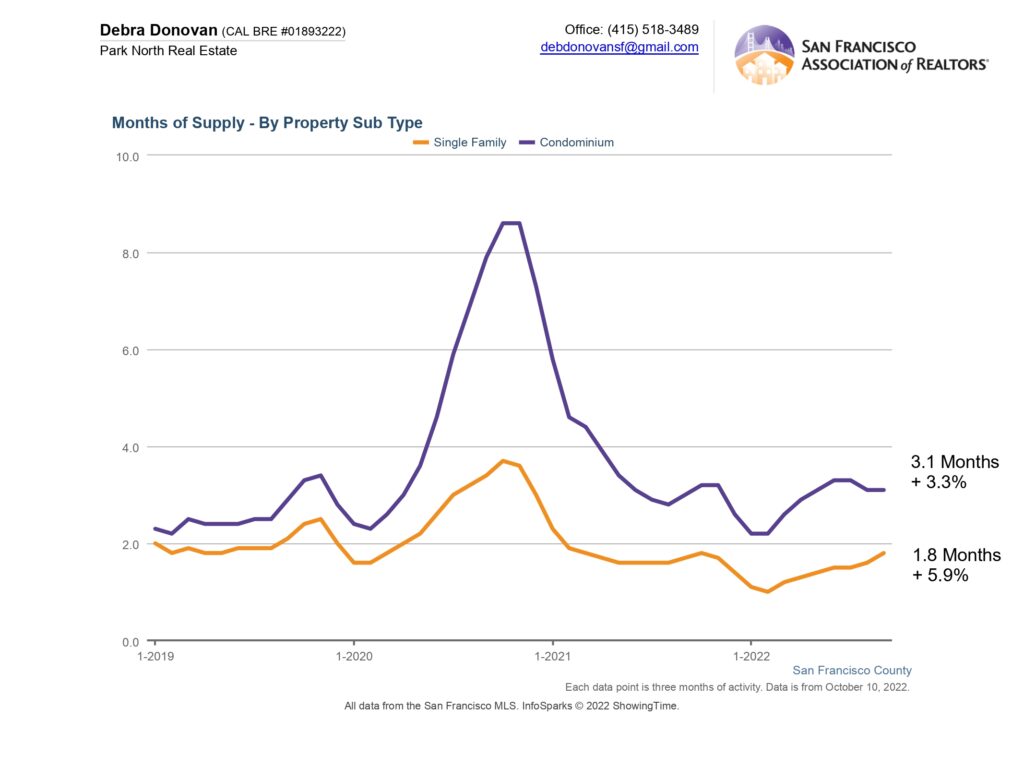
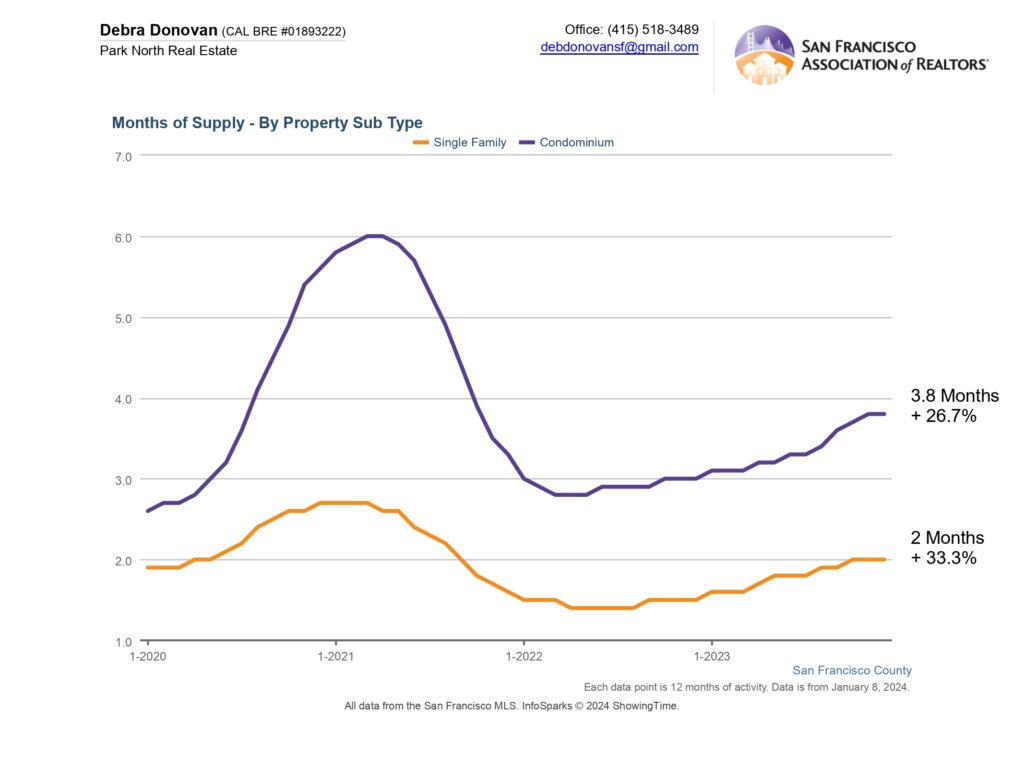
Months Supply of Inventory:
As fewer homes sold, the number of months’ supply of inventory rose compared to the previous year. Single family homes had 2 months of inventory at the end of 2023, up about a third. Condos had almost 4 months of inventory, up over 25%. It”s important to note, though, that months supply of inventory under 4-5 months is still considered a Seller’s market.
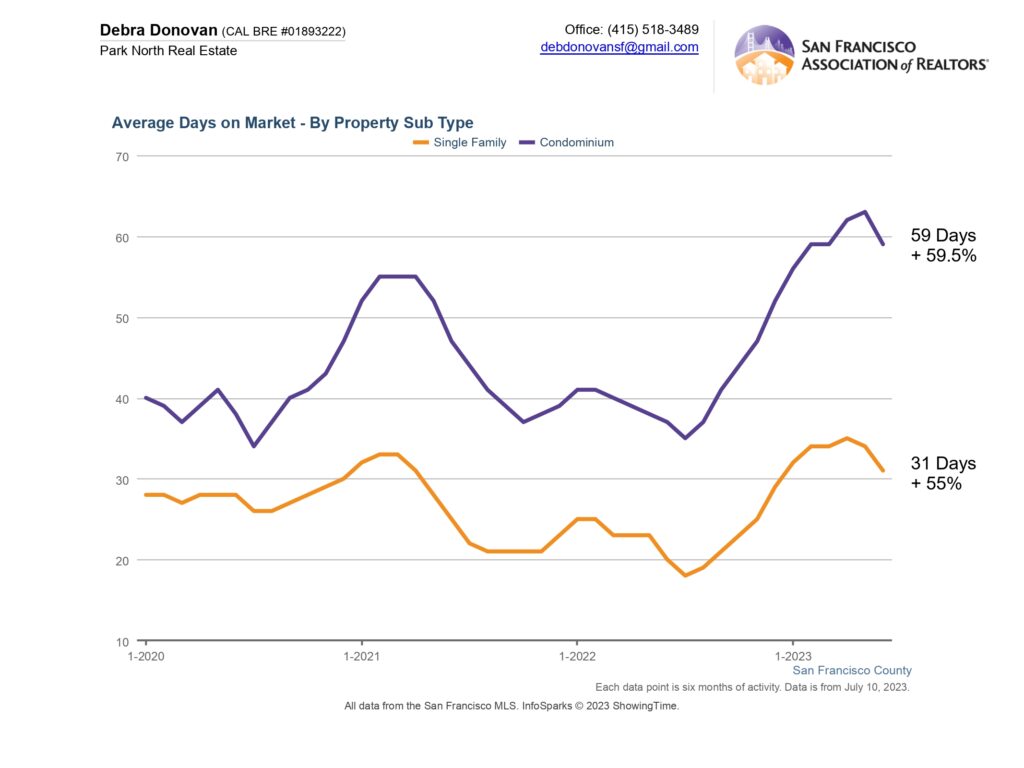
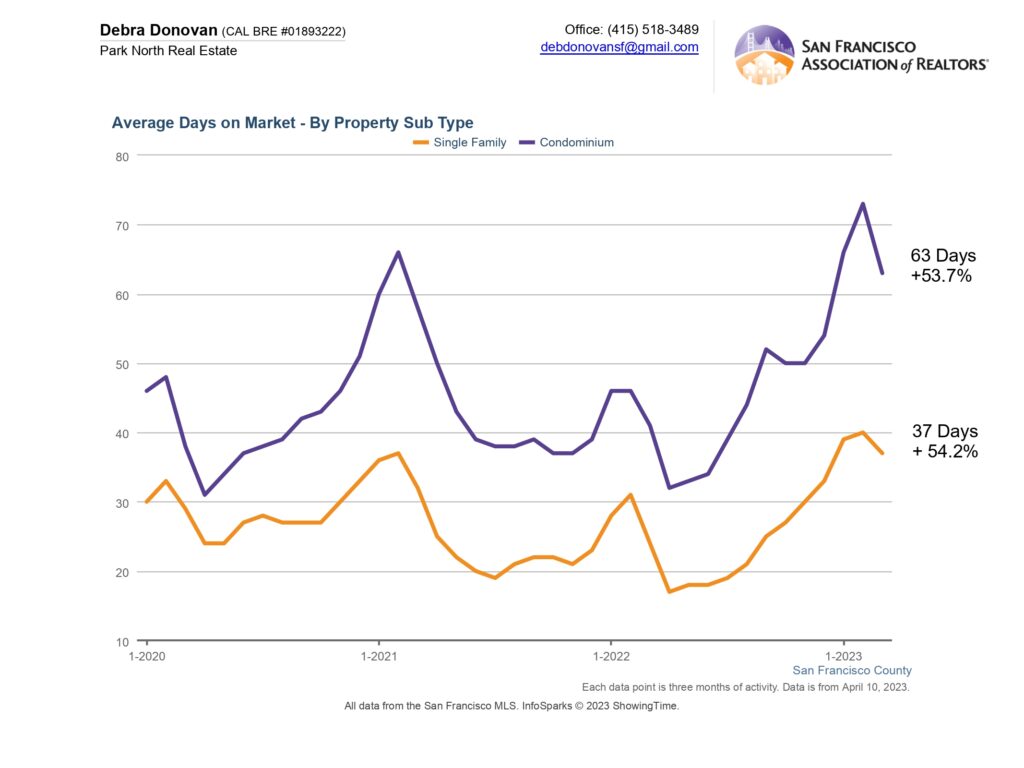
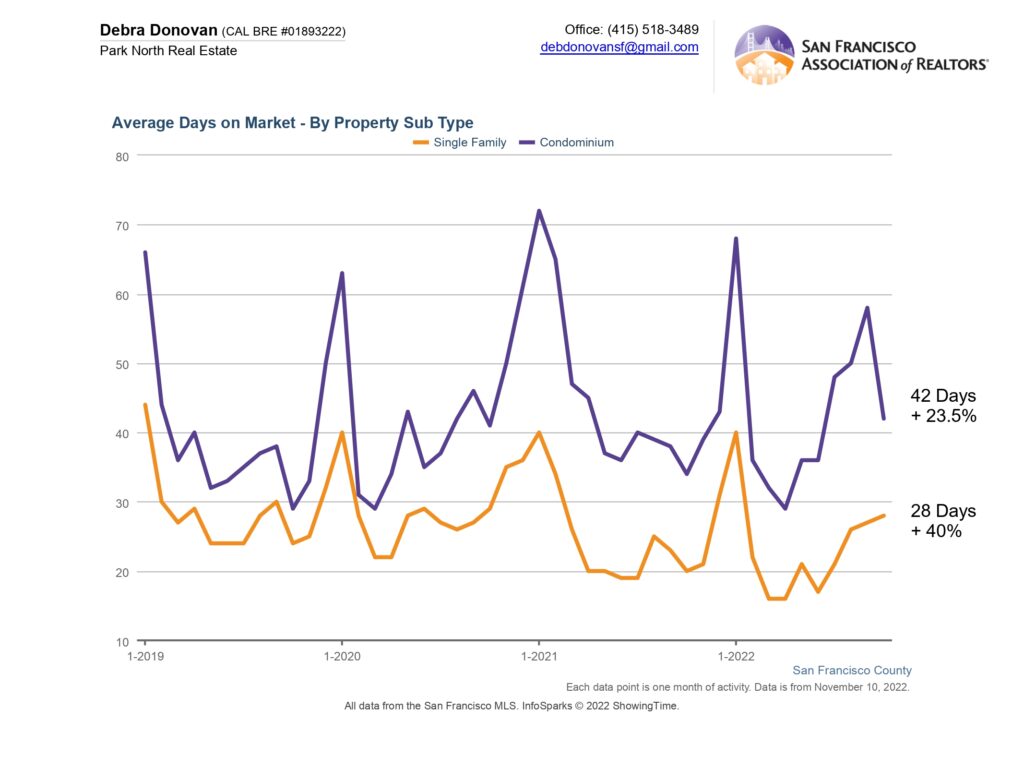
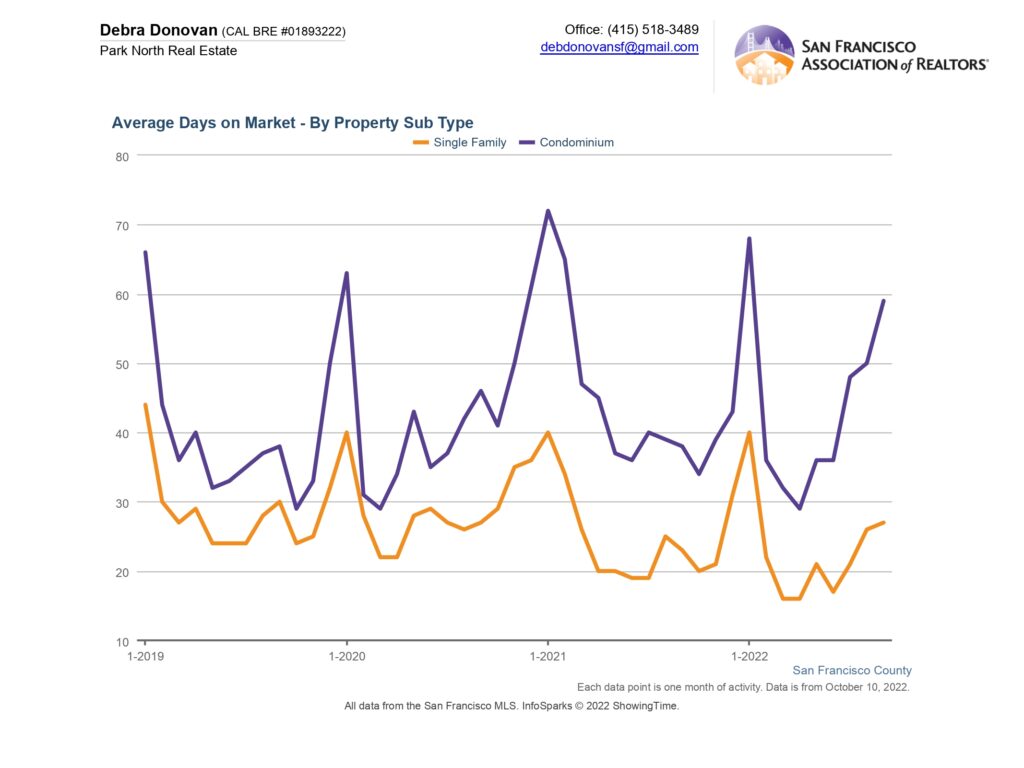
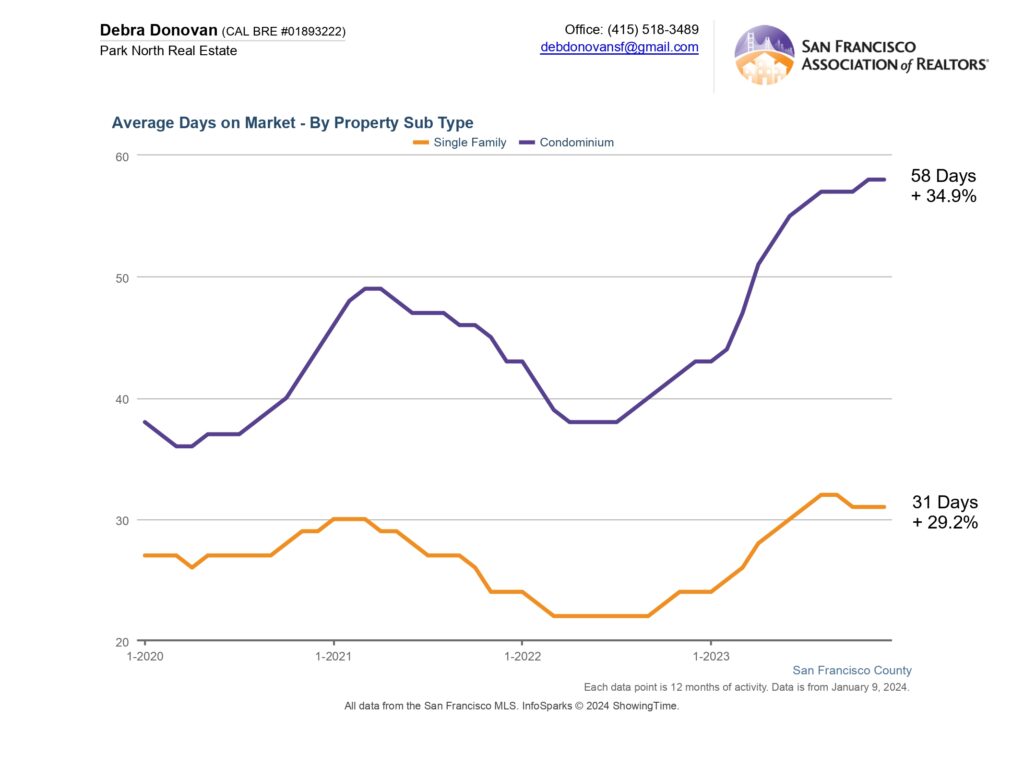
Average Days on Market:
Properties took a bit longer to sell in 2023 compared to 2022. On average, single family homes spent 31 days on the market before accepting an offer, up almost 30% year over year. Condos spent an average of 58 days on the market before going into contract, up 35% compared to 2022.
The fine print: All information deemed reliable but not guaranteed or warranted. Data comes from the MLS so does not include off-market and most new construction condo sales. The Bay Area real estate market is dynamic so statistics can change on a daily basis. These statistics are meant to be a snapshot of the day and time they were pulled.