Single family home prices soared to a new high in May as inventory remained insufficient to meet demand. New and active listings were down while sold listings were up. As a result, there was an increase in the percentage of properties selling over list price, and for the average percent over list price they received.
Single family homes are clearly still in a sellers market with less than 2 months of inventory. The condo market is regaining steam, particularly at the higher price segment of the market and now at just over 3 months of inventory (compared to Q3 2020 with almost 10 months of inventory). The lower, less than $1Million, market continues to be sluggish though.
Keep in mind that last May was the first full month of the pandemic stay-at-home order, so fewer listings were for sale.
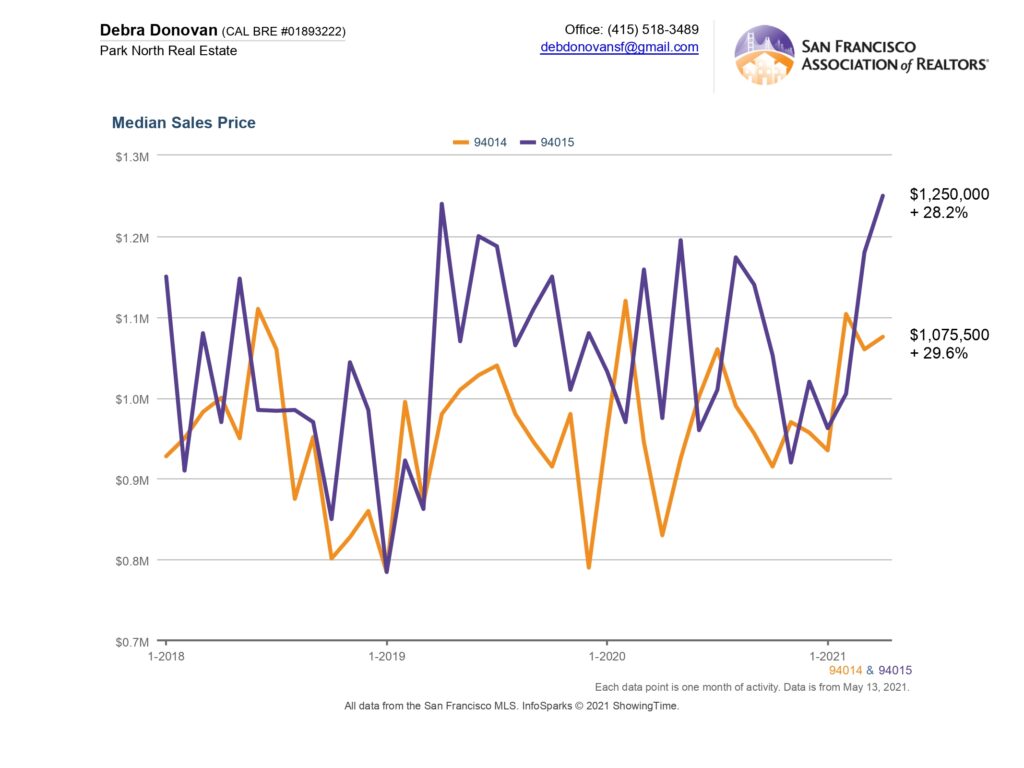
Median Sales Price:
The median price for a single family home hit a new high in May, reaching $1,900,000 and increasing 19.7% year-over-year. The median price for a condo grew 15.9% to $1,242,500, thanks to the higher end of the market. Smaller units in the lower price range are still struggling. As the City and offices start reopening, I would anticipate the condo market will continue to improve.

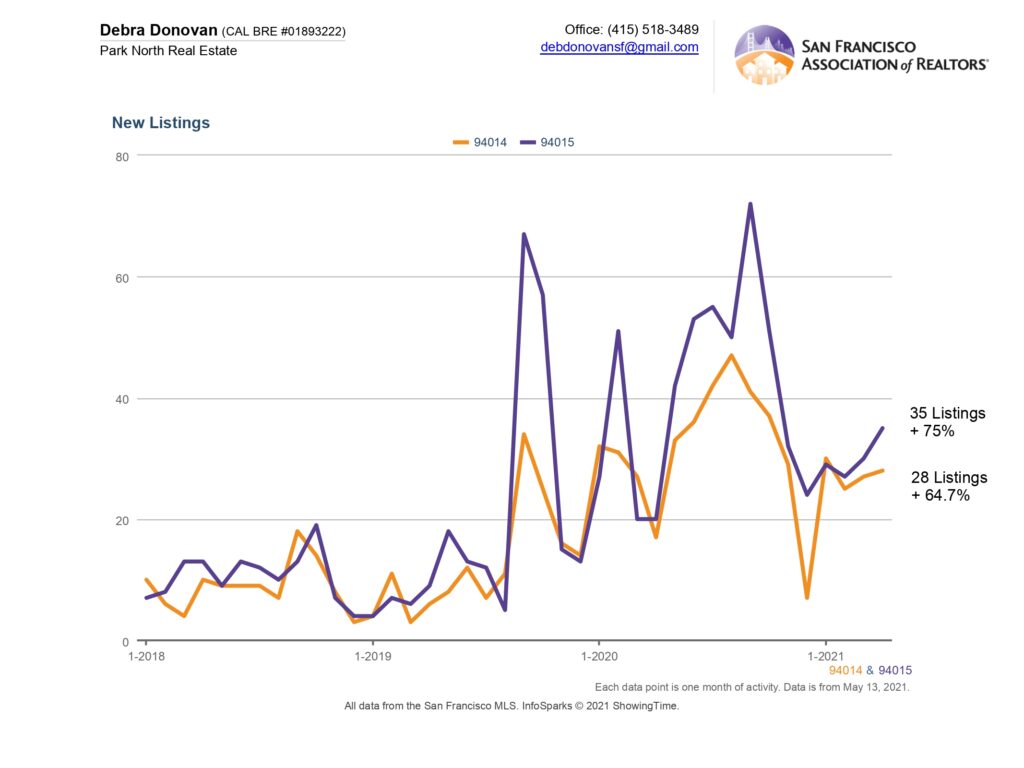
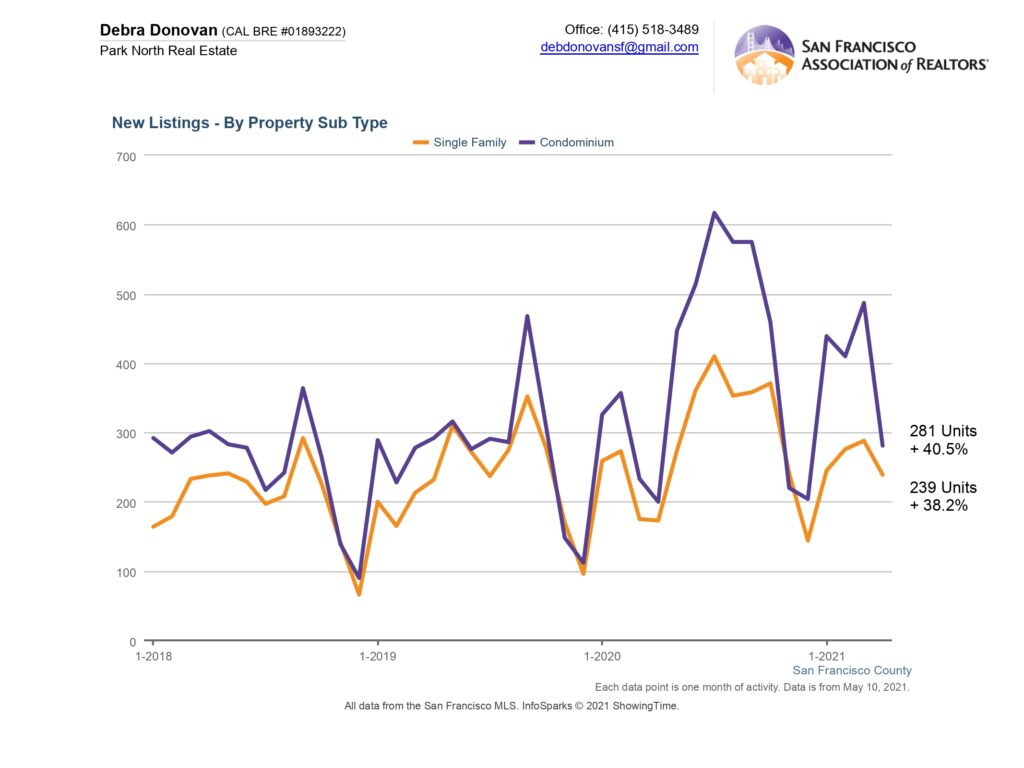
New Listings:
New listings for single family homes were down in May, adding to an already anemic supply compared to enormous demand. New condo listings were also down compared to both the same month last year, and compared to last month.

Active Listings:
Active listings for both single family homes and condos were down in May compared to both last month and last May. Single family home active listings were down over 33%, while active condo listings were down almost 12%. Active listings are the number of listings still available for sale at the end of the month.

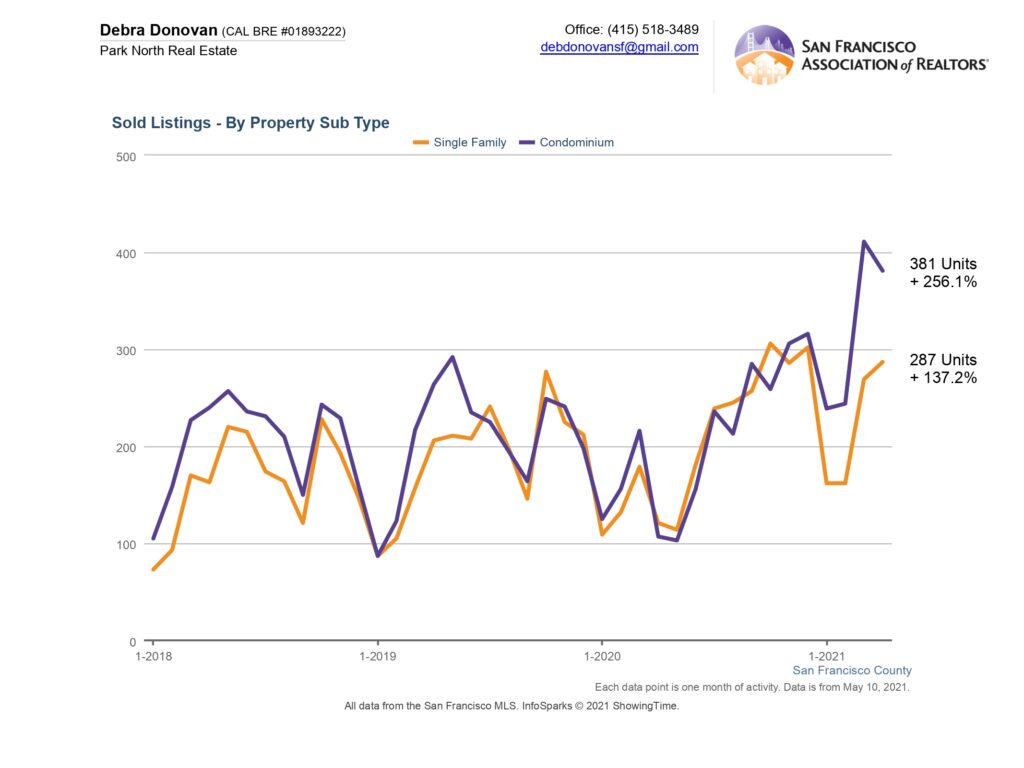
Sold Listings:
Sold listings were up for both single family homes and condos. Year-over-year, single family home sales were up almost 130% and condo sales were up over 267%. This large percentage of increase, however, is not just due to increased demand. When comparing year-over-year, both market segments were down in 2020 due to the pandemic.

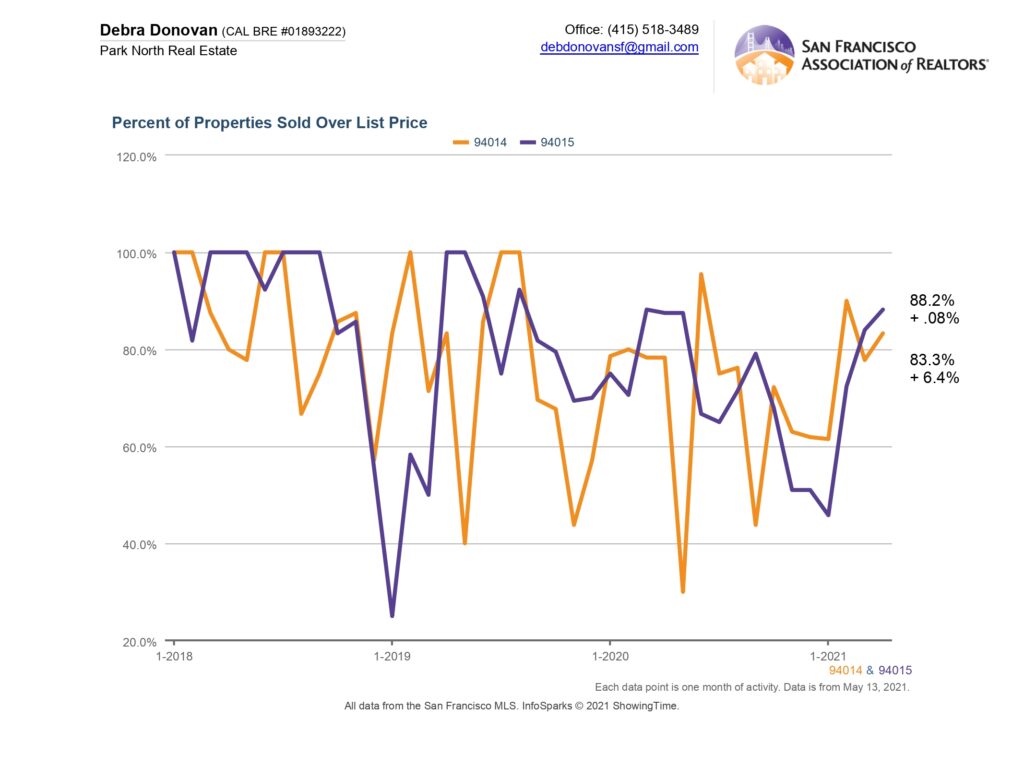
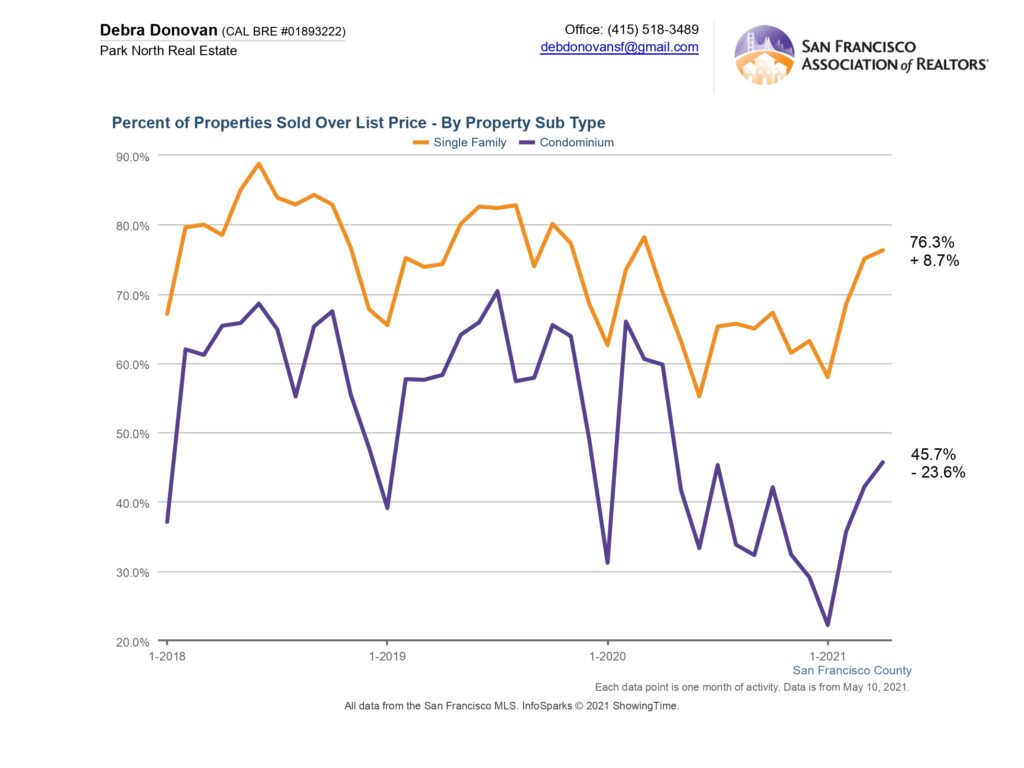
Percentage of Properties Sold Over List Price:
About 80% of single family homes sold for over their list price in May, up 26% year-over-year. To be fair, often homes are marketed below their true value (or the seller’s desired price) as a marketing strategy to create a multiple offer situation. Over half of condos sold for over their list price, up 5% year-over-year, and the highest percentage we’ve seen since April 2020, just at the onset of the pandemic.

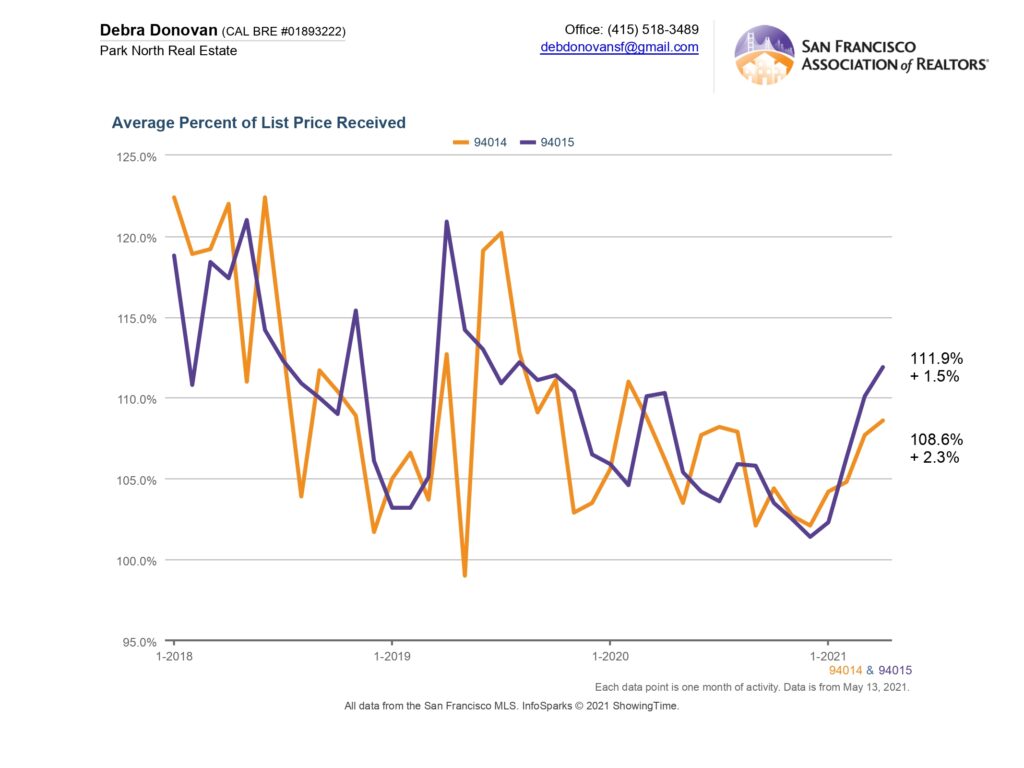
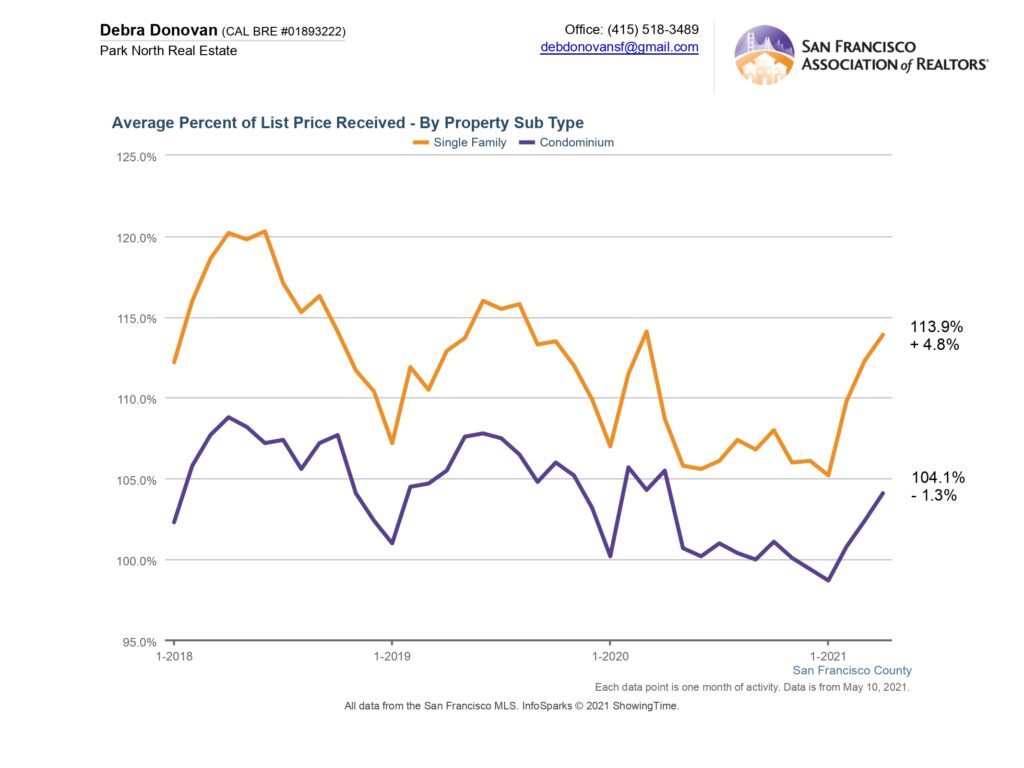
Average Percentage of List Price Received:
On average, single family homes received 116.8% of their list price in May, up 10% compared to May 2020. Condos sold for an average of almost 6% over asking price, up 5% compared to the same month last year. Again, the higher in price point for condos, the more competitive.

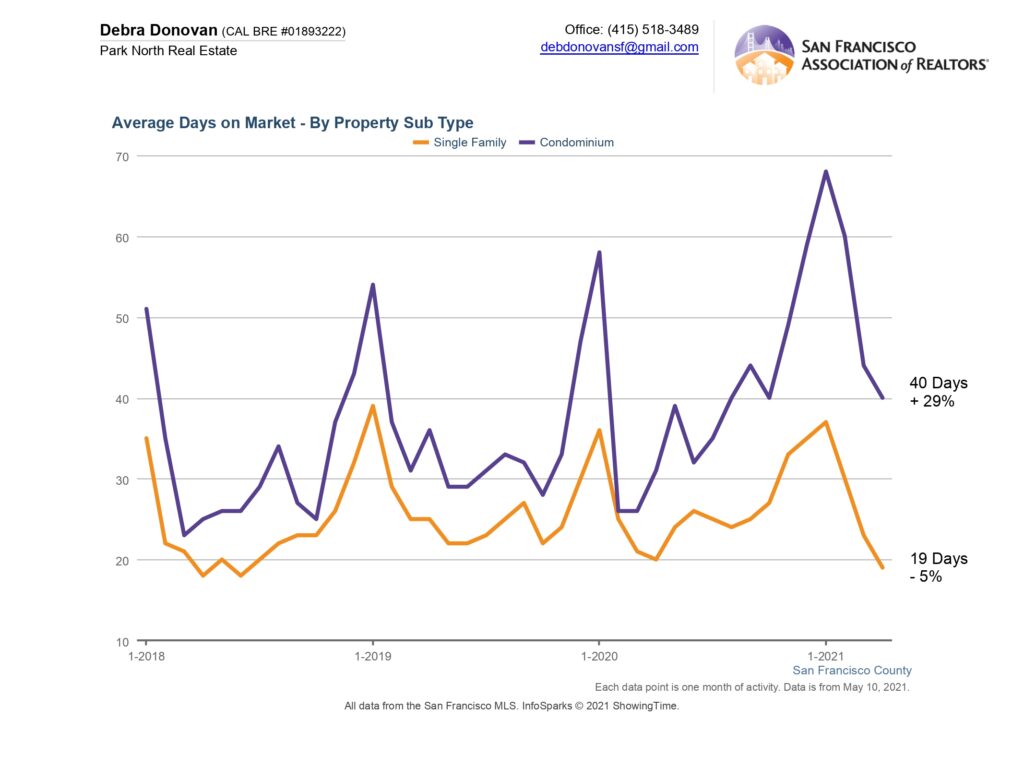
Average Days on Market:
Single family homes spent an average of 18 days on the market before accepting an offer, down 25% compared to last May. Condos spent an average of 33 days on the market, down more than 15% year-over-year.

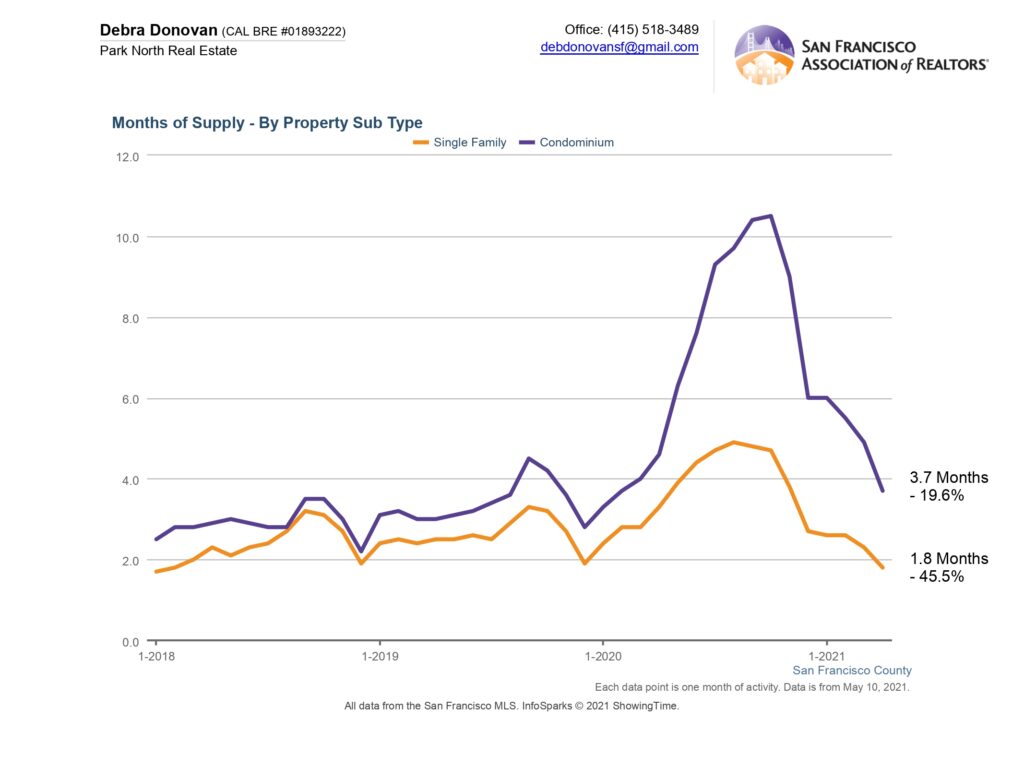
Months Supply of Inventory:
Single family homes had just 1.7 months of inventory in May, down more than 56% compared to last May. Condos’ and lofts had just 3.3 months of inventory, down more than 47% year-over-year.

The fine print: All information deemed reliable but not guaranteed or warranted. Data comes from the MLS so does not include off-market and most new construction condo sales. The Bay Area real estate market is dynamic so statistics can change on a daily basis. These statistics are meant to be a snapshot of the day and time they were pulle