There’s been a lot of chatter about the softening of the San Francisco real estate market, particularly in the past couple of months. The good news, though, is that buyers are still buying and sellers are still selling. Interest rates remain incredibly low and people still want to own a piece of this beautiful city.
The San Francisco market continues to see sales price growth, though perhaps more modest than what we’ve seen in recent years even including the solid growth of the market this past Spring. It’s important to note, though, that real estate is both cyclical and seasonal. A cycle usually lasts anywhere from 8-10 years. The high selling seasons are typically Spring and Fall. The statistics change month-to-month and it’s only by looking at longer-term data that any definitive trend will appear. And, like most things, such trends are often only seen in hindsight.
Here are the monthly statistics for September and the 3rd Quarter. Keep in mind that September data reflects homes that were on the market in August, which is typically a slower real estate month. We won’t know the results of this Fall season for another couple of months.
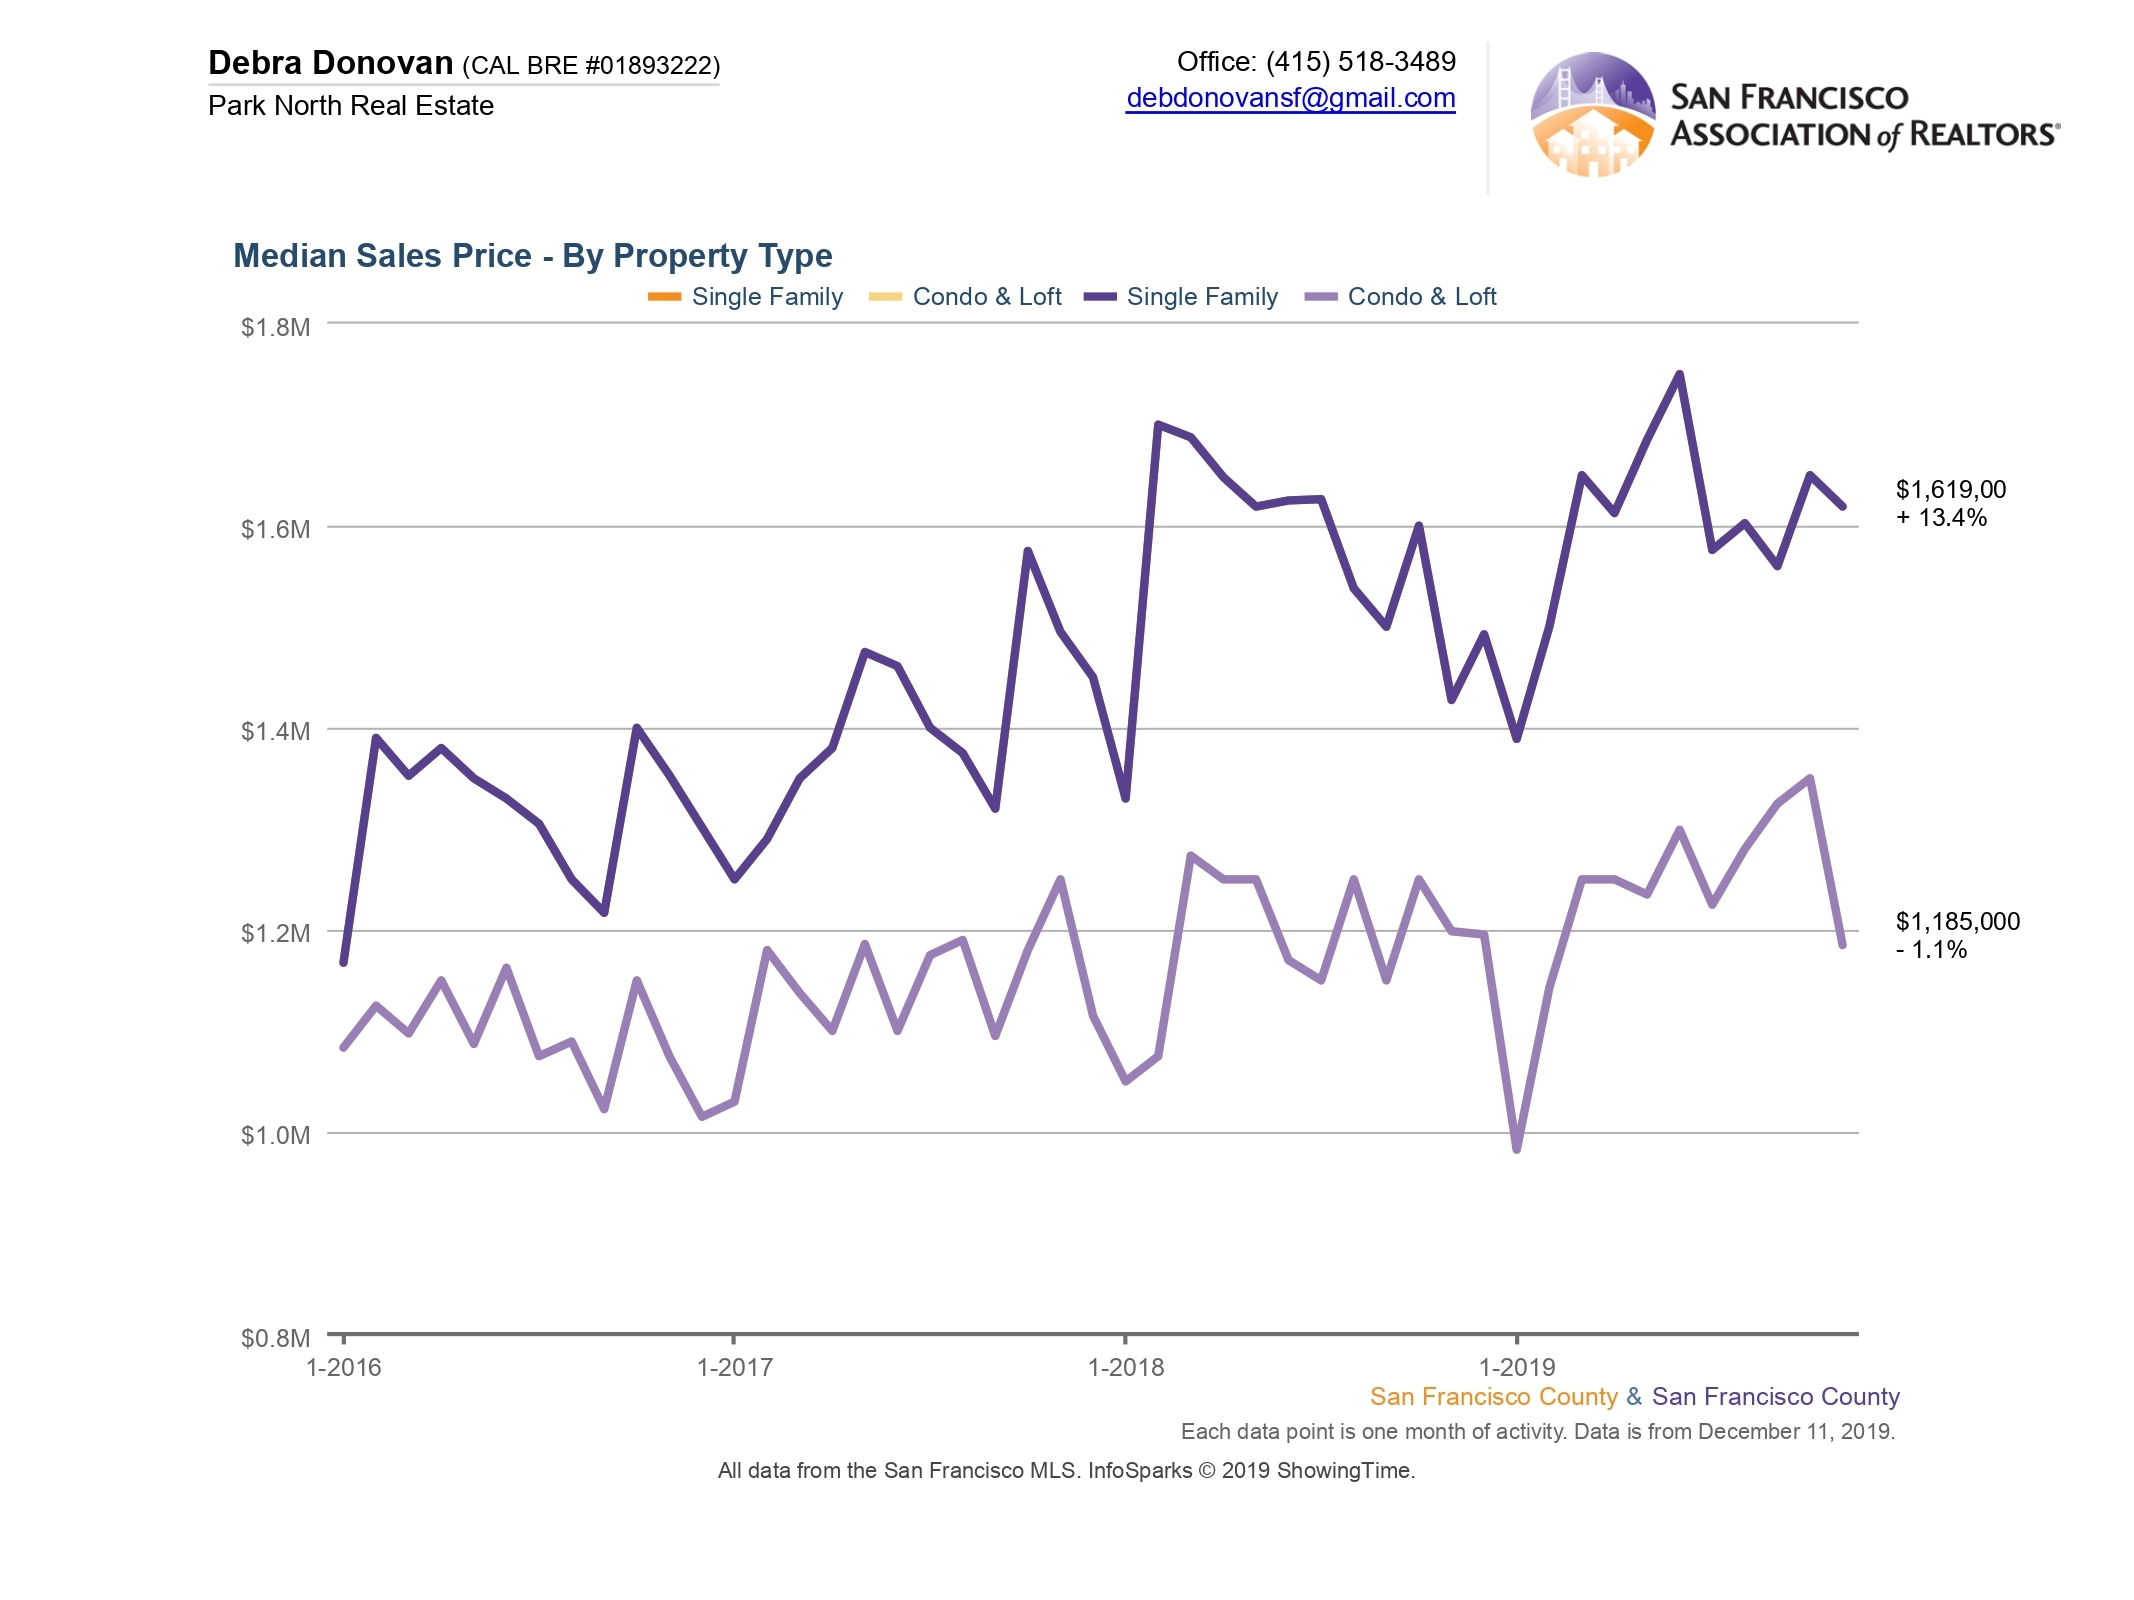
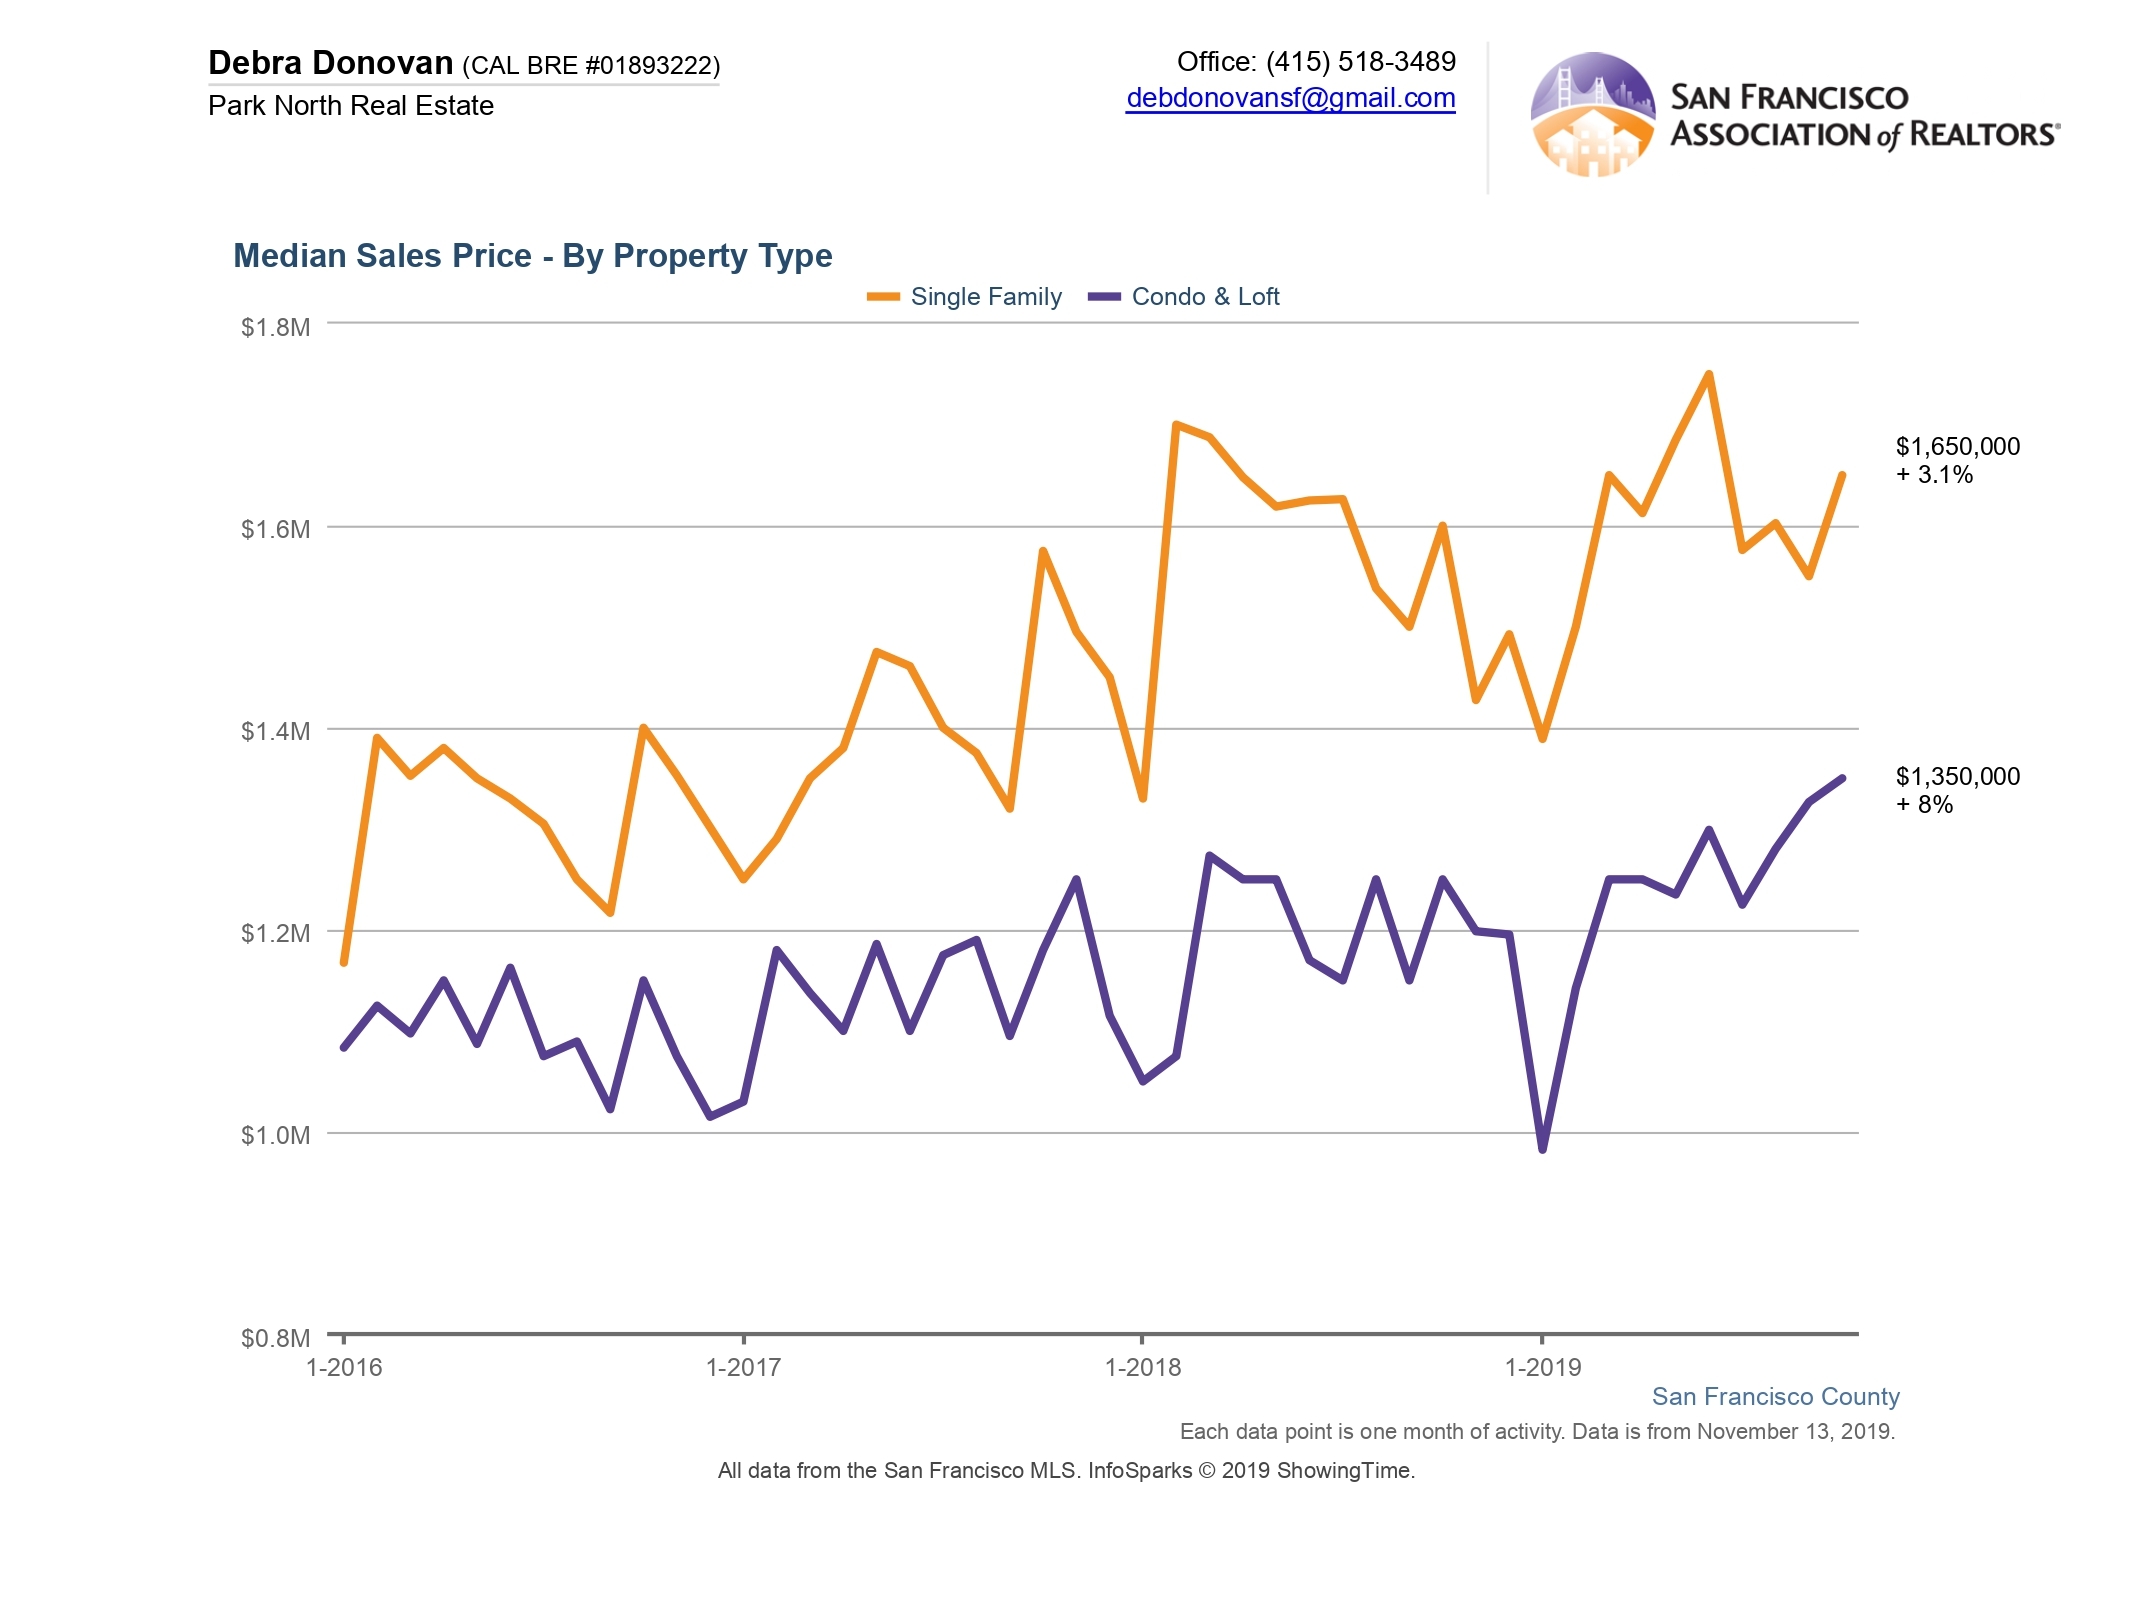
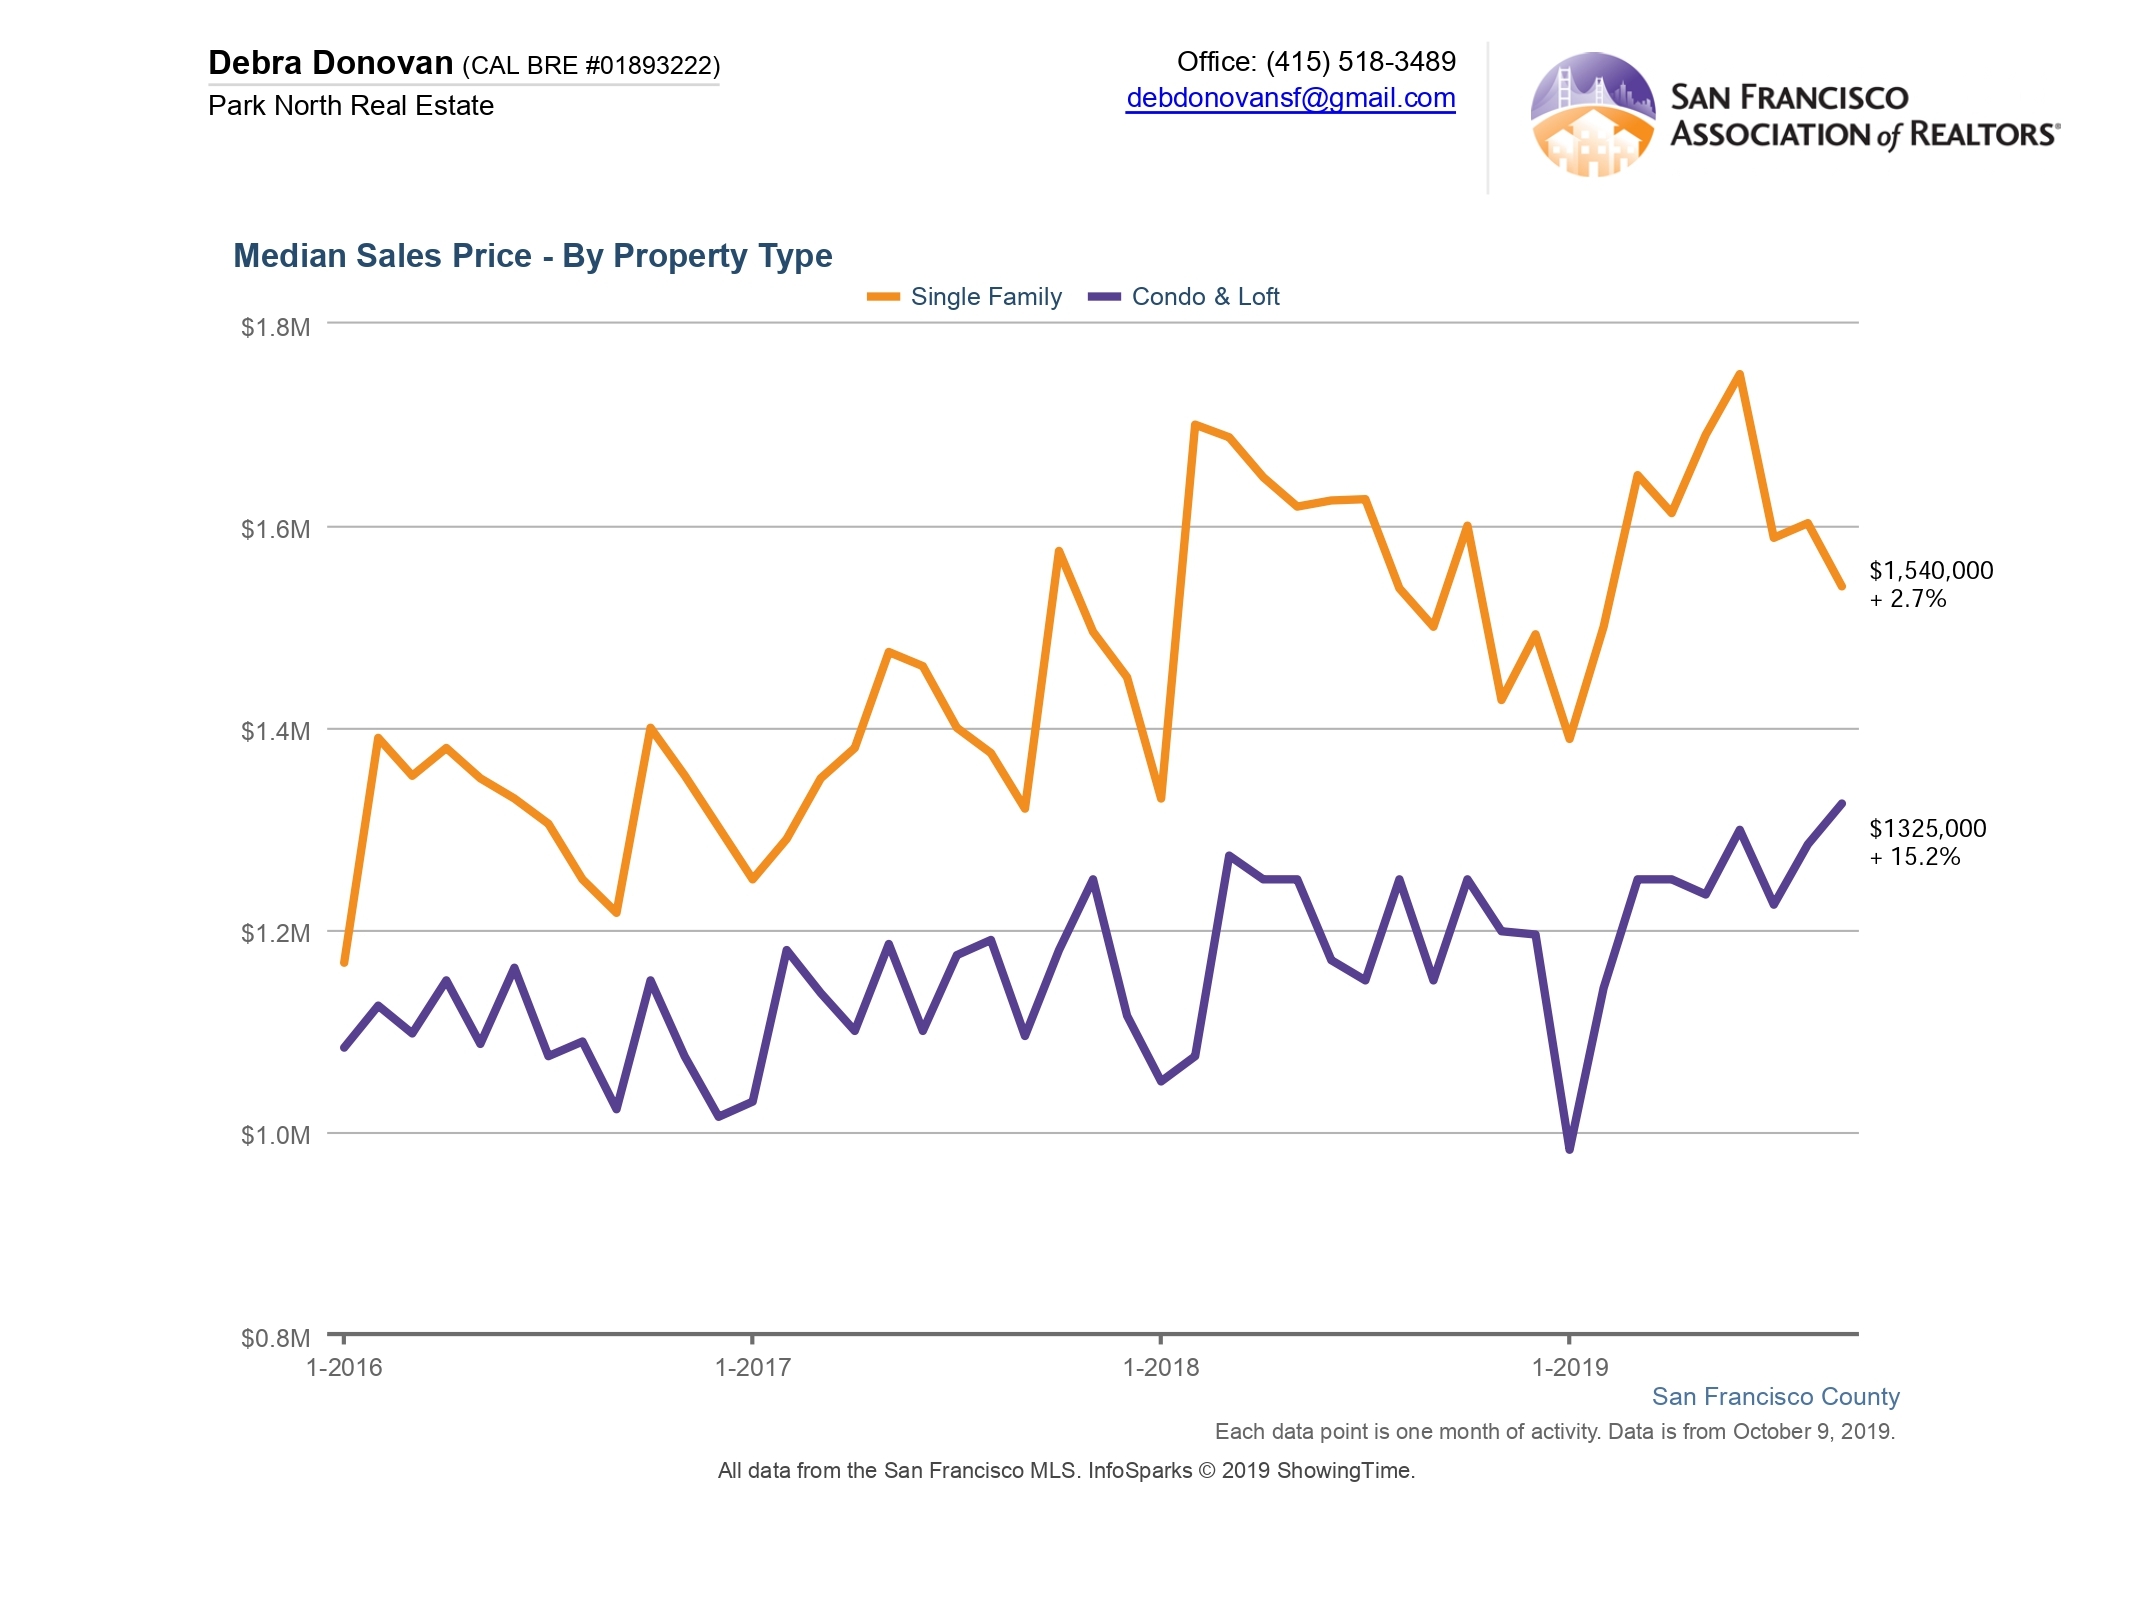
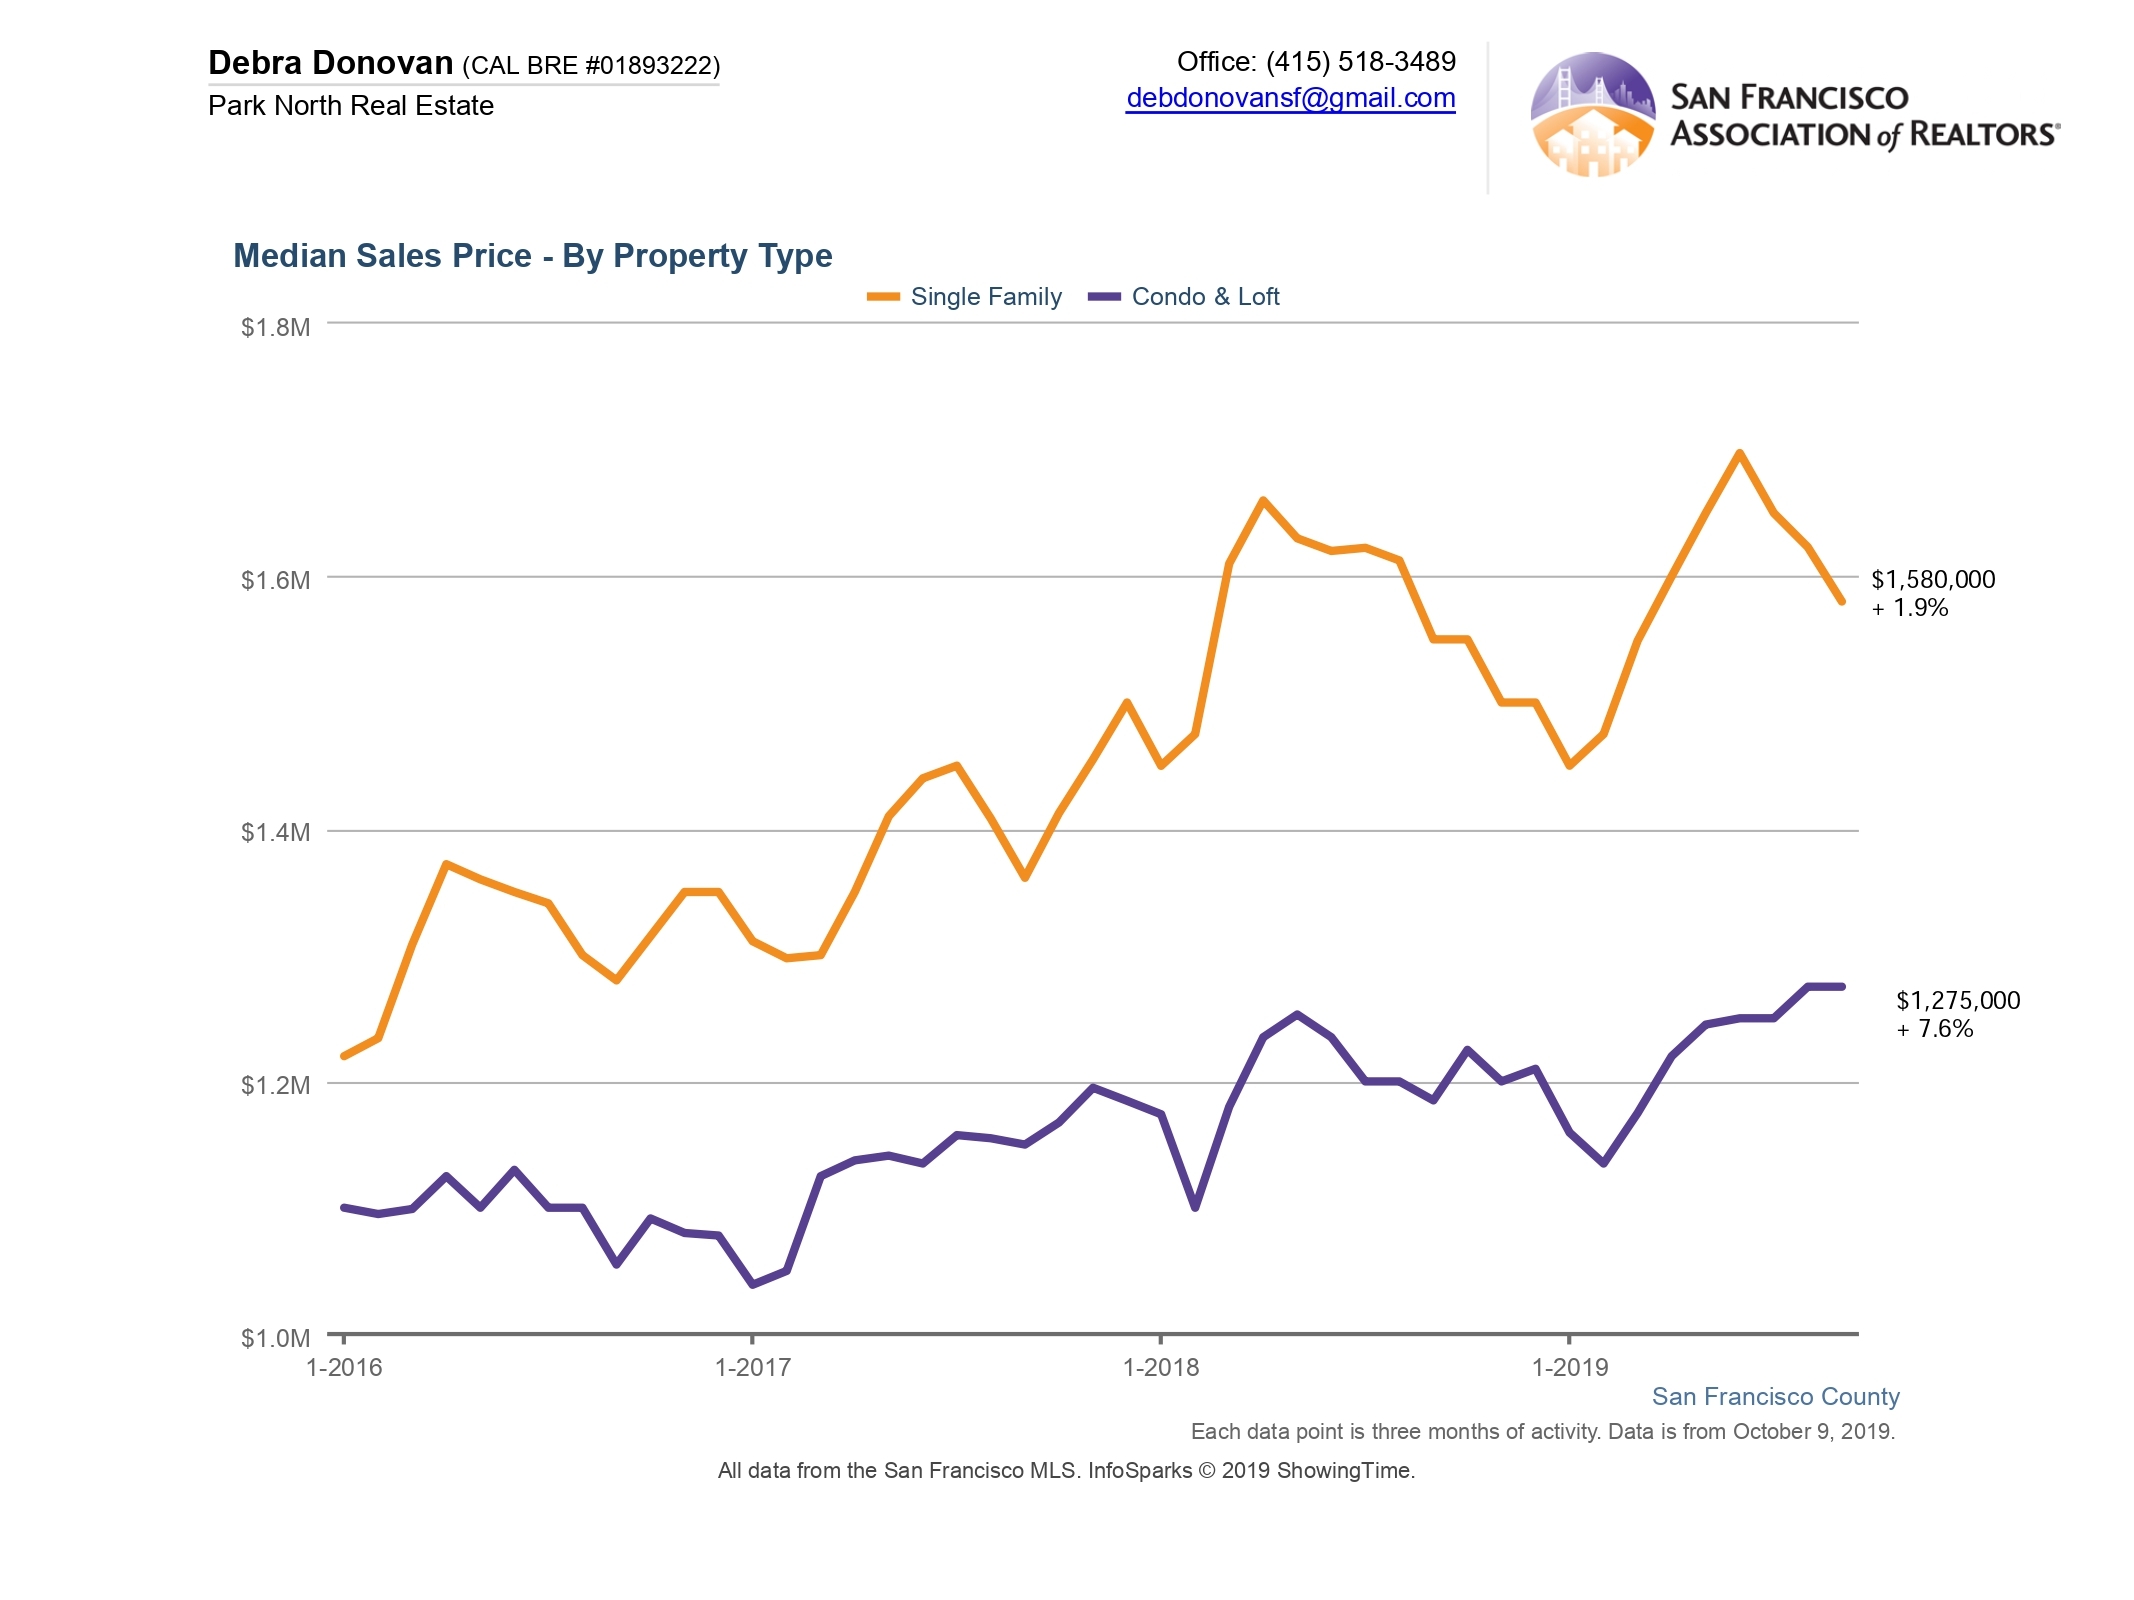
Median Sales Price:
In September median sales prices continued to rise for both single family homes and condos. Condos and lofts reached a new high median price of $1,325,000. Single family homes grew more modestly, about 2.7%, compared to the same month a year ago.
The 3rd Quarter also showed gains for median sales price compared to the previous year, with single family home prices up around 2% and condos and lofts up over 7%.
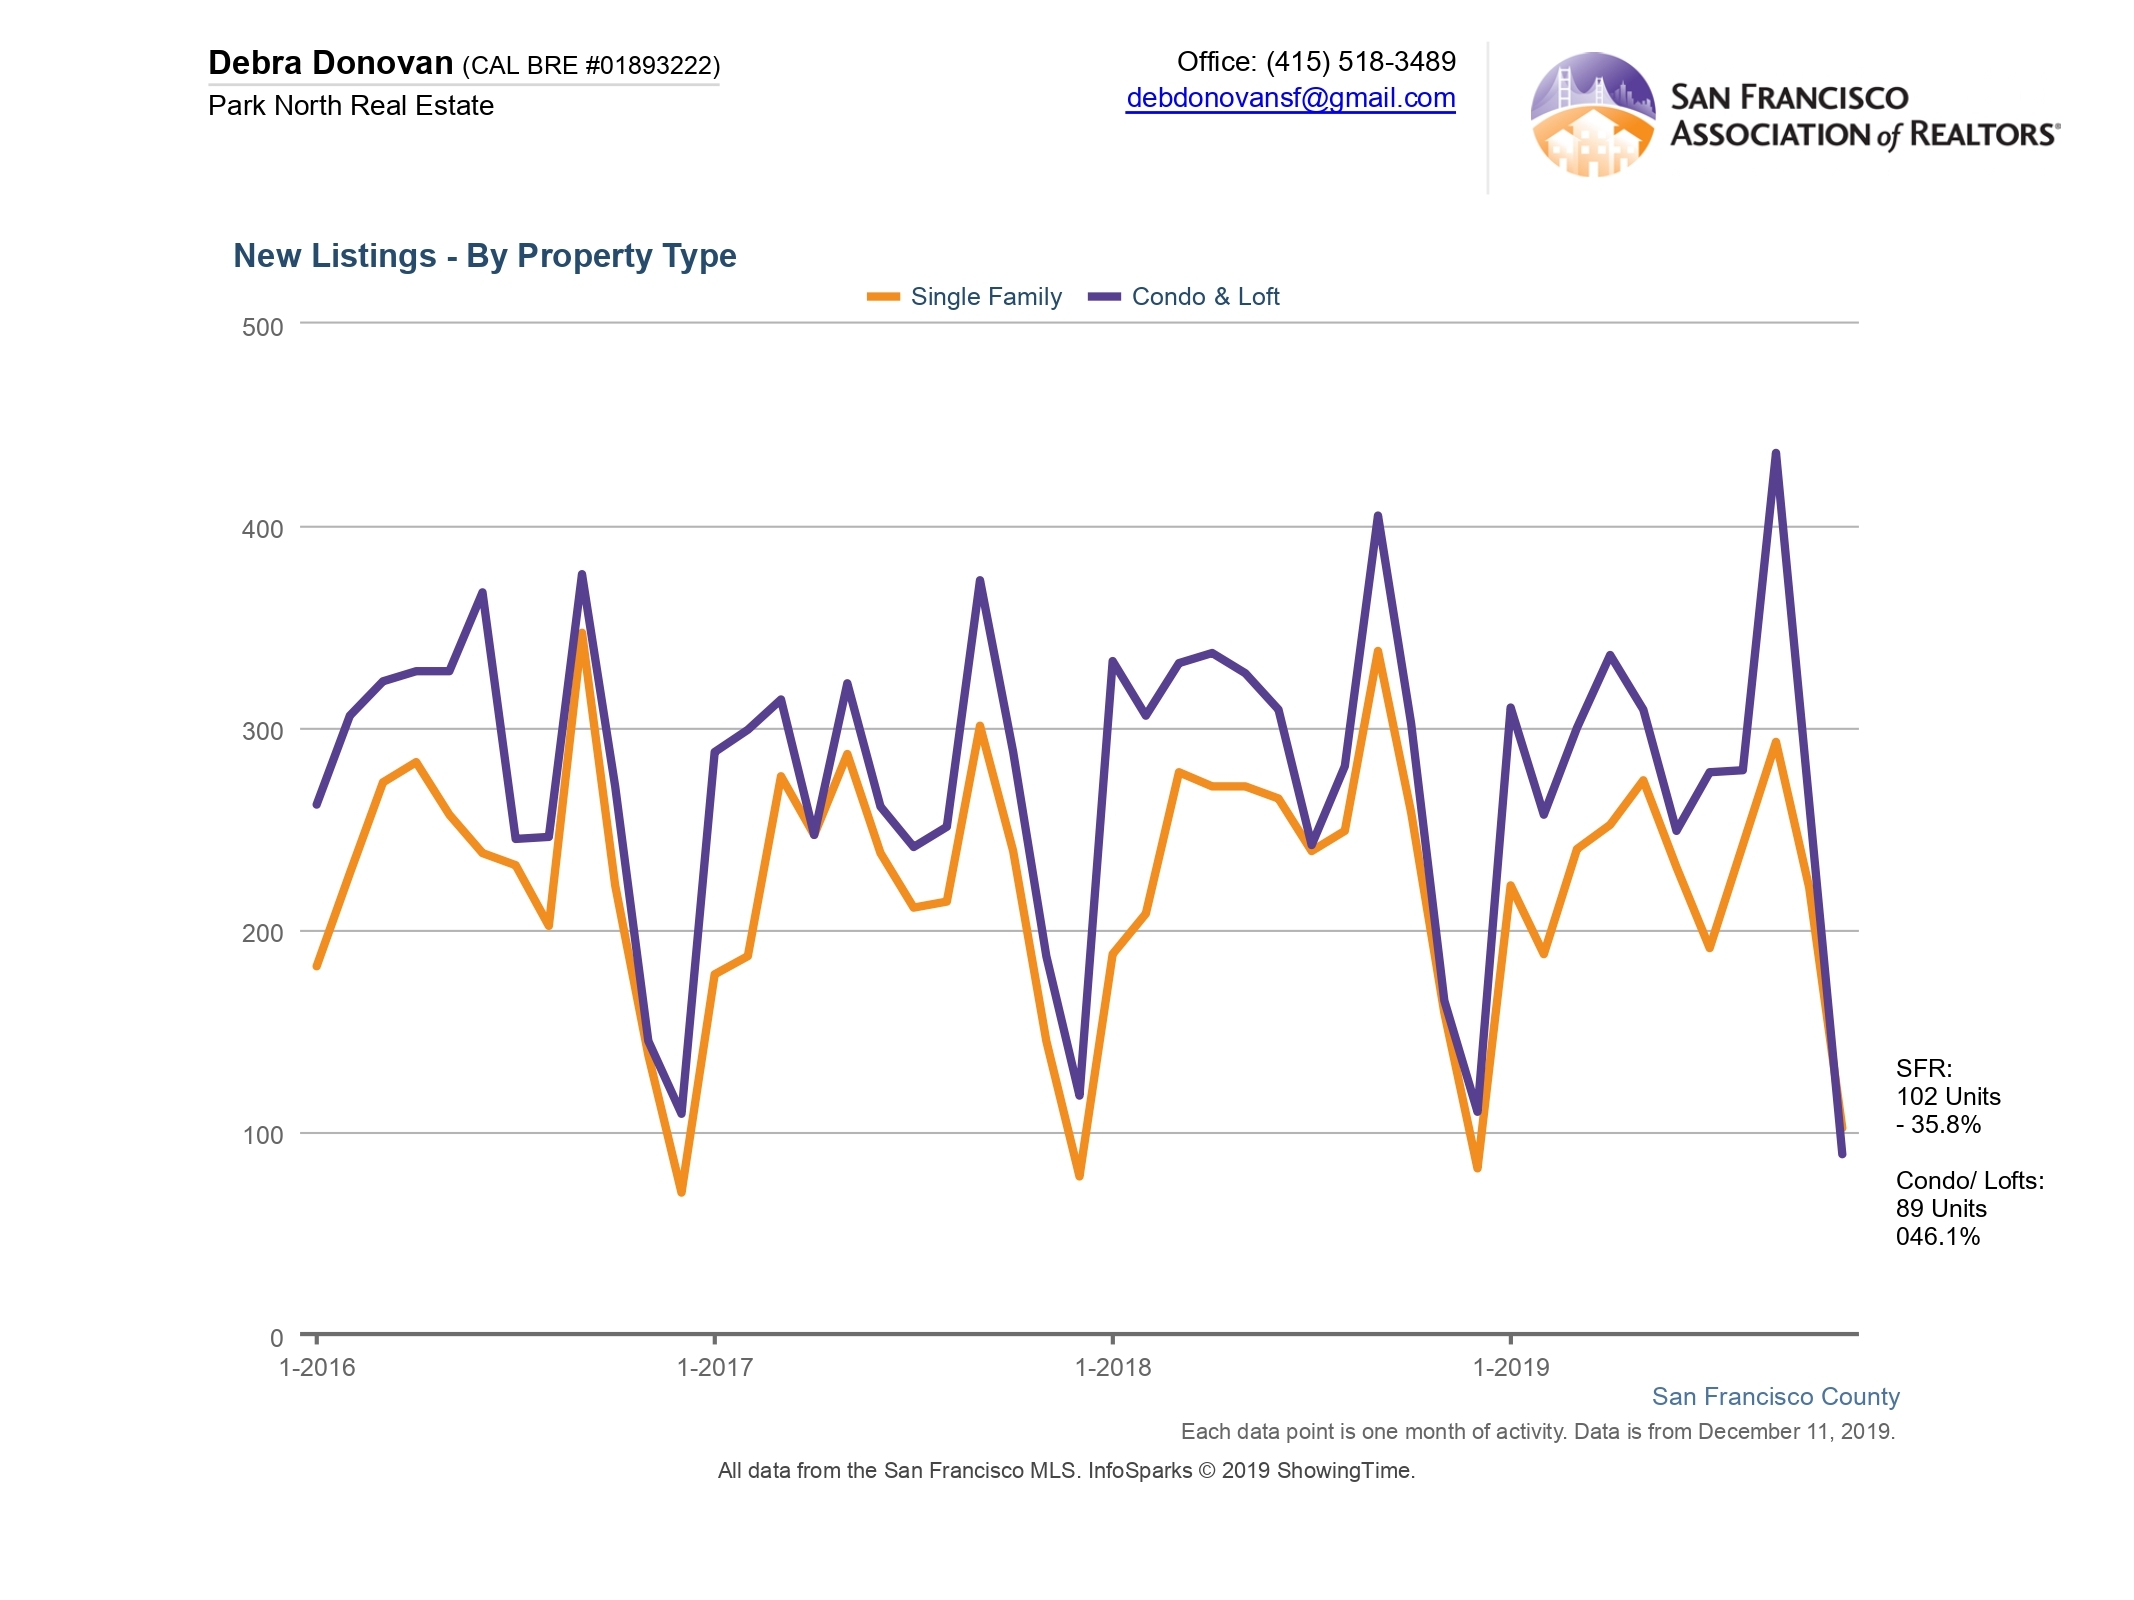
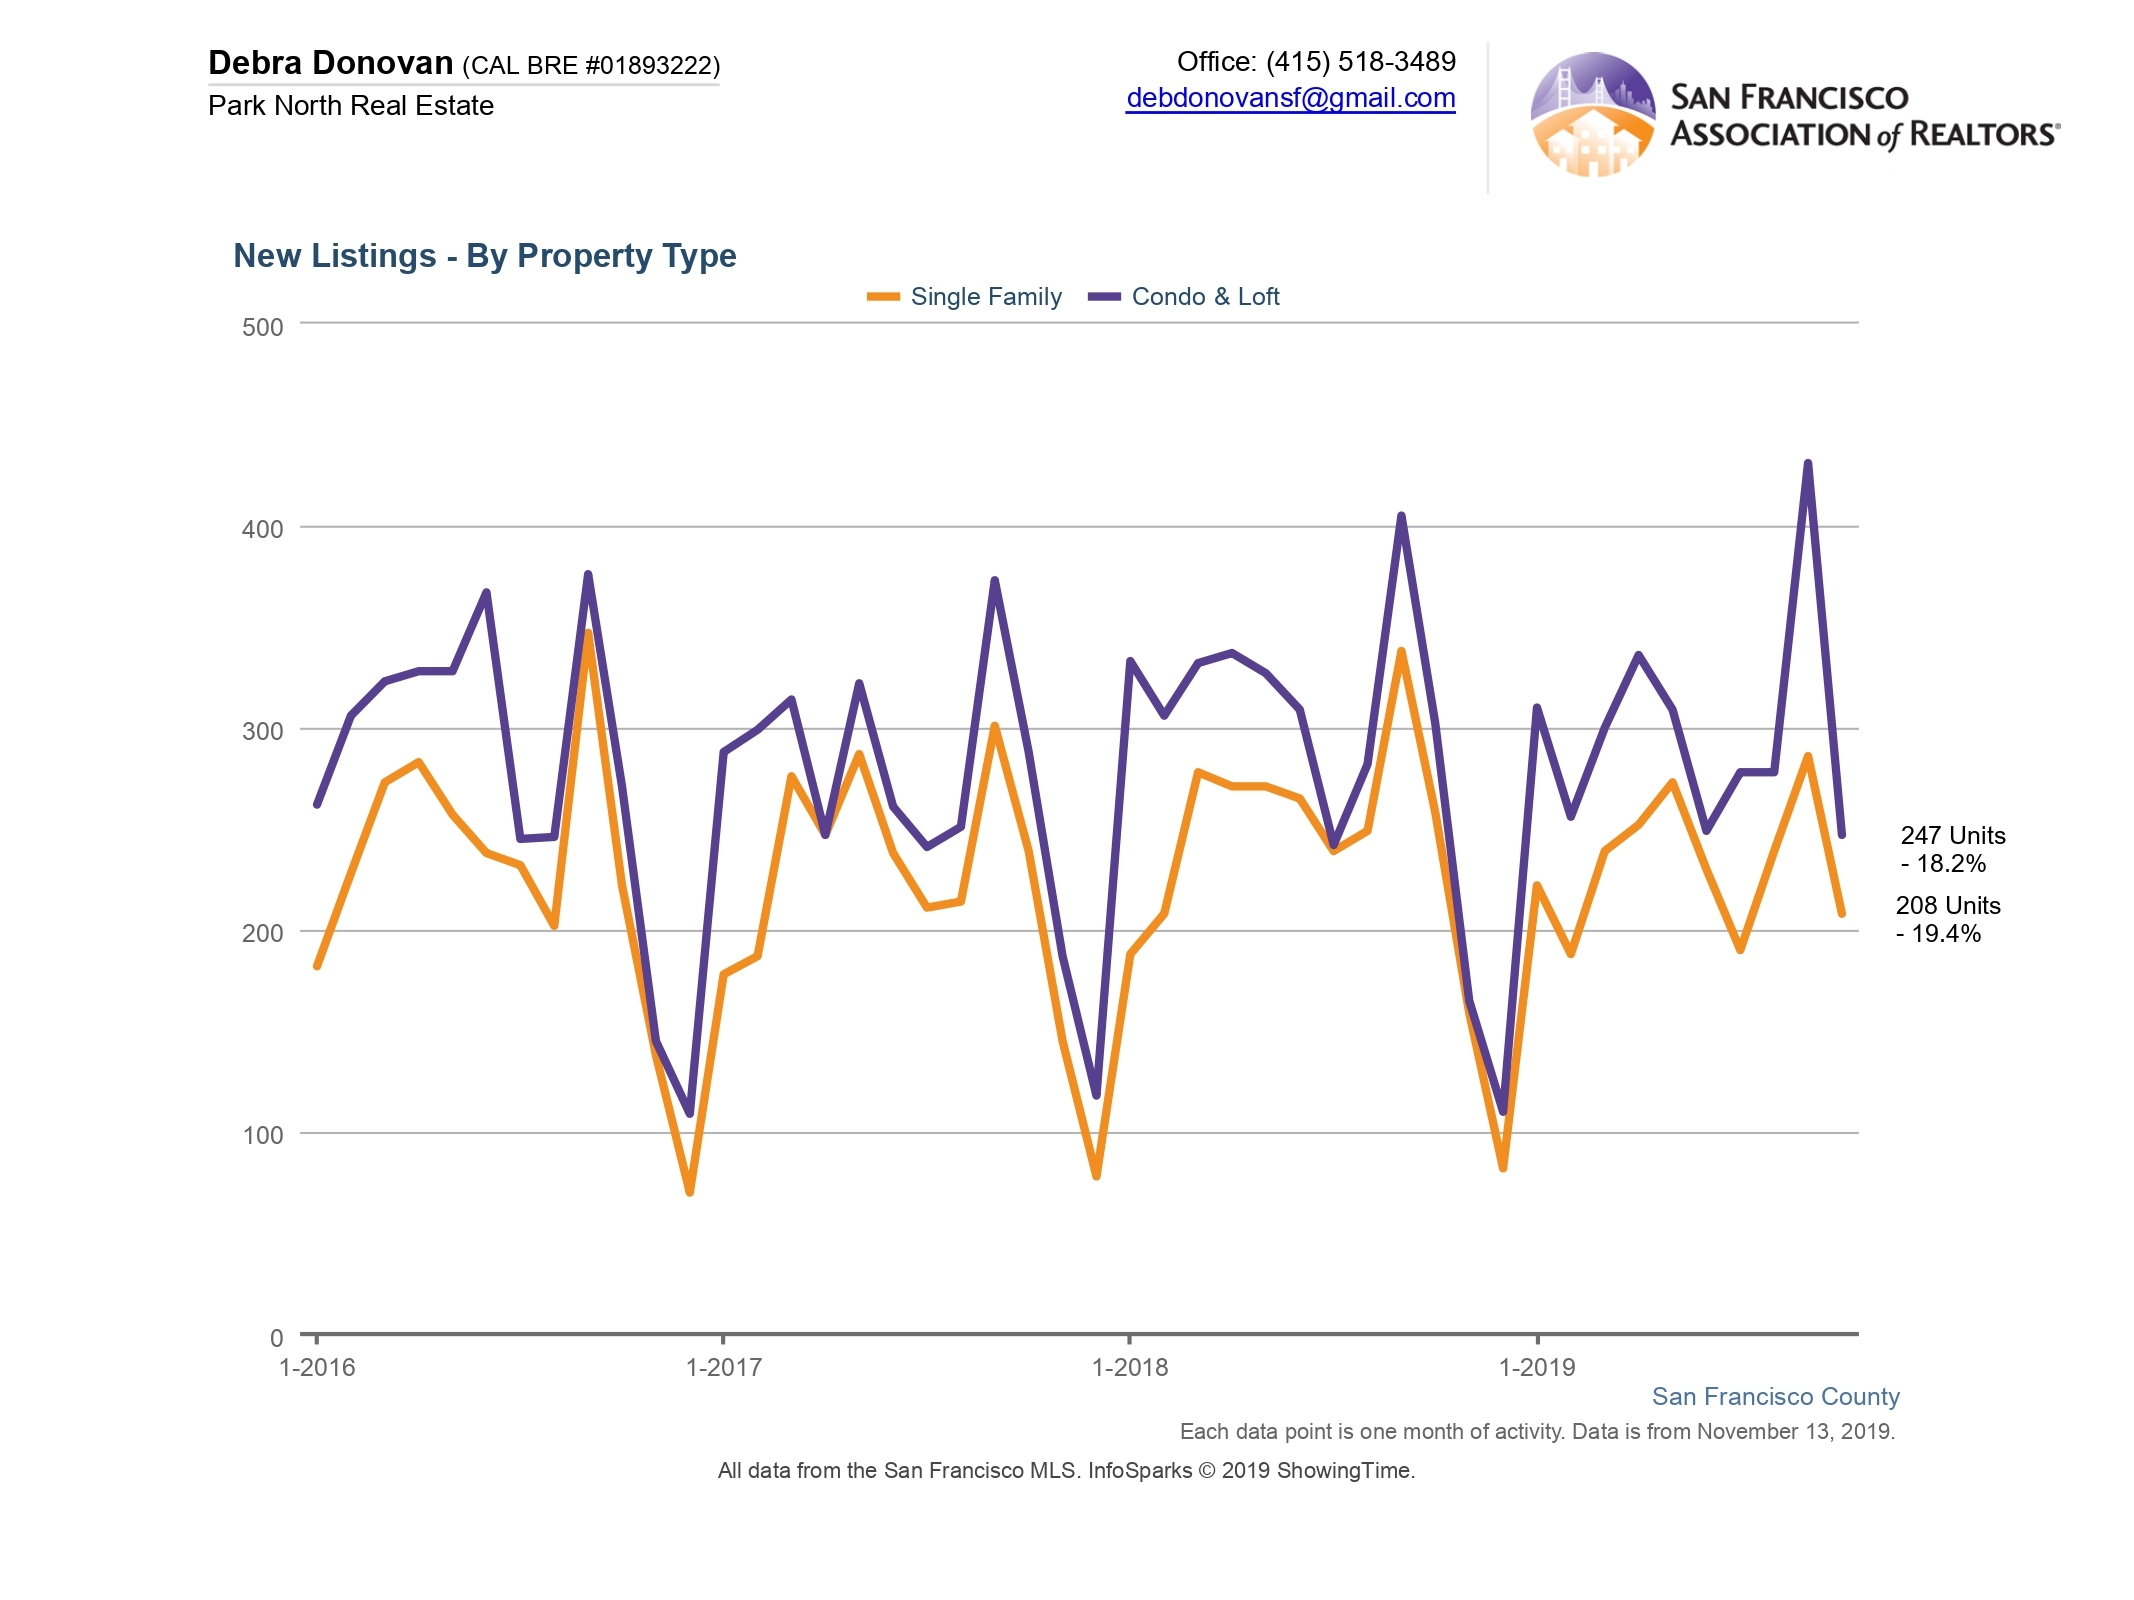
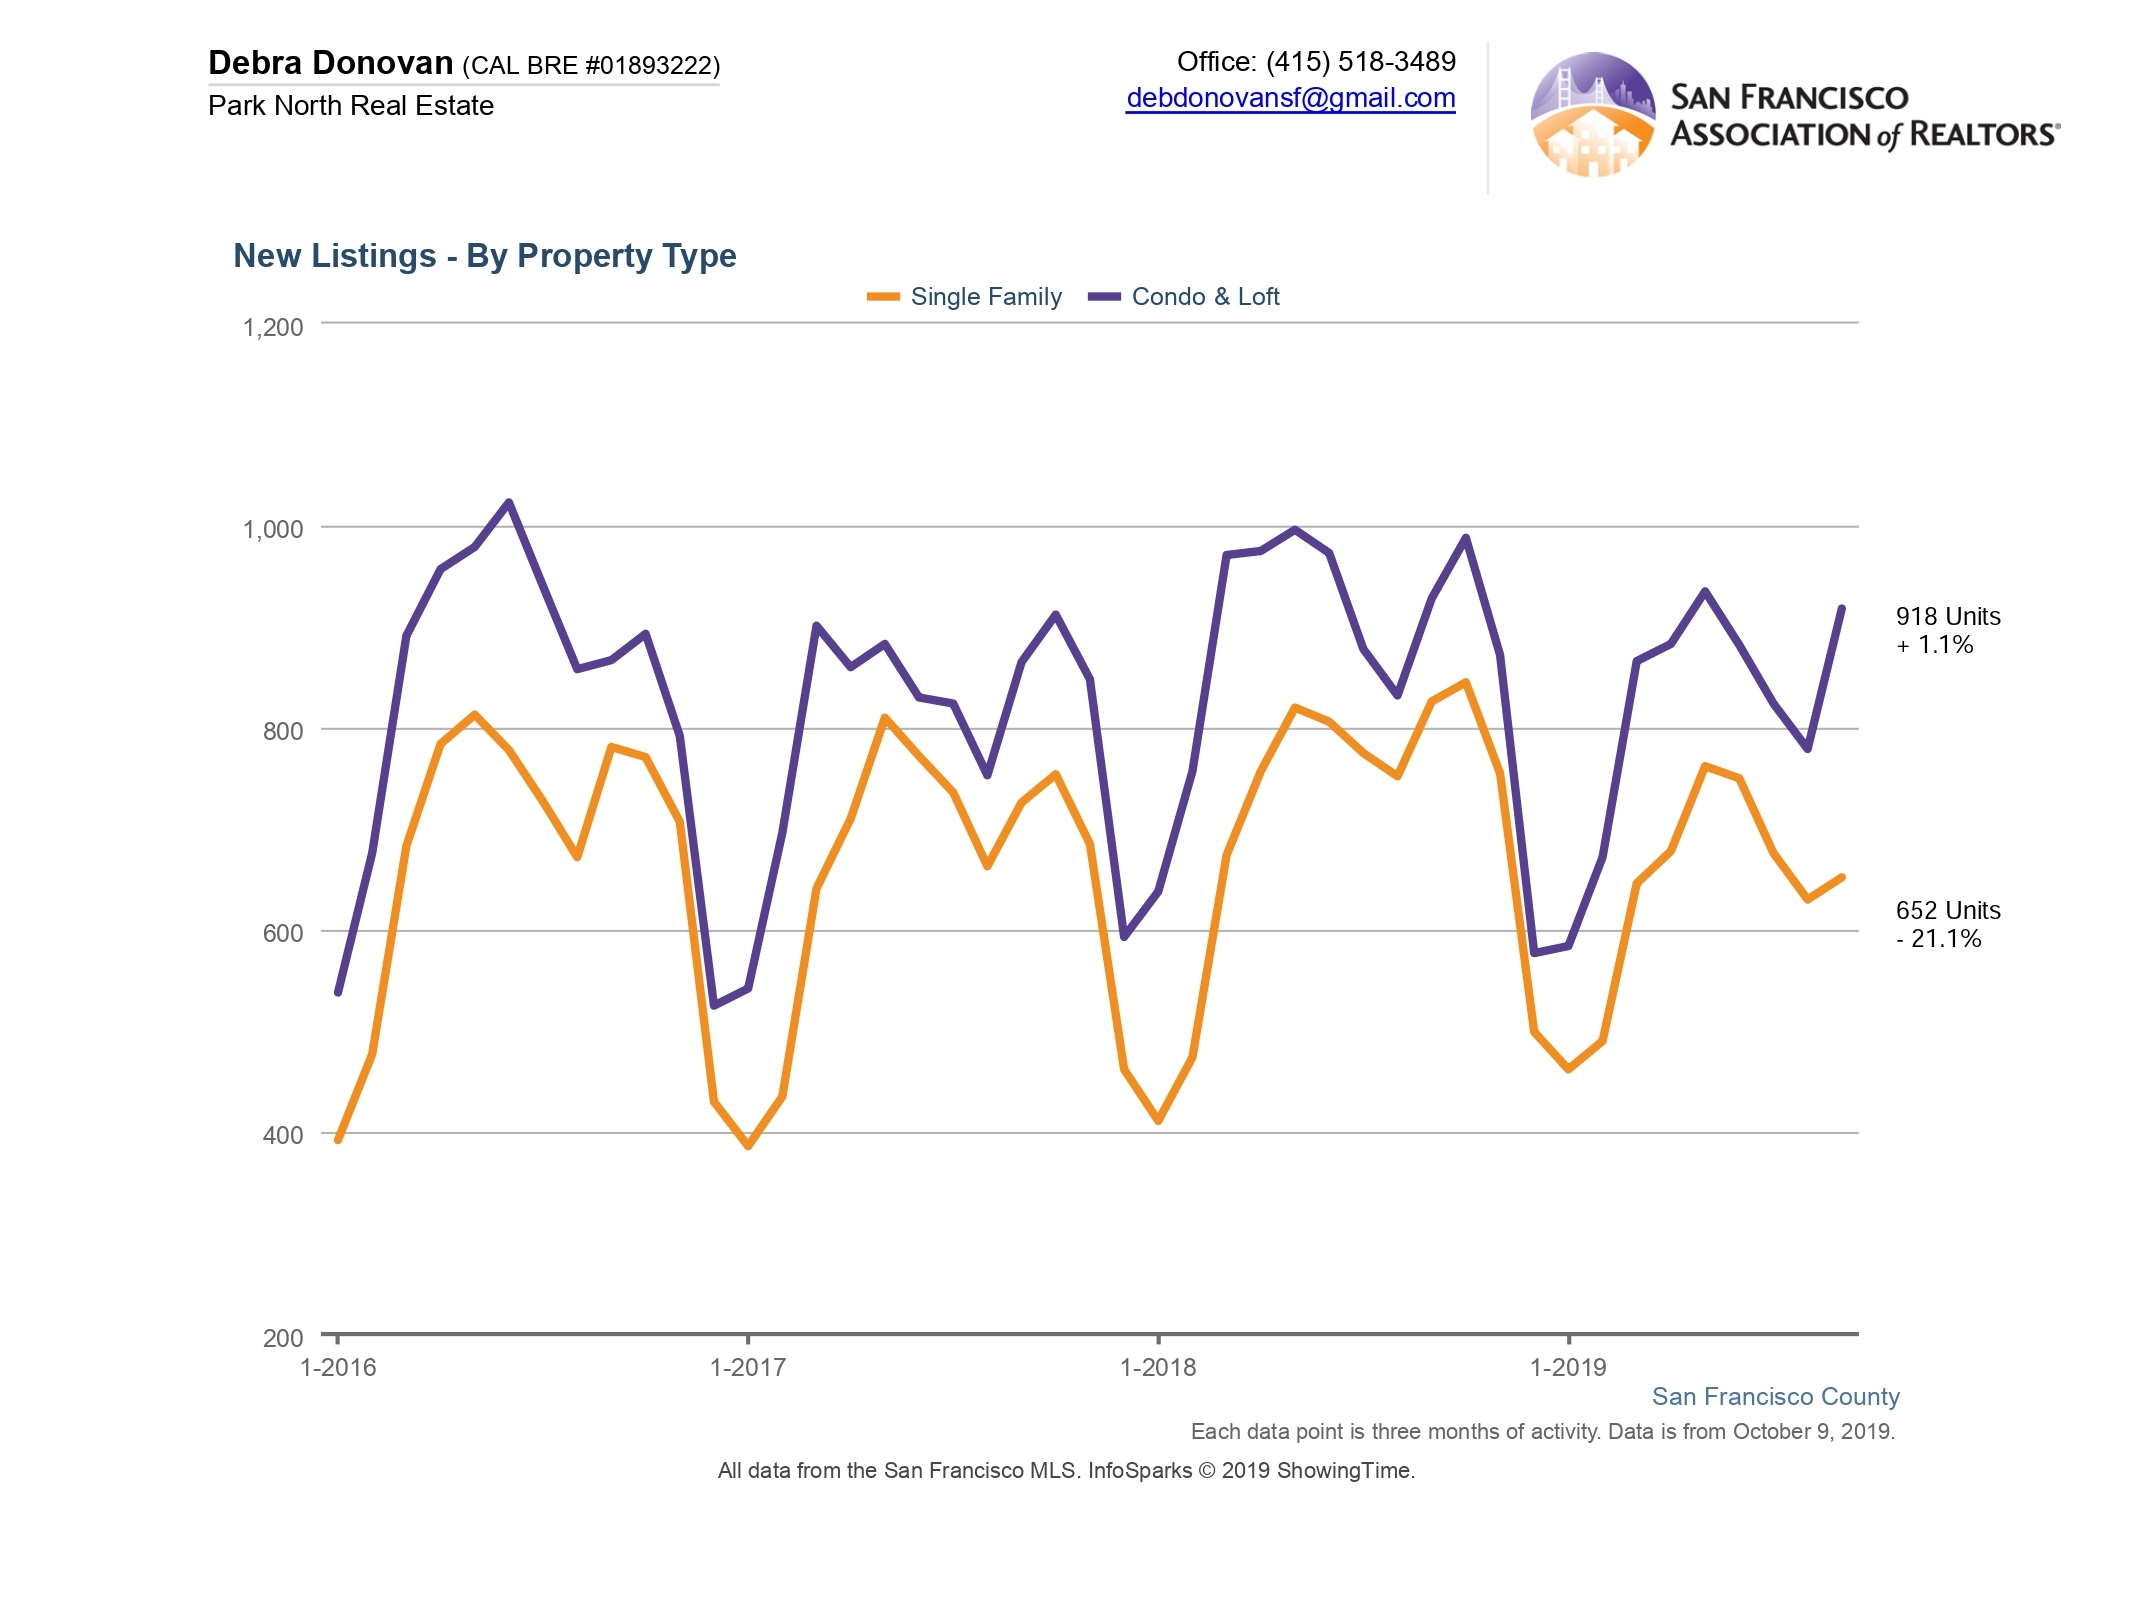
New Listings:
While September showed its usual post-Labor Day influx of inventory onto the market, new listings were still down overall compared to the same month last year. Single family homes showed the lesser of the new inventory (-25%). While new condos and lofts listings were also down compared to the previous year the delta was not as large (-4.4%).
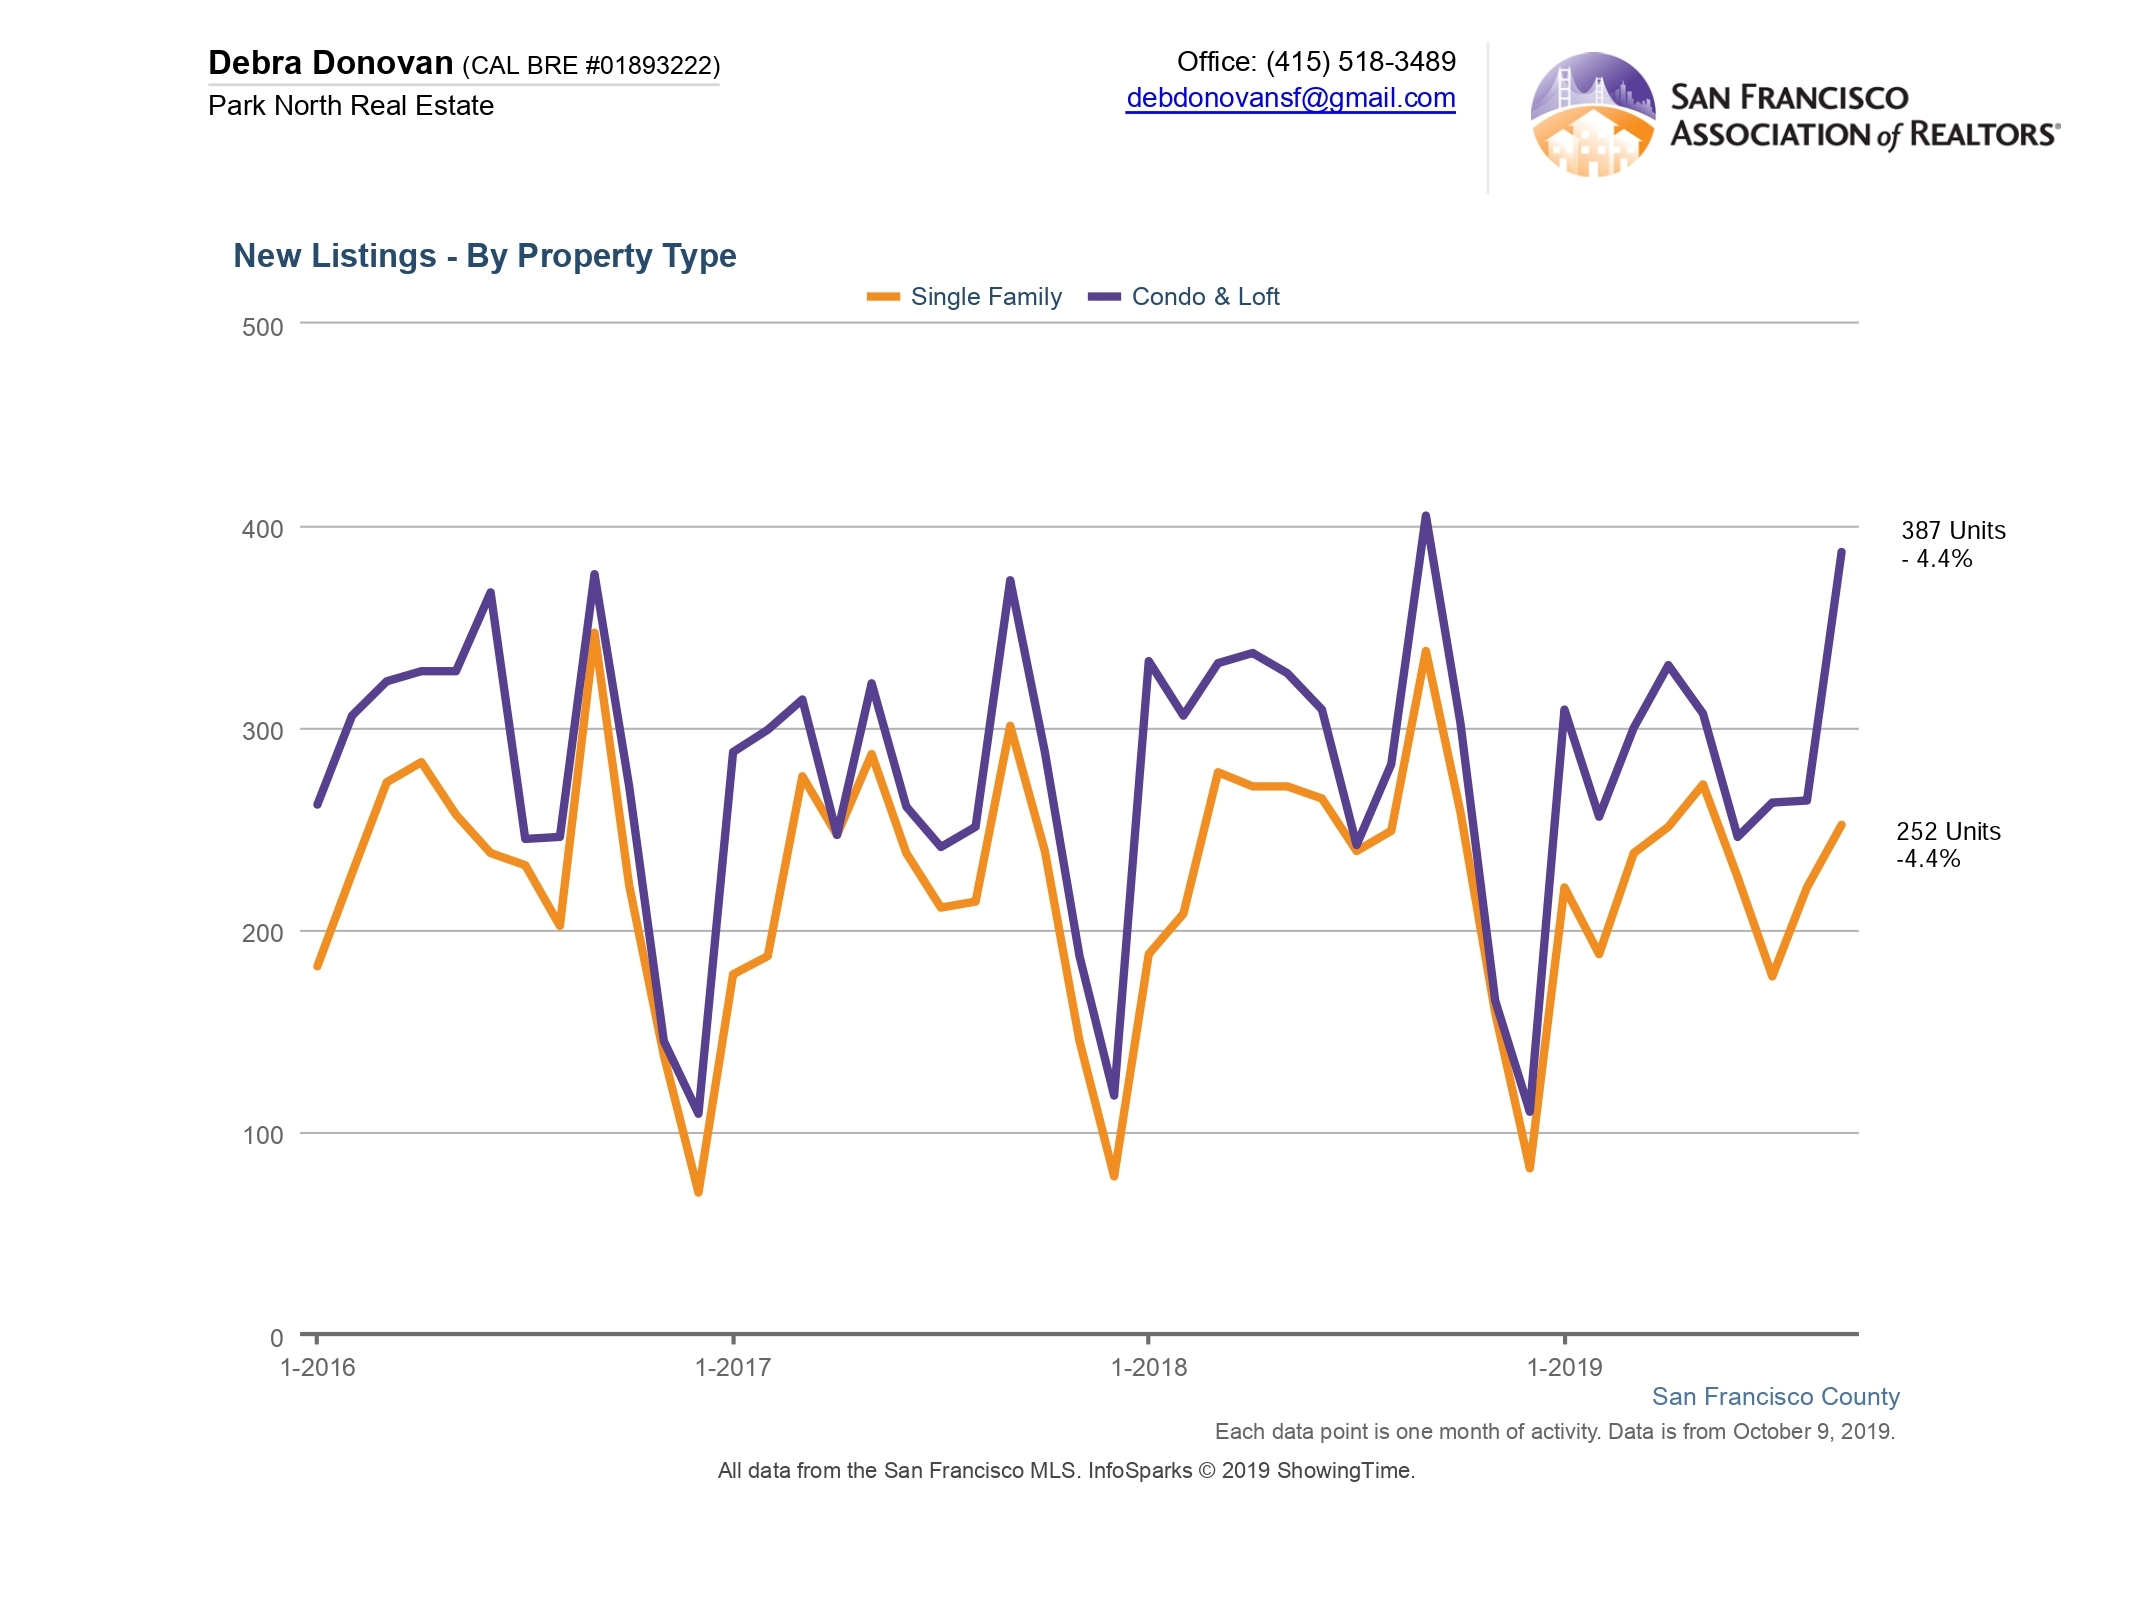
The 3rd quarter also showed fewer new listings compared to Q3 2018. New single family home listings were down 21%. New condo and loft listings were down 1.1% for the quarter. It’s also important to note that condo sales largely don’t include new construction units as they’re typically not posted on the MLS.
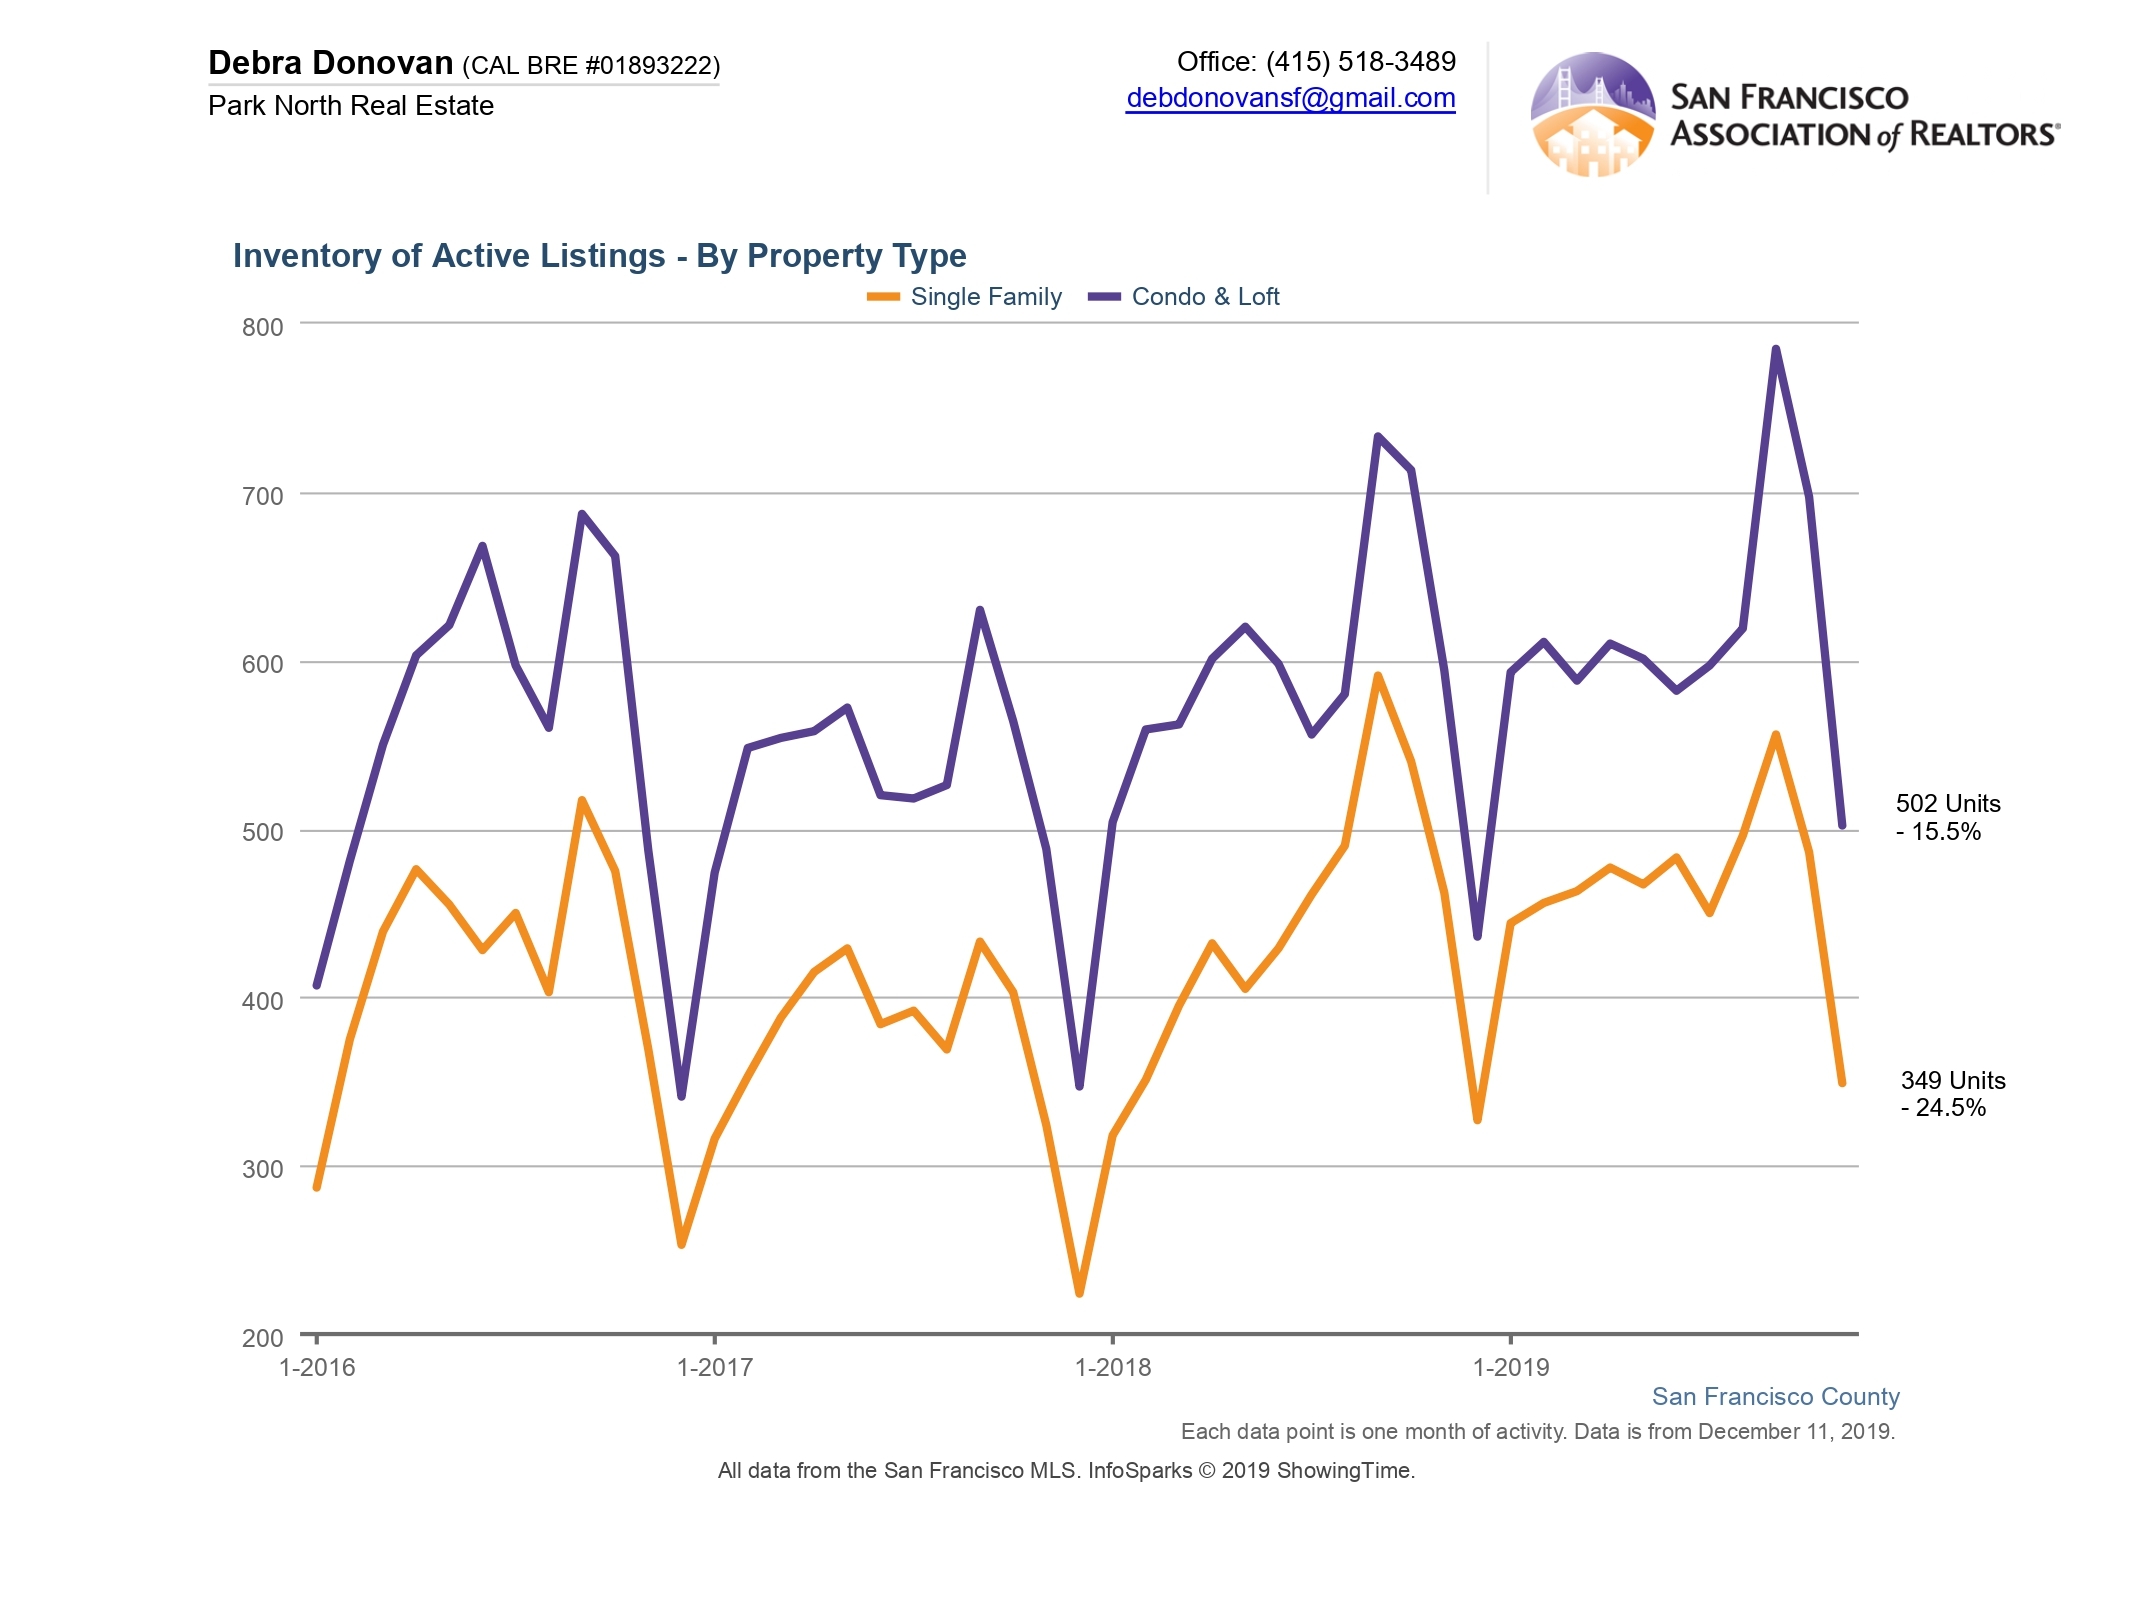
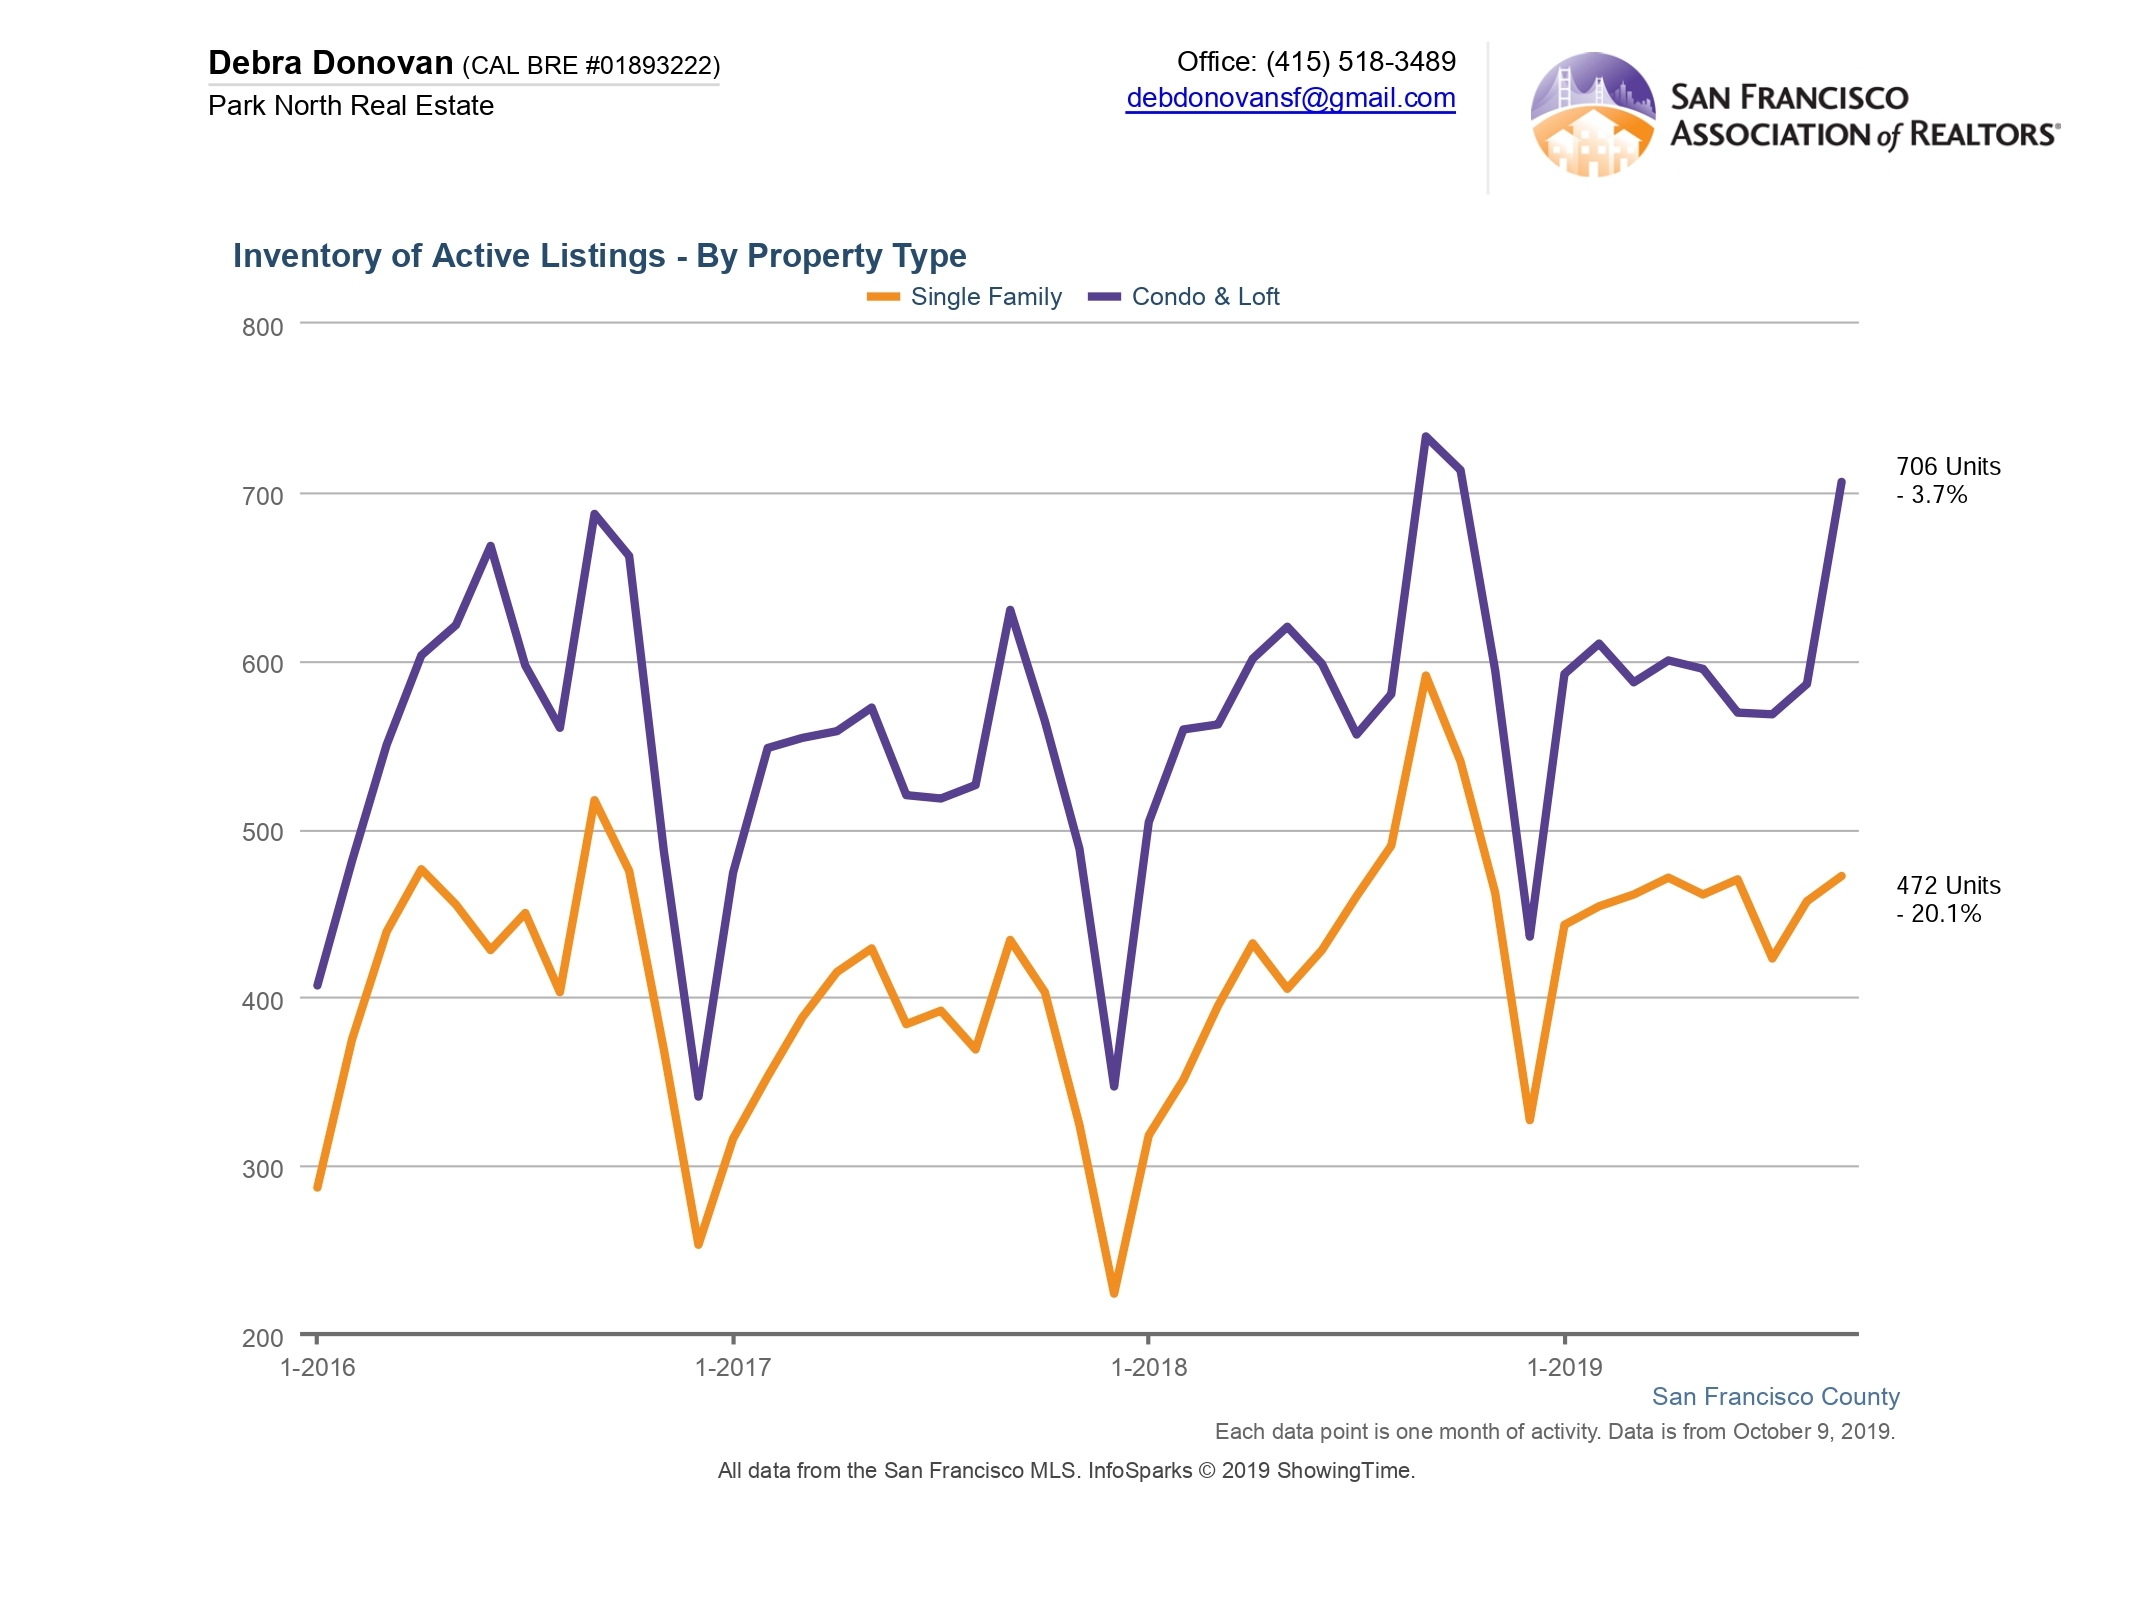
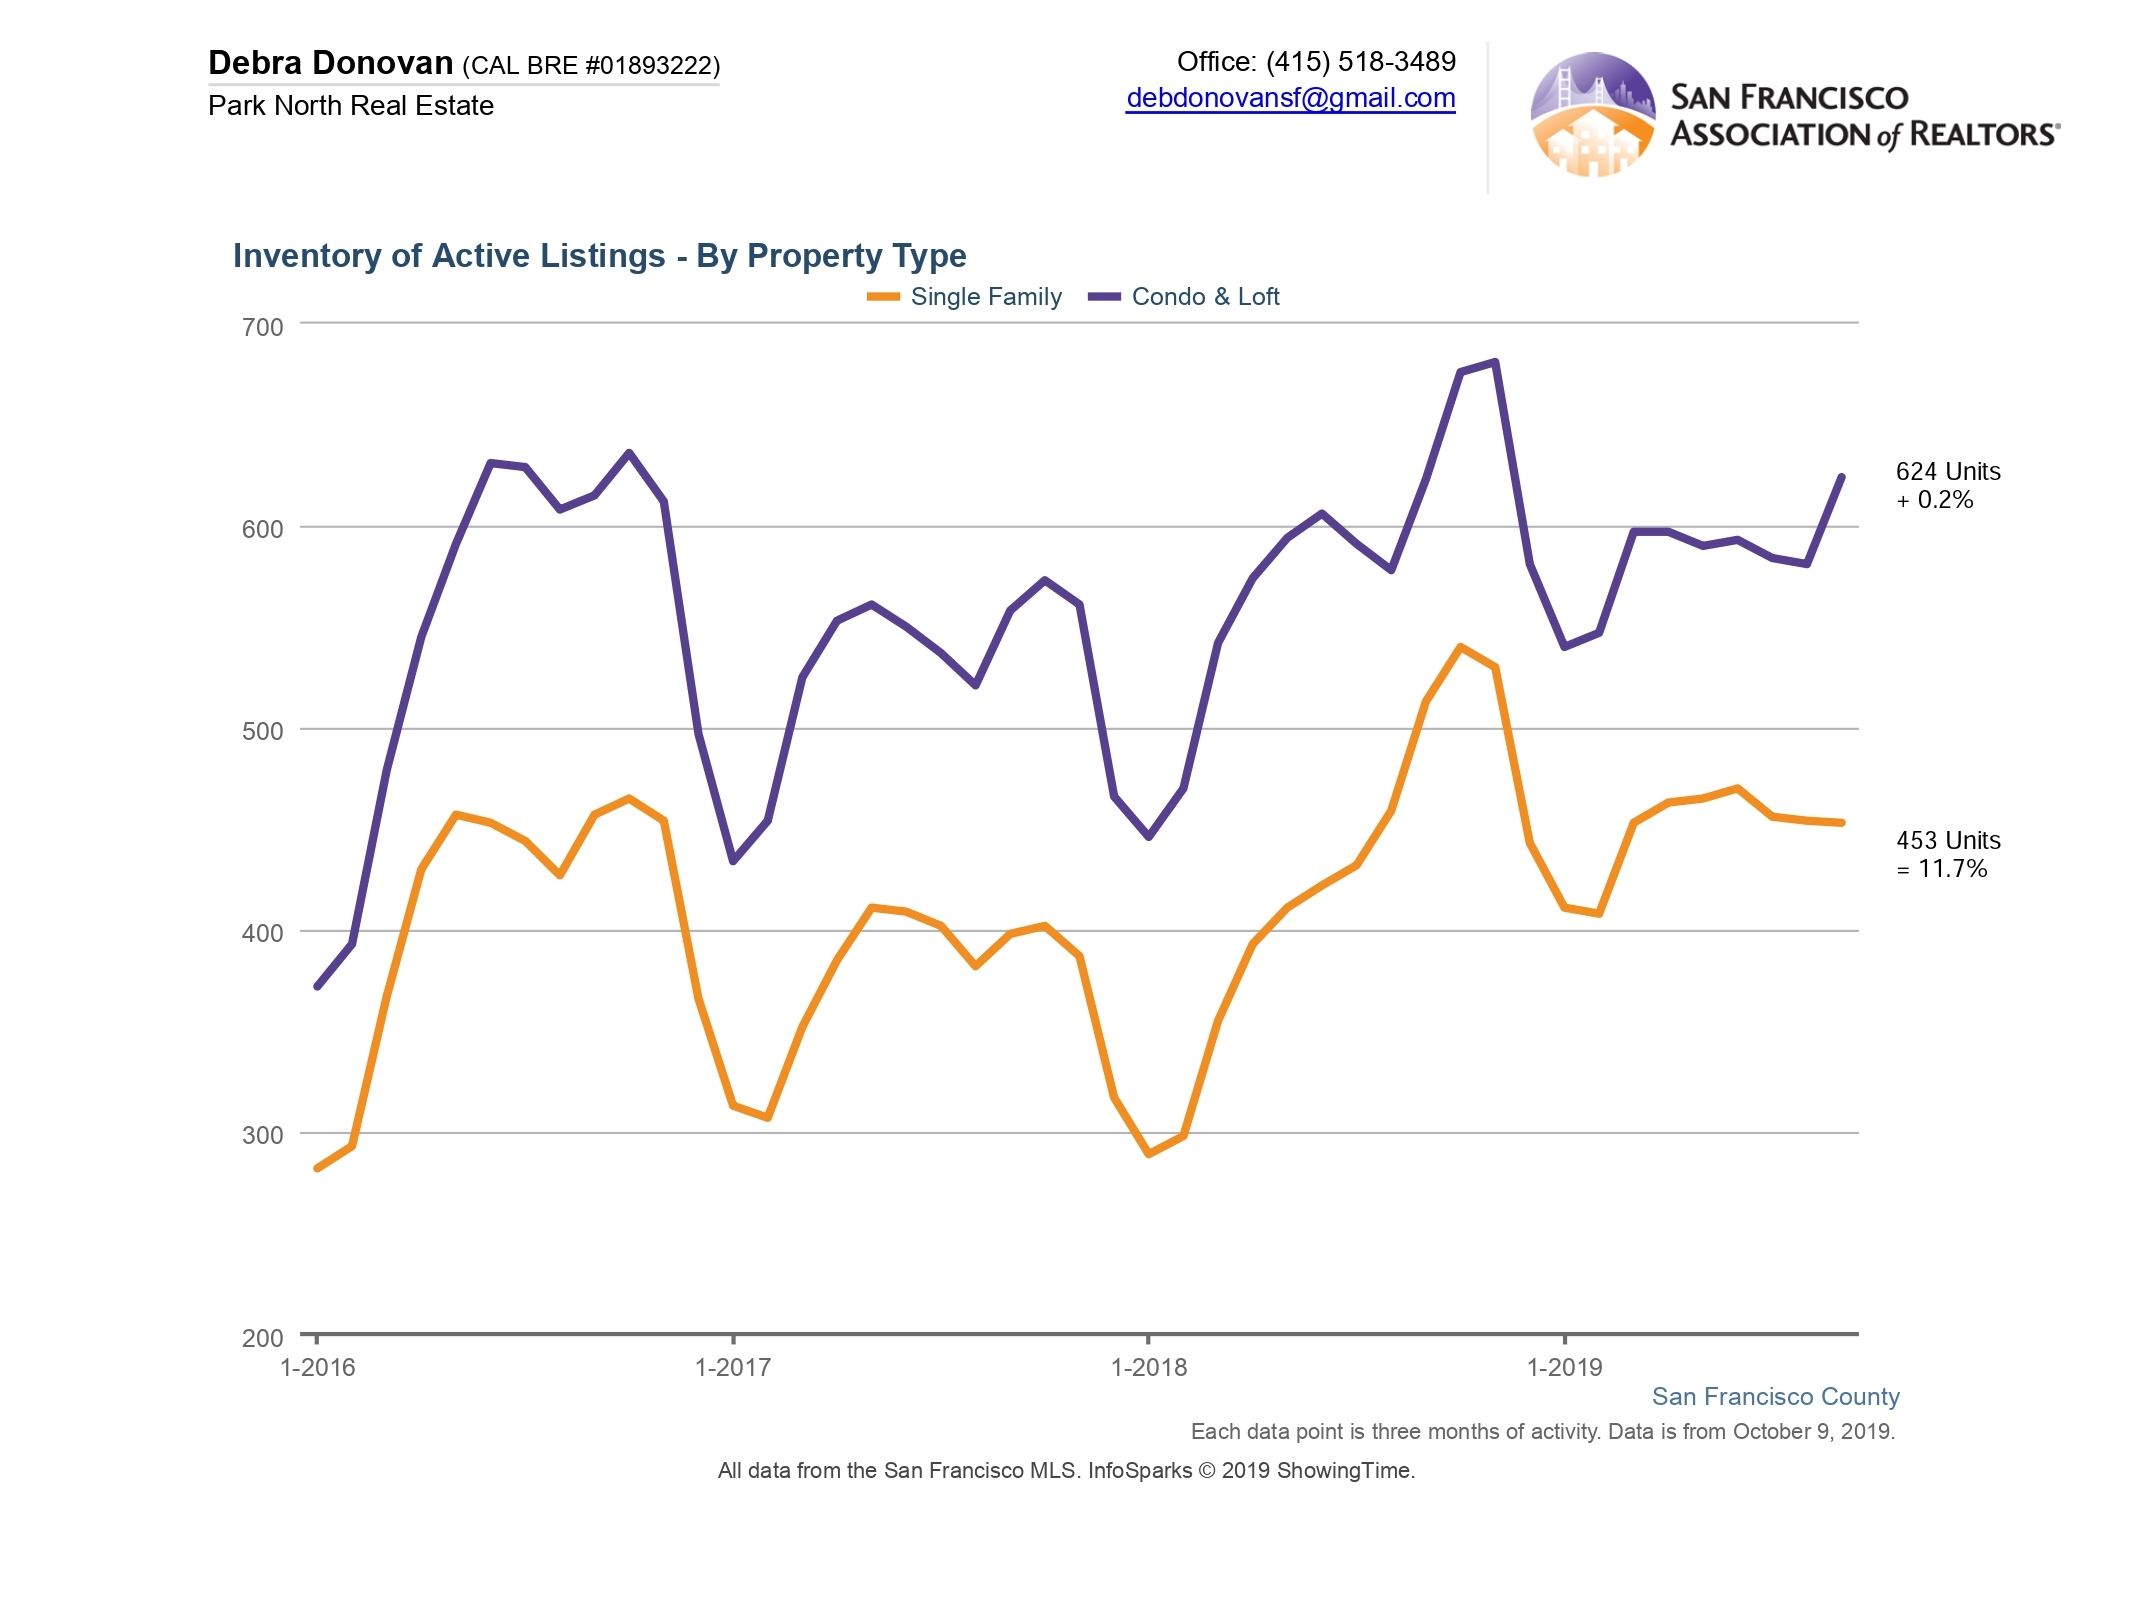
Active Listings:
Active listings are the number of properties still available for sale at the end of a given month. For the quarter it’s the average of the 3 months. In September active listings were down for single familty homes by about 20% compared to the same month a year ago. Condo and loft active listings were down almost 4%.This would seem to indicate that homes are still selling relatively quickly.
Active listings for the quarter for single family homes were also down almost 12% for the quarter compared to Q3 2018. Condos and lofts on the other hand were up just slightly 0.2%, so pretty much the same as Q3 last year.
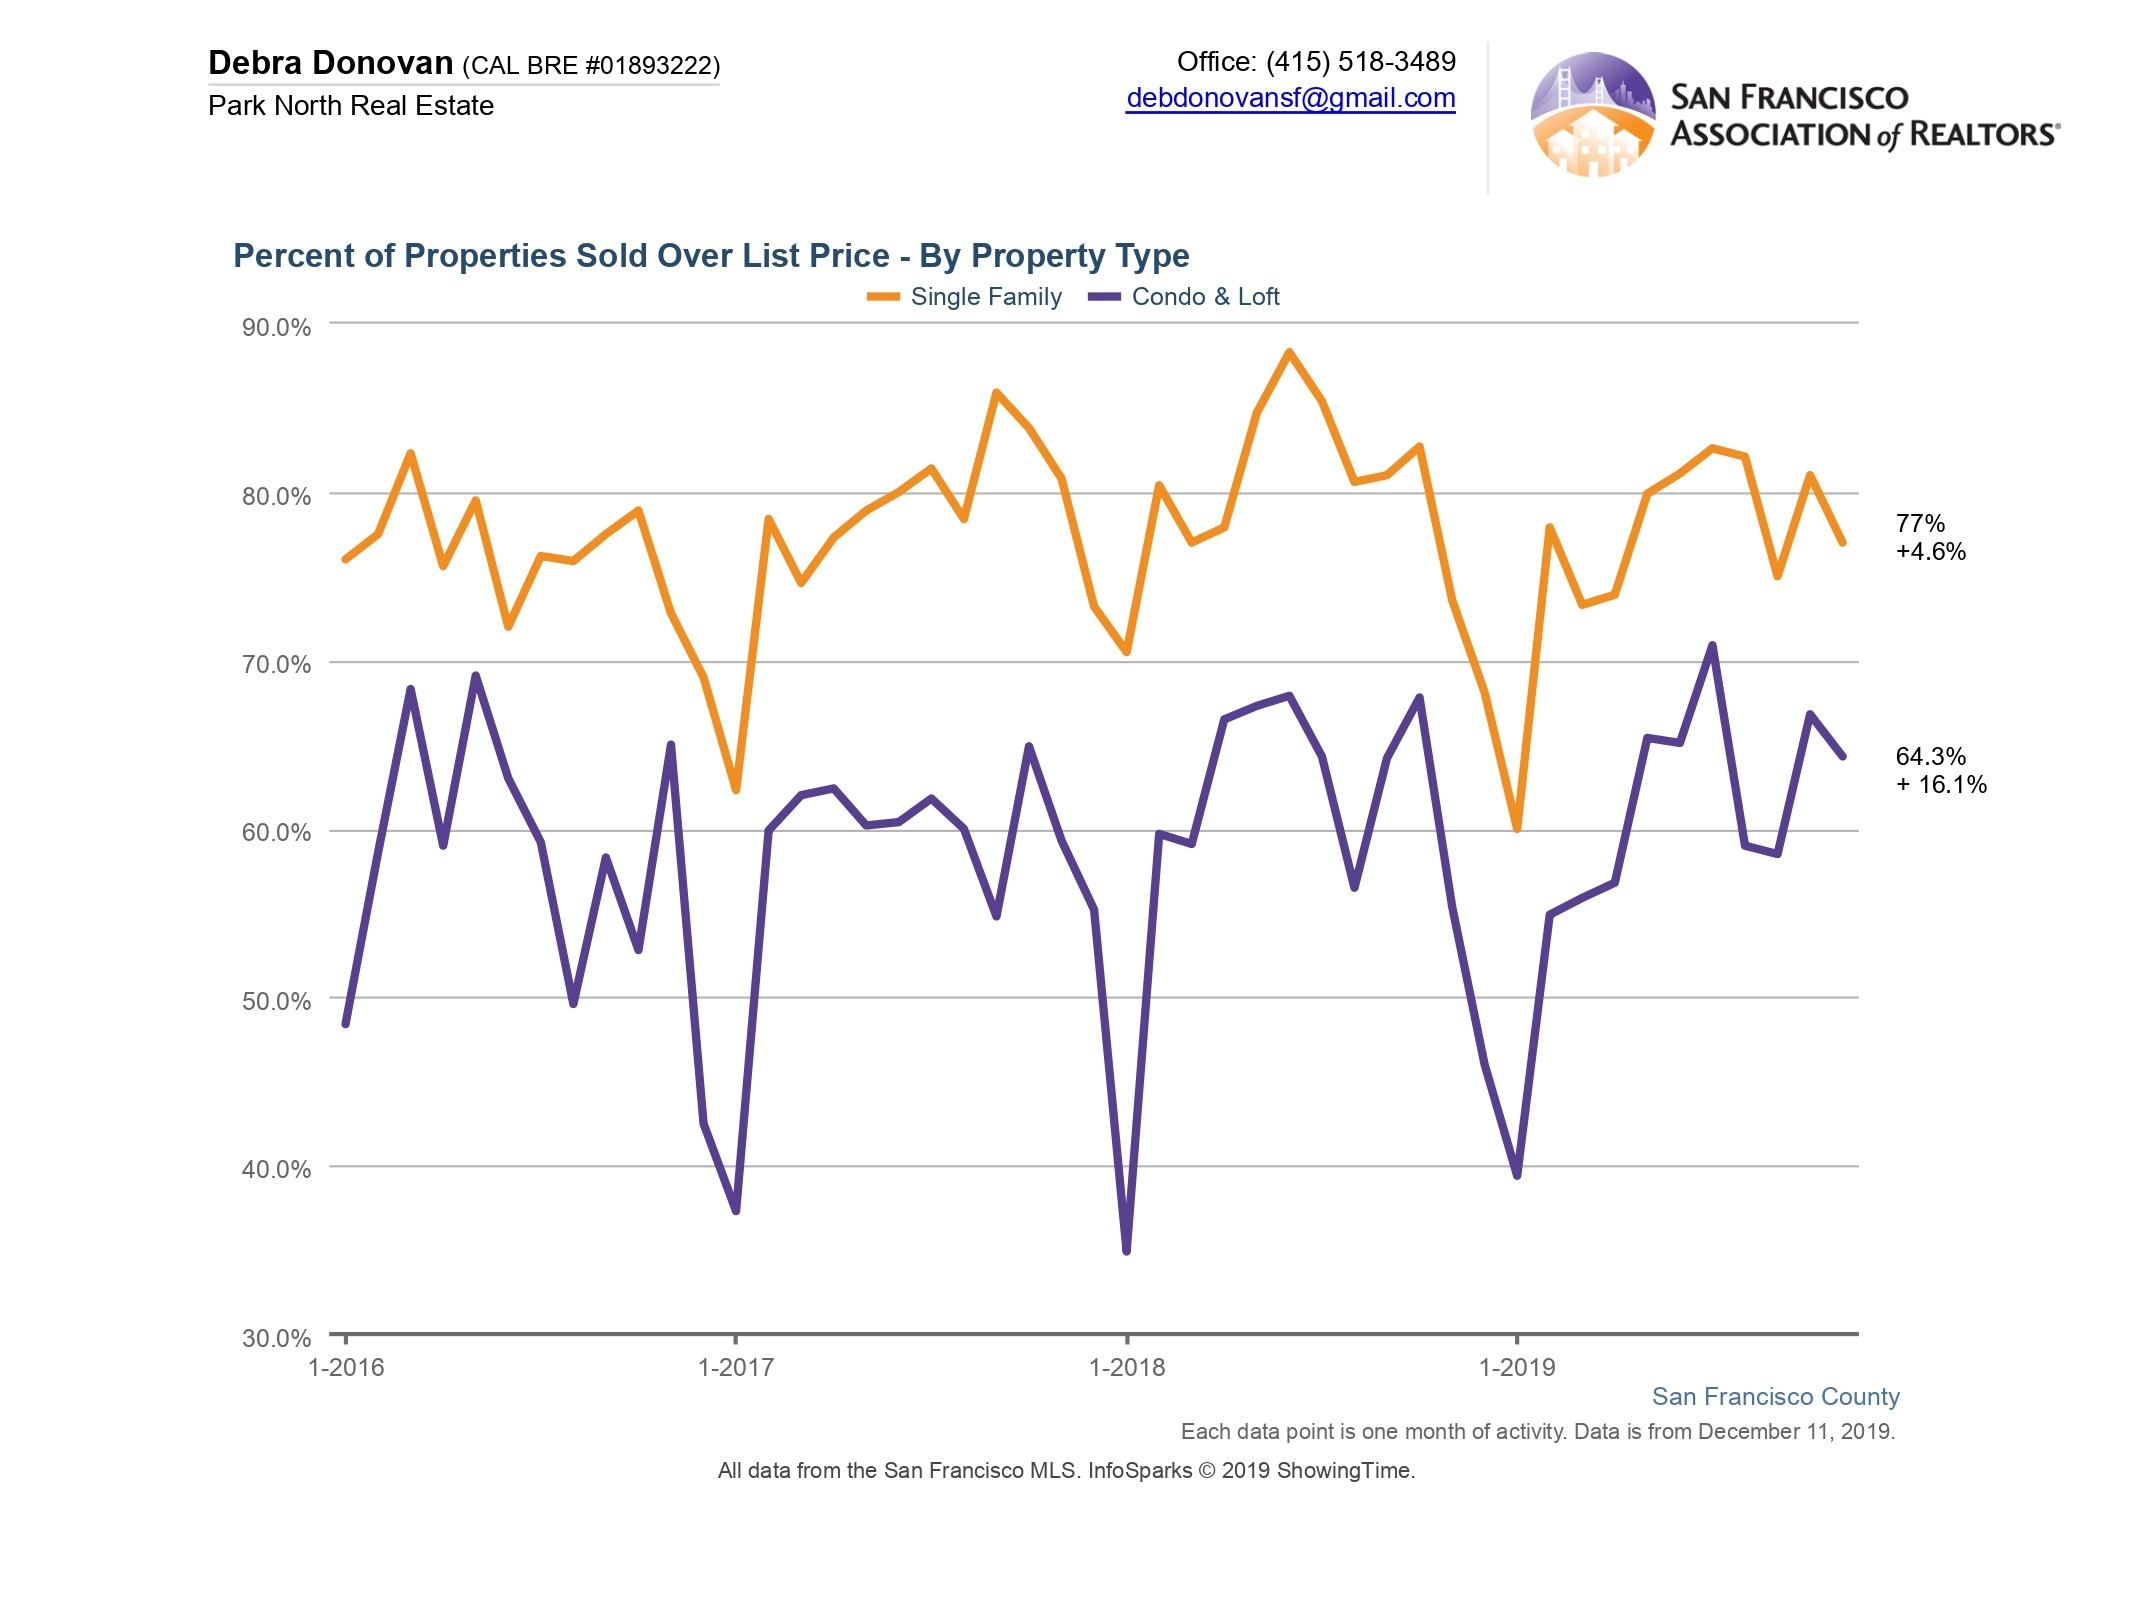
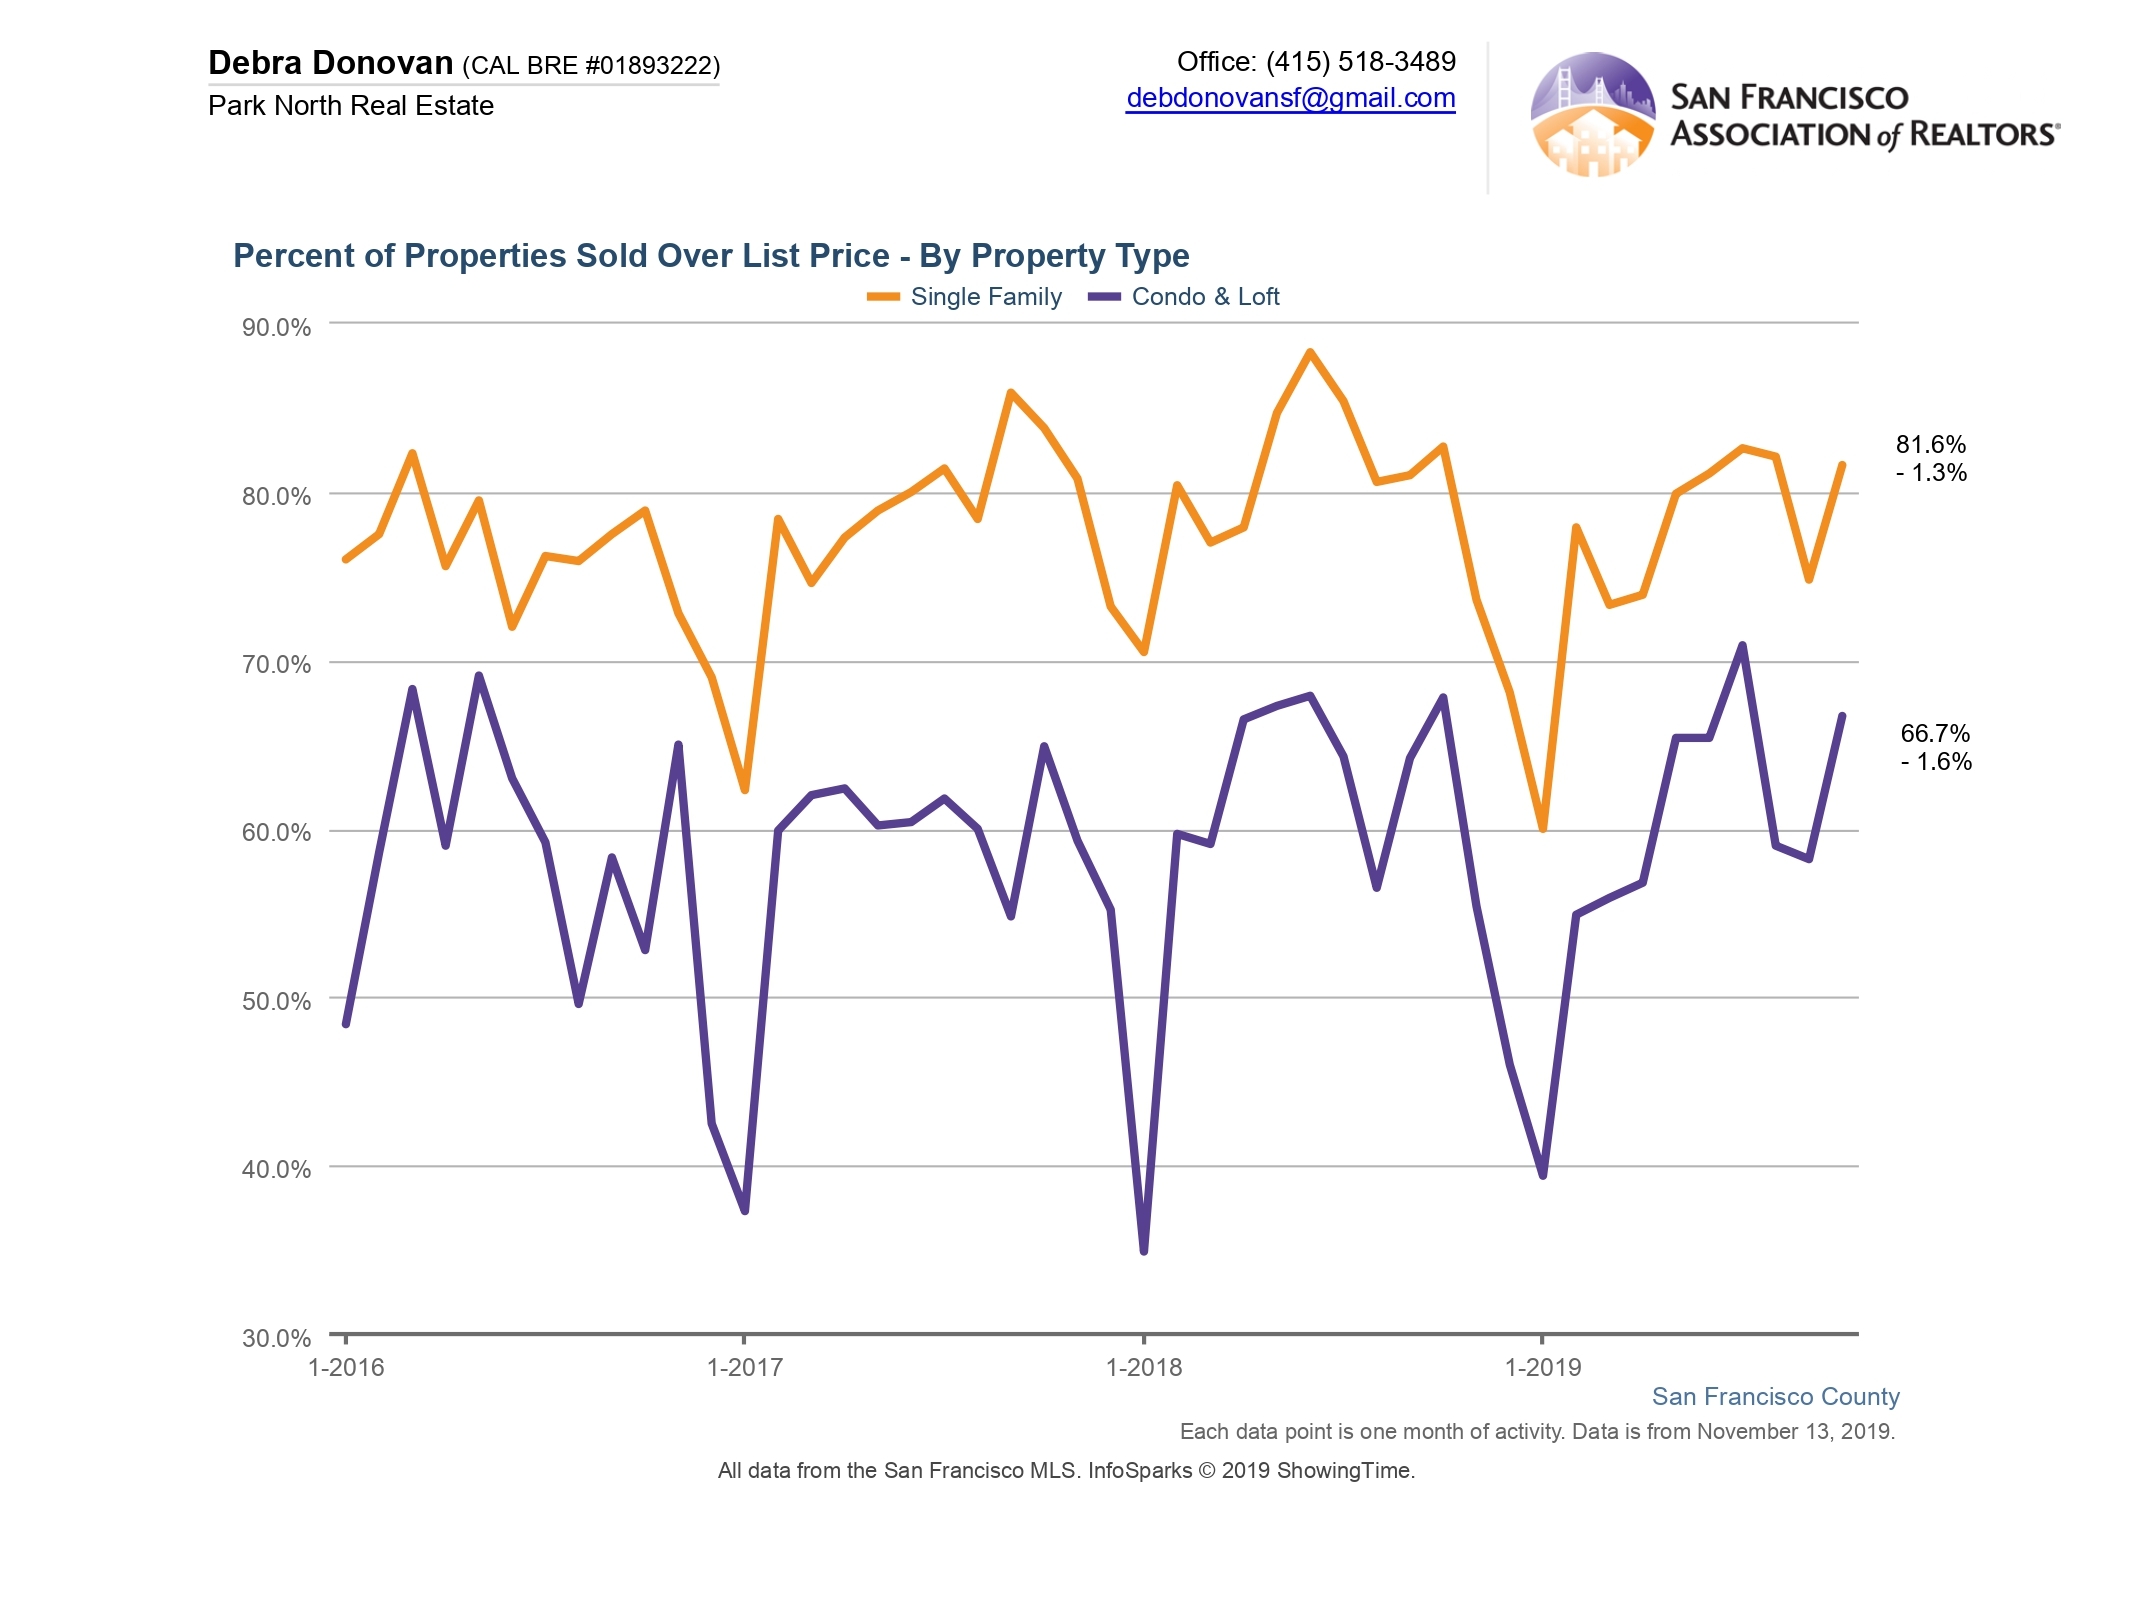
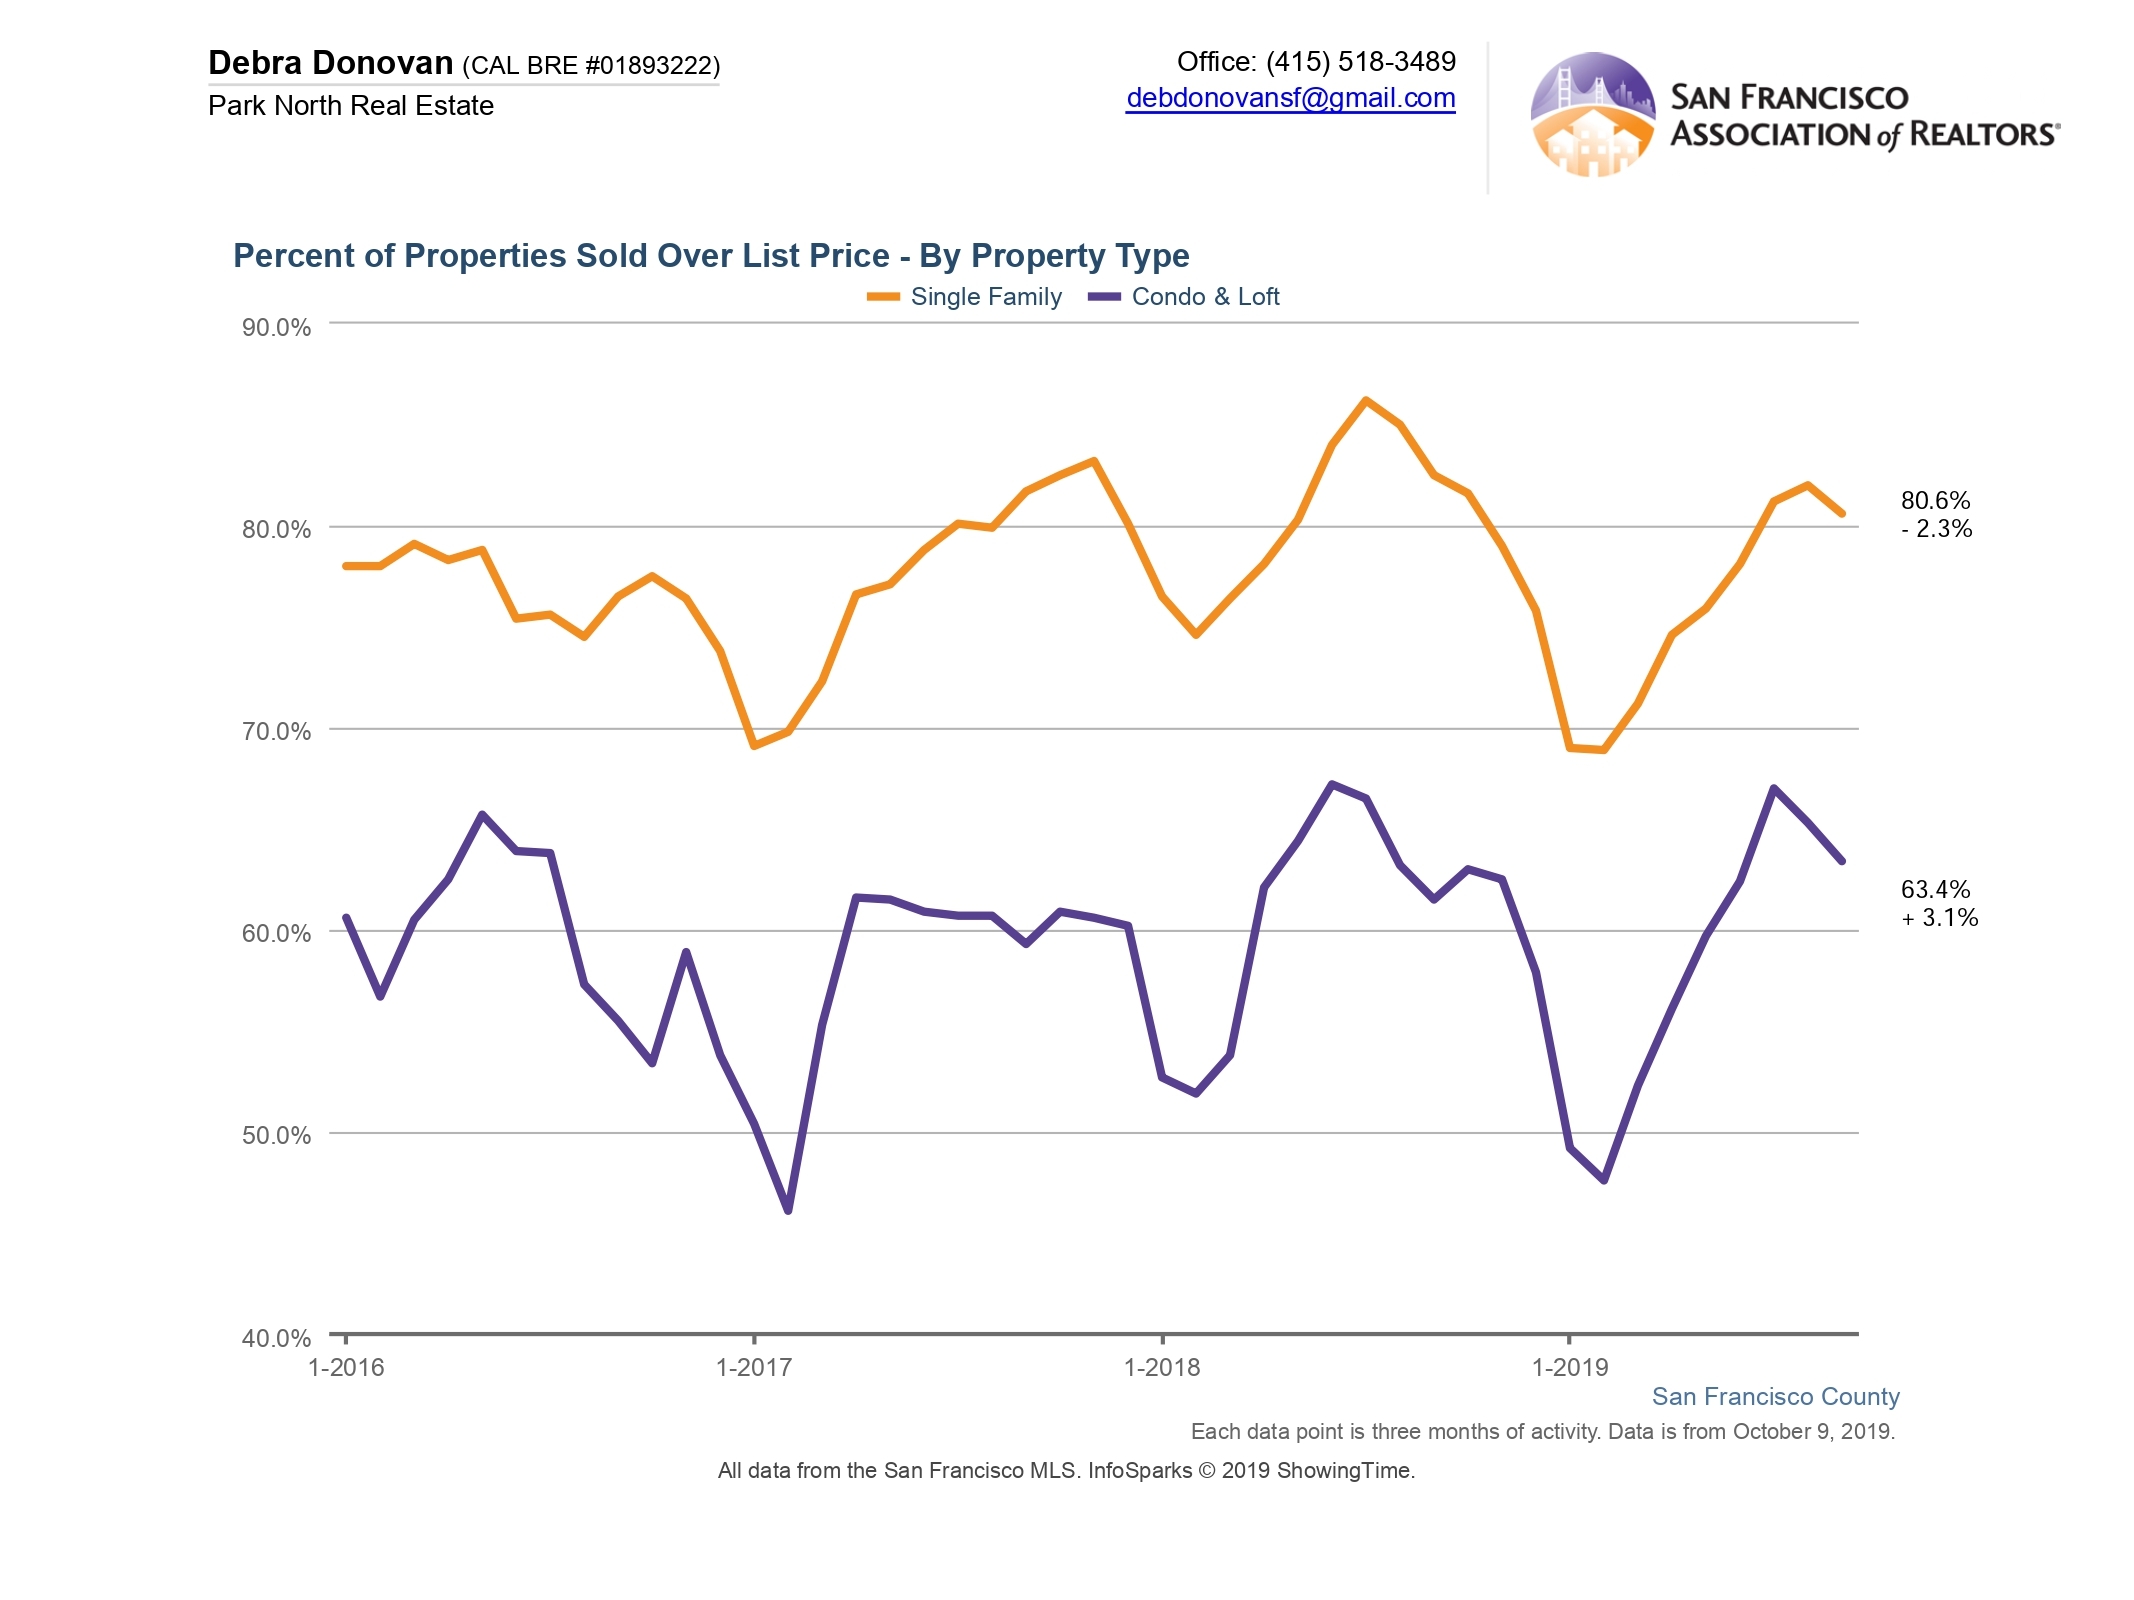
Percentage of Properties Sold Over List Price:
Almost 75% of single family homes sold for over their list price in September, down almost 8% compared to the previous year. 59% of condos and lofts were purchased over their asking price, down over 8% compared to the same month last year. It appears buyers are pushing back a bit of late, unwilling to overbid like crazy for homes.
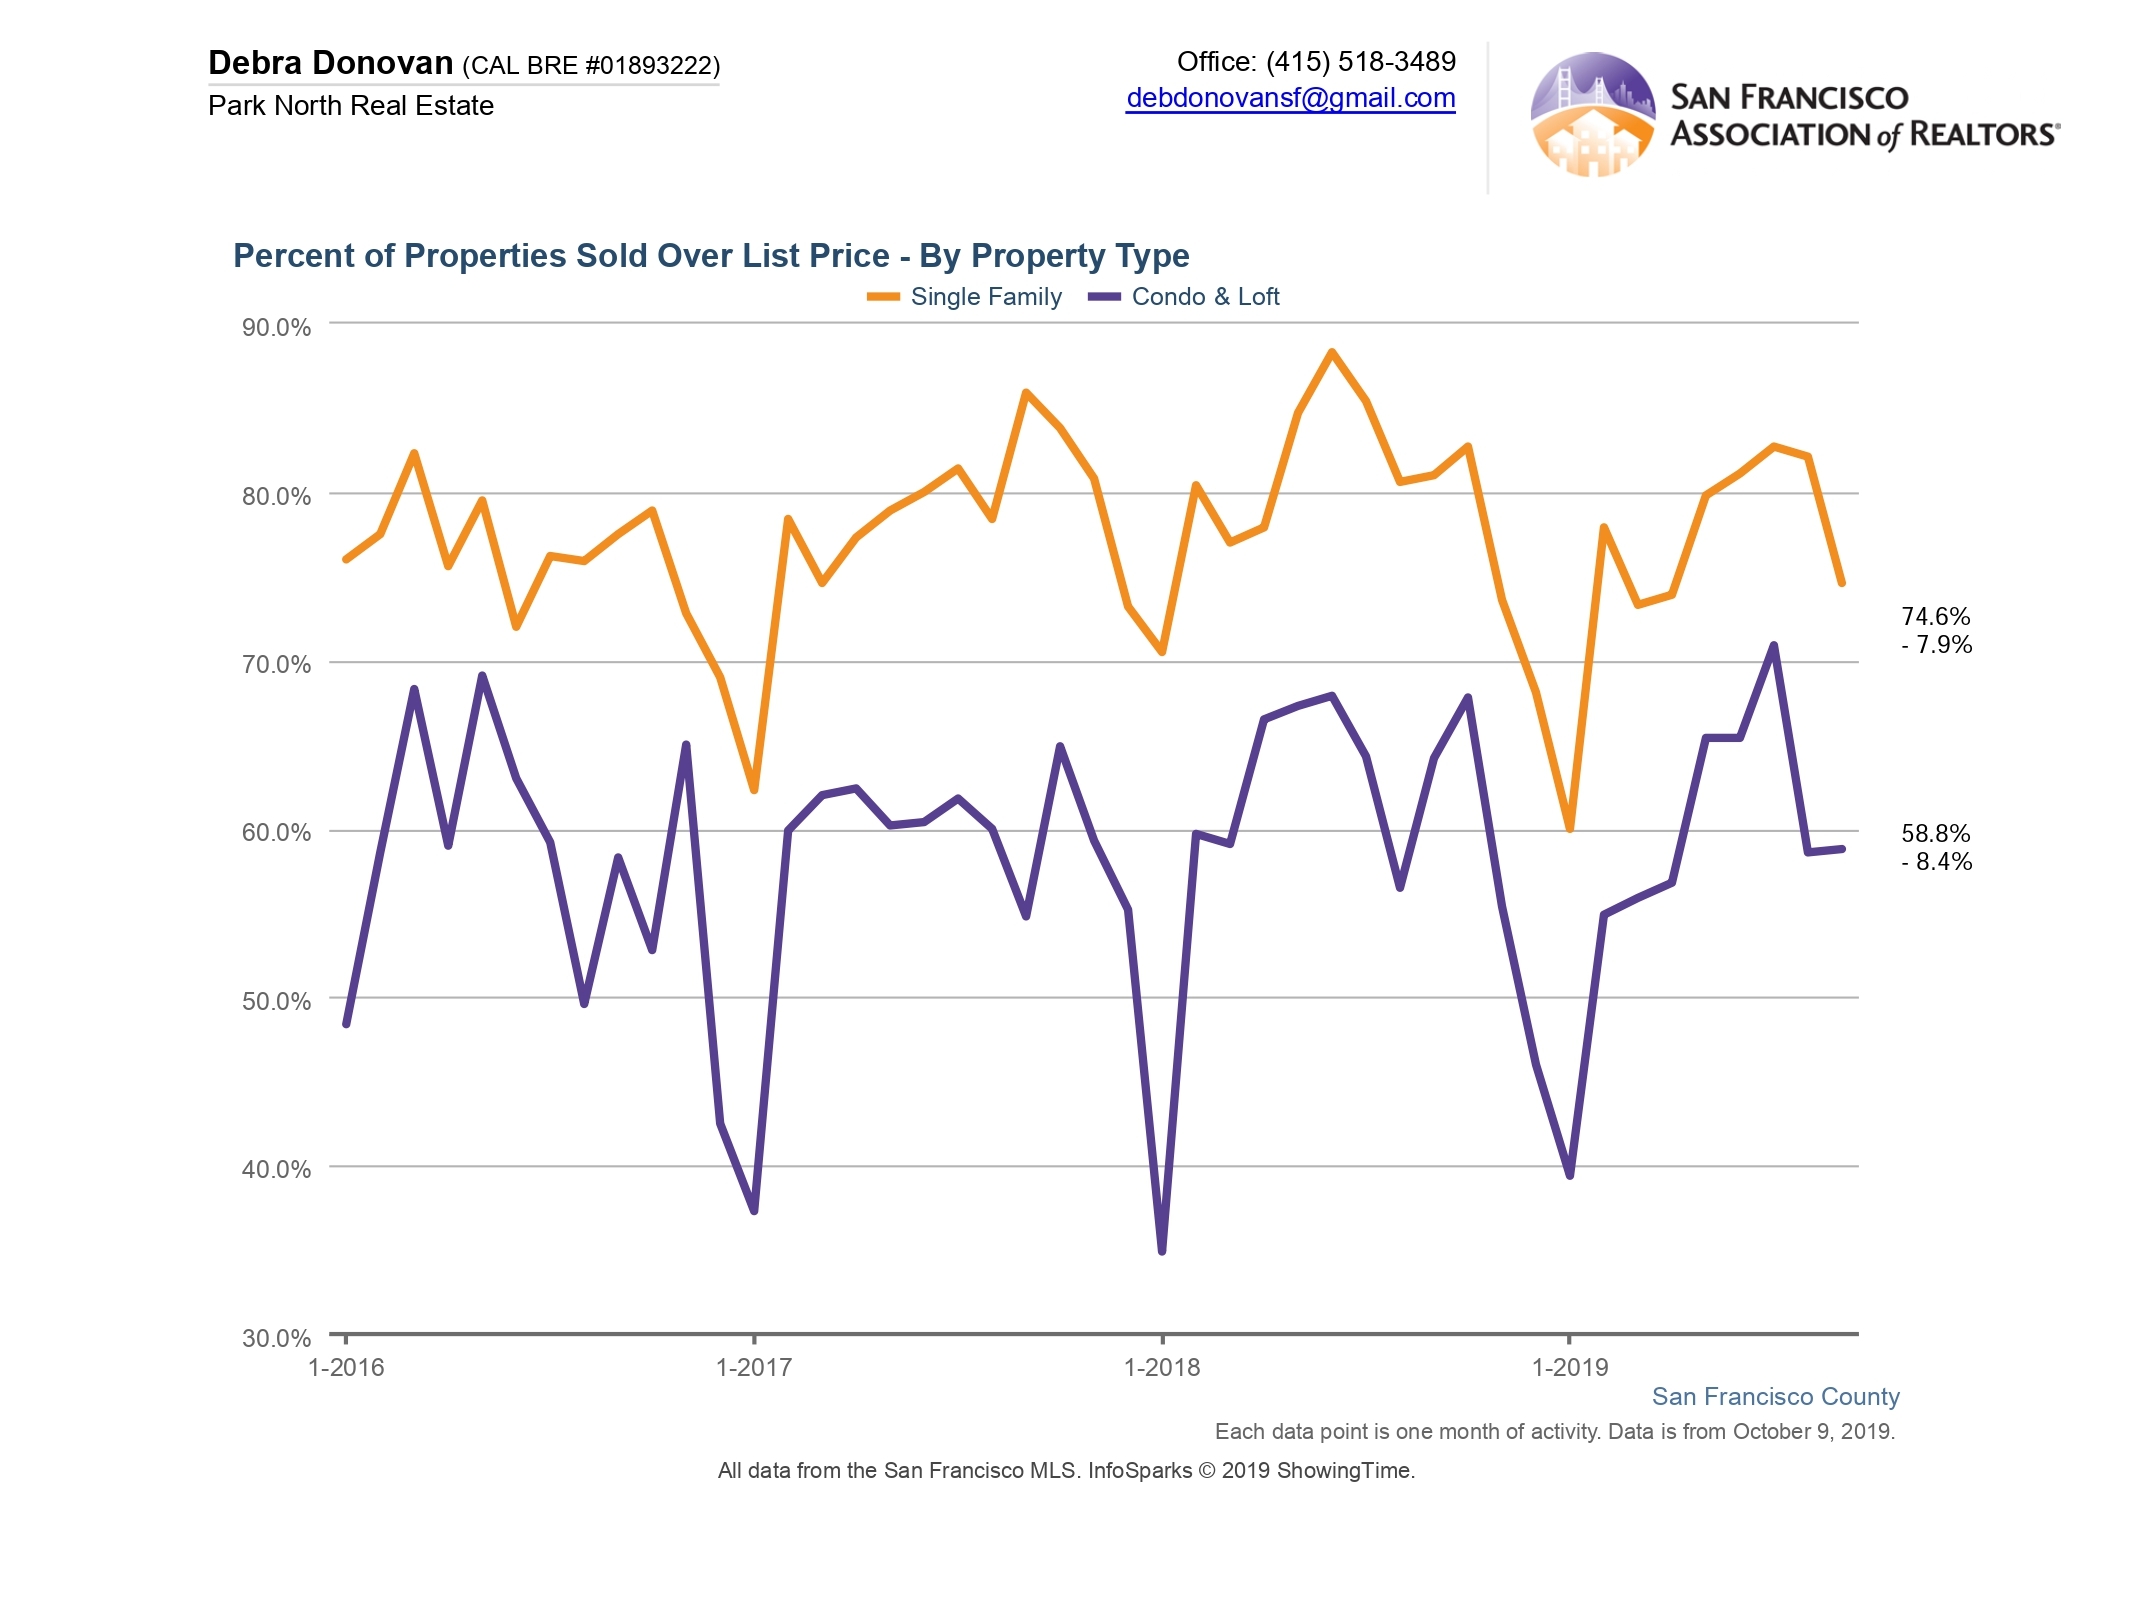
On average, sellers of condos and lofts did slightly better in Q3 than last year, with 63% selling over list price, an uptick of 3% compared to the previous September. Single family home sellers did well with over 80% selling over the asking price, but this was down a smidge from the previous quarter.
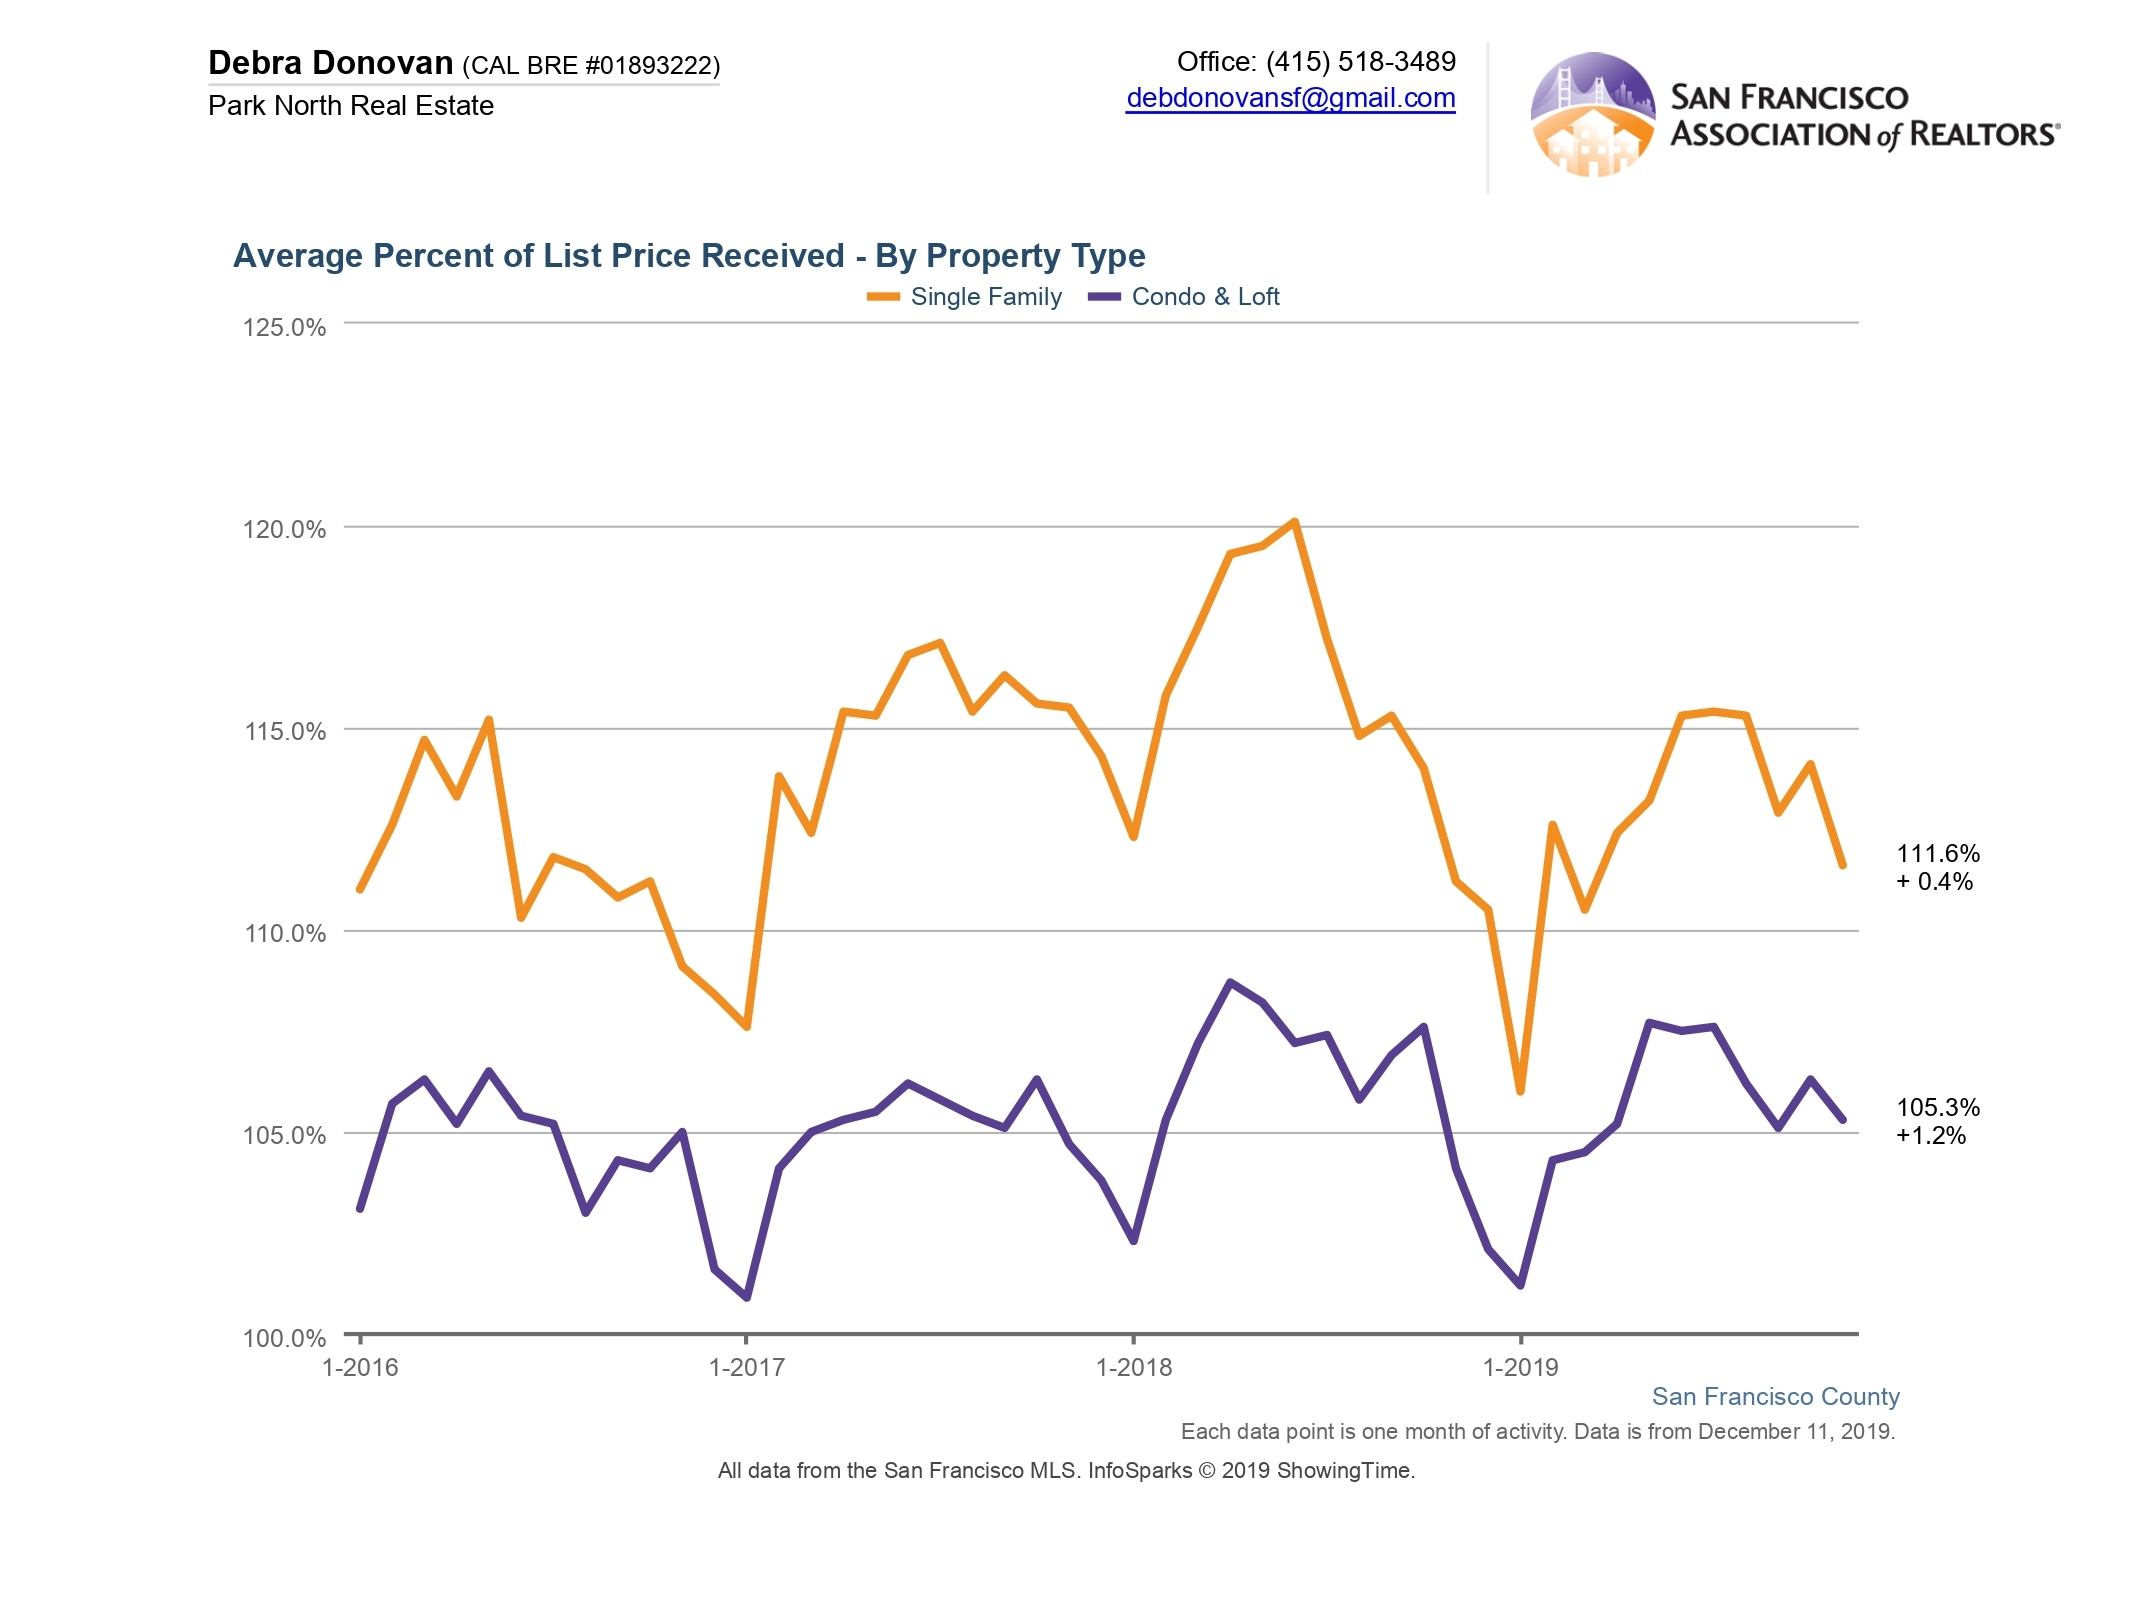
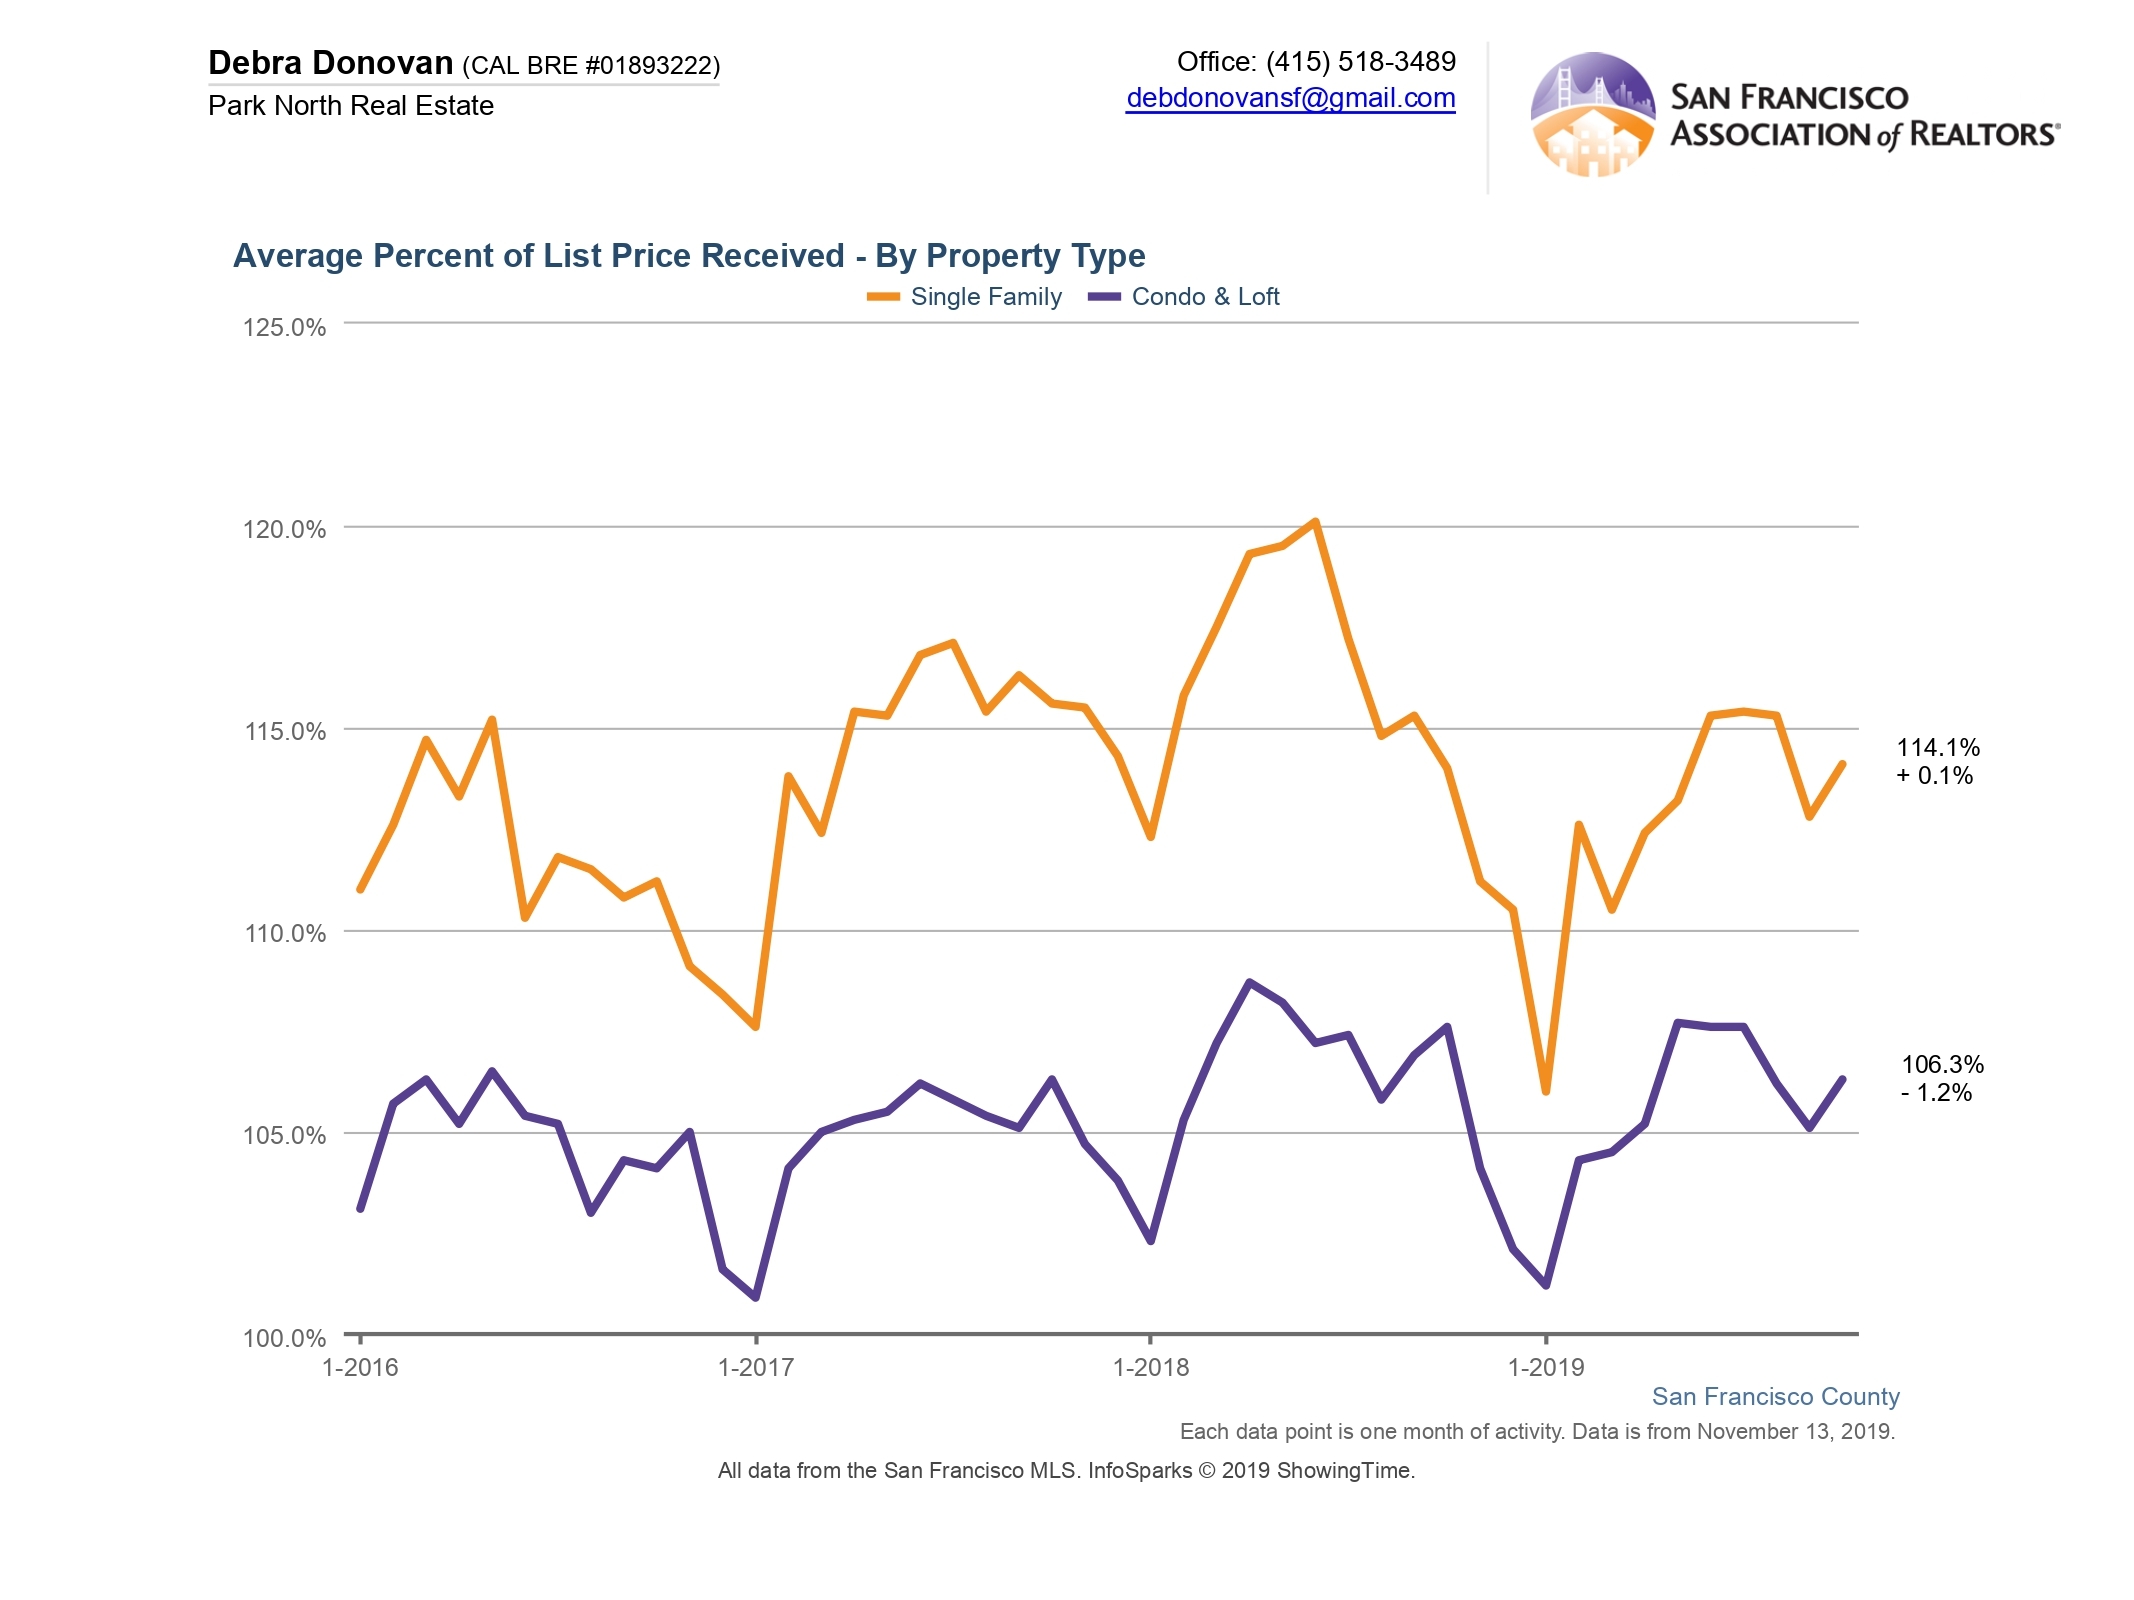
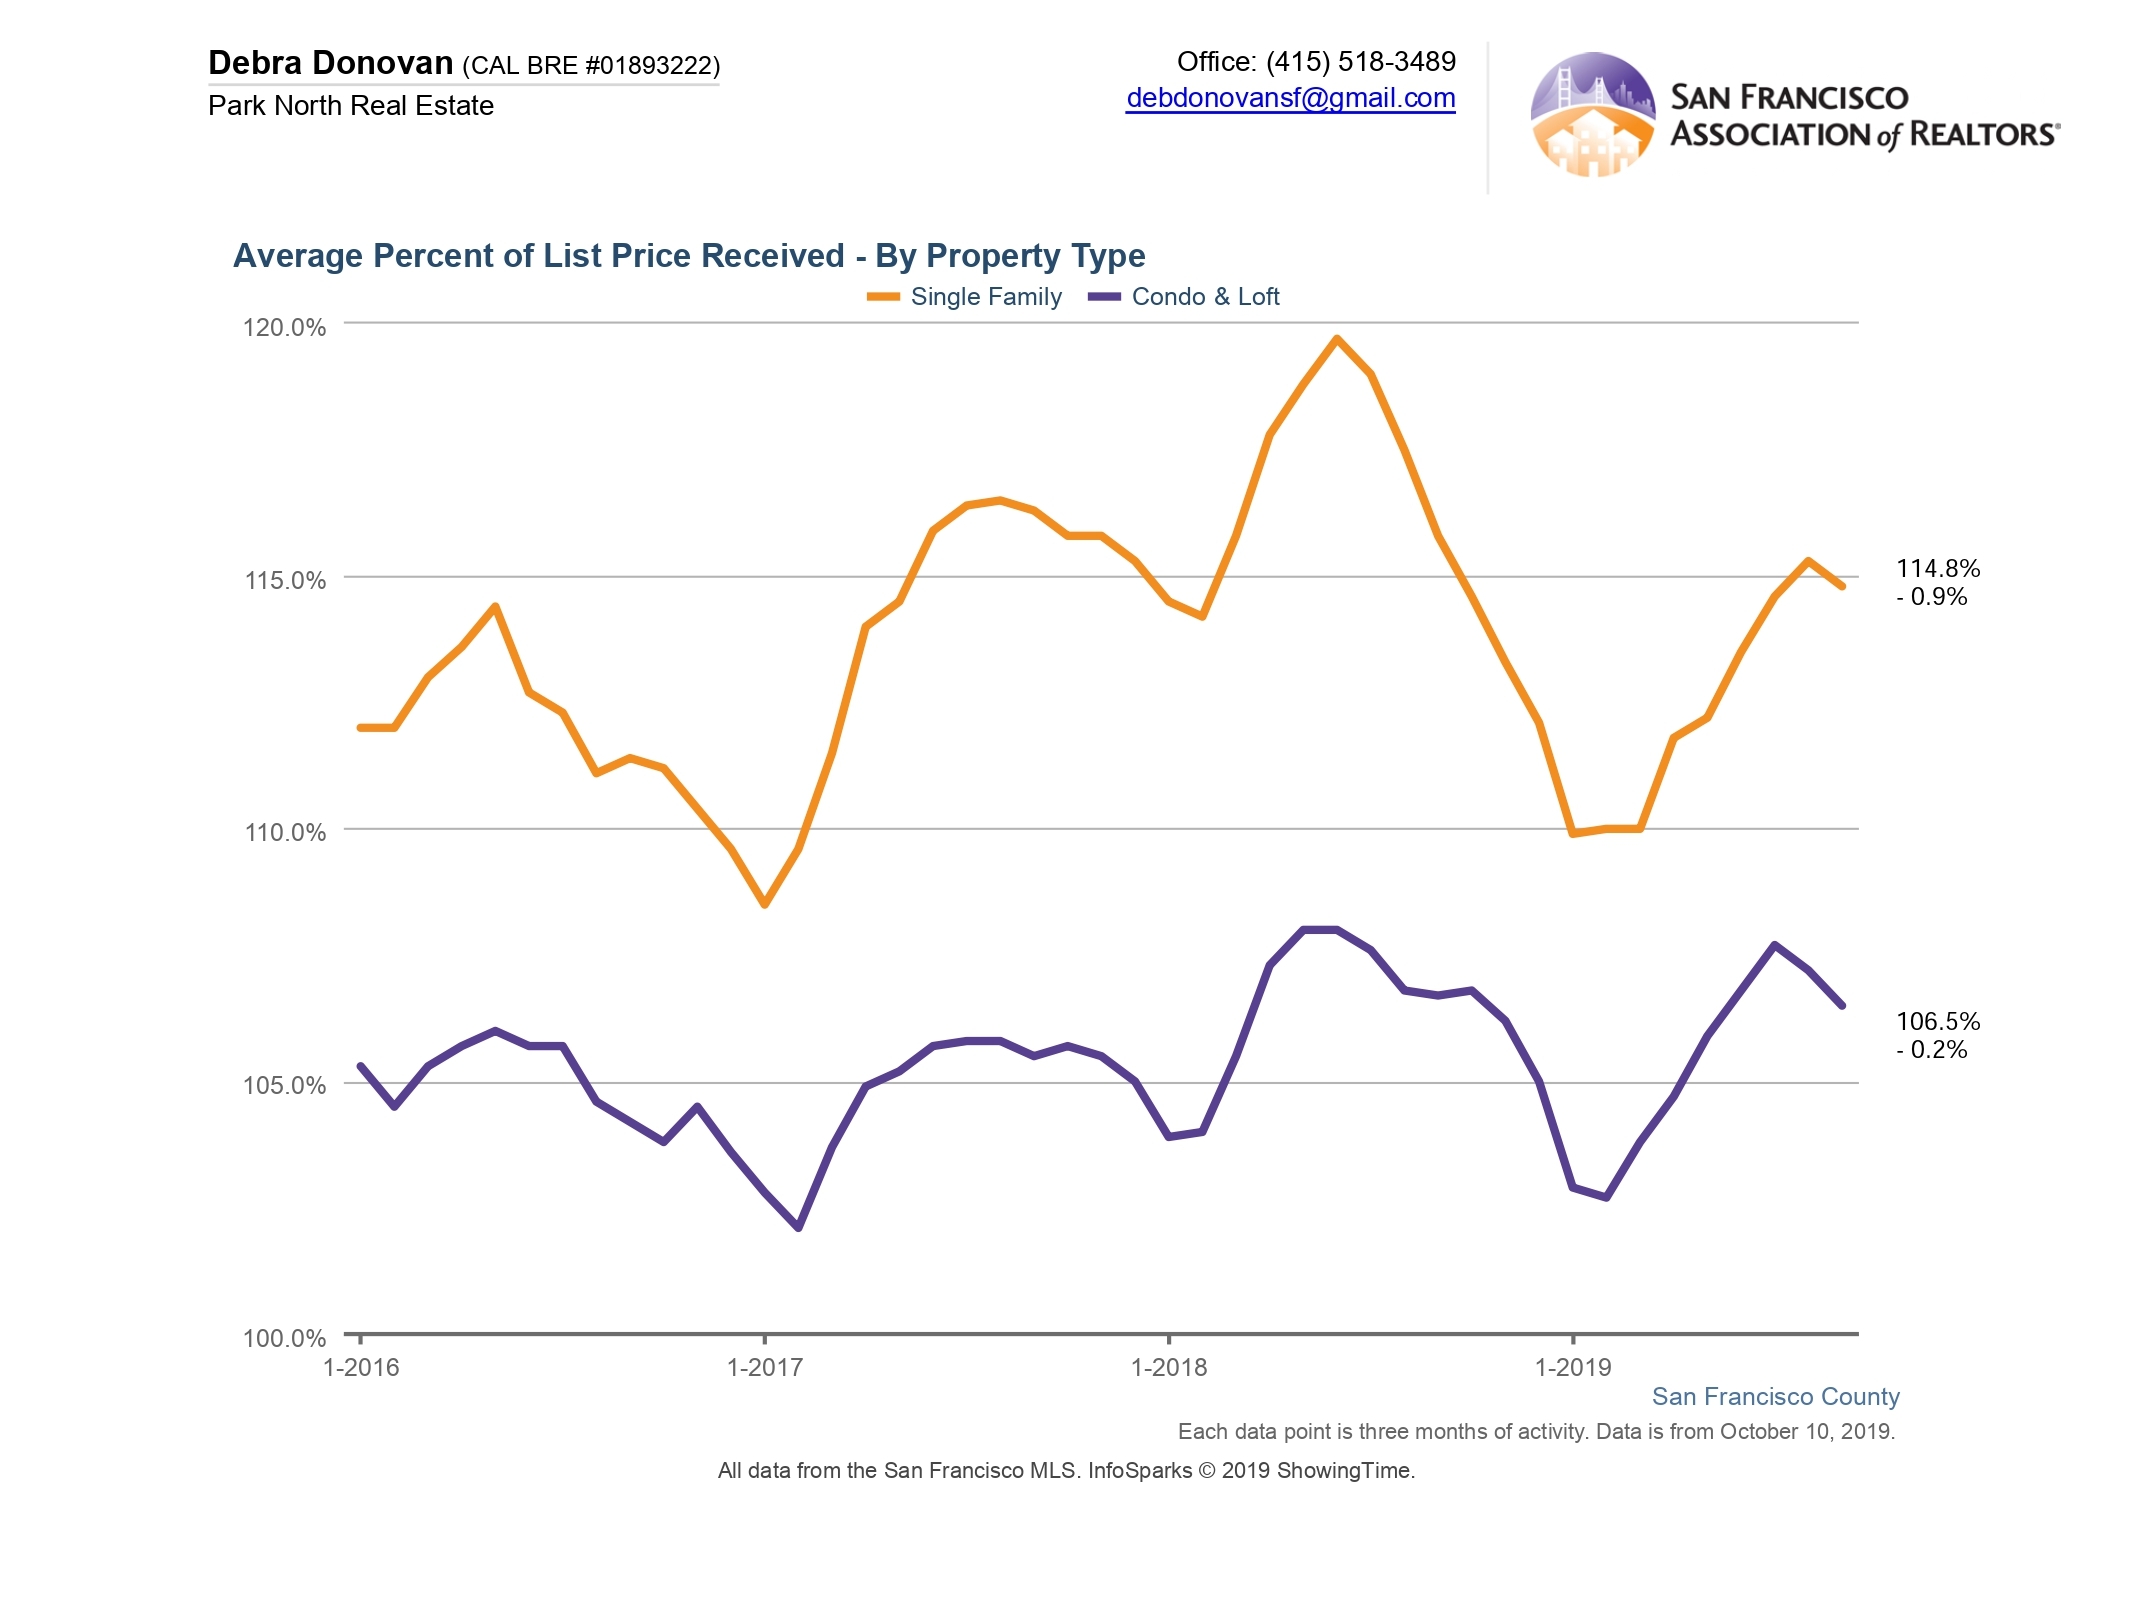
Average Percentage of List Price Received:
Single family homes sold for an average of 113% of their asking price in September. This is down about 2% compared to the same month last year. Condos and lofts sold for 105% of list price on average, about 1.5% down compared to September 2018. Buyers are still willing, and in fact expecting, to have to offer above the asking price for many (though certainly not all) properties. Whether the amout they are willing to spend over the list price continues to dwindle remains to be seen.

The average percentage of list price received was also down just slightly from Q3 2018 for single family homes (-0.9%) and condos and lofts (0.2%)
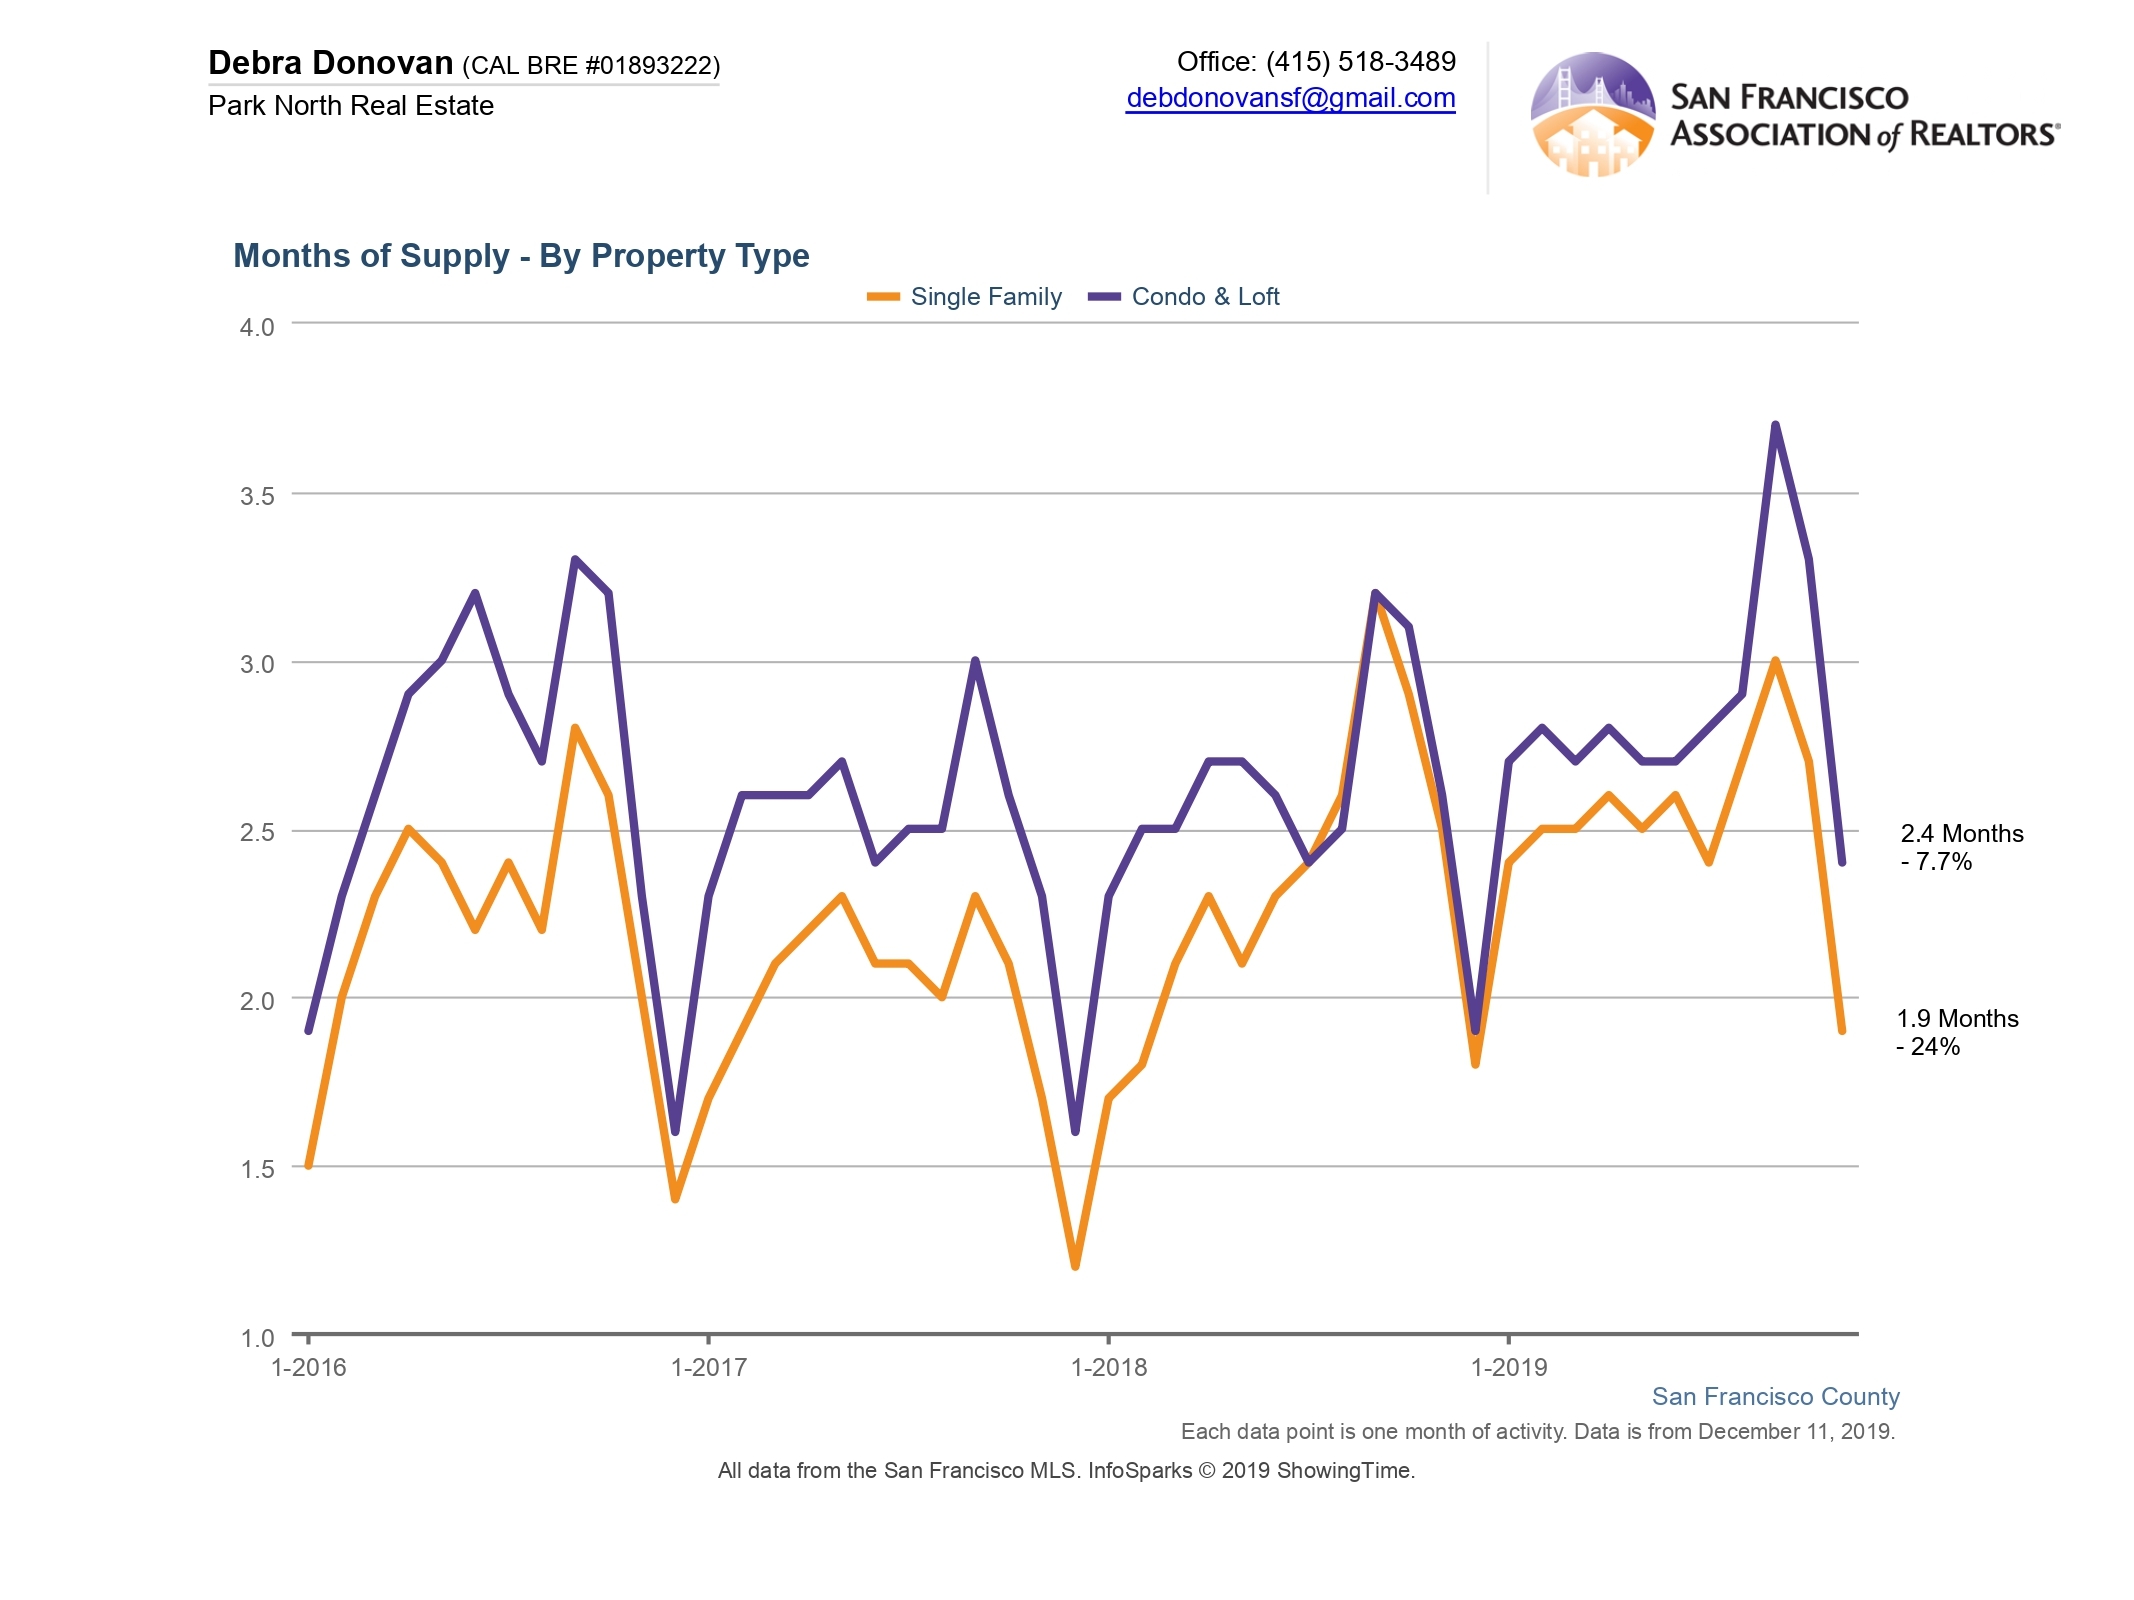
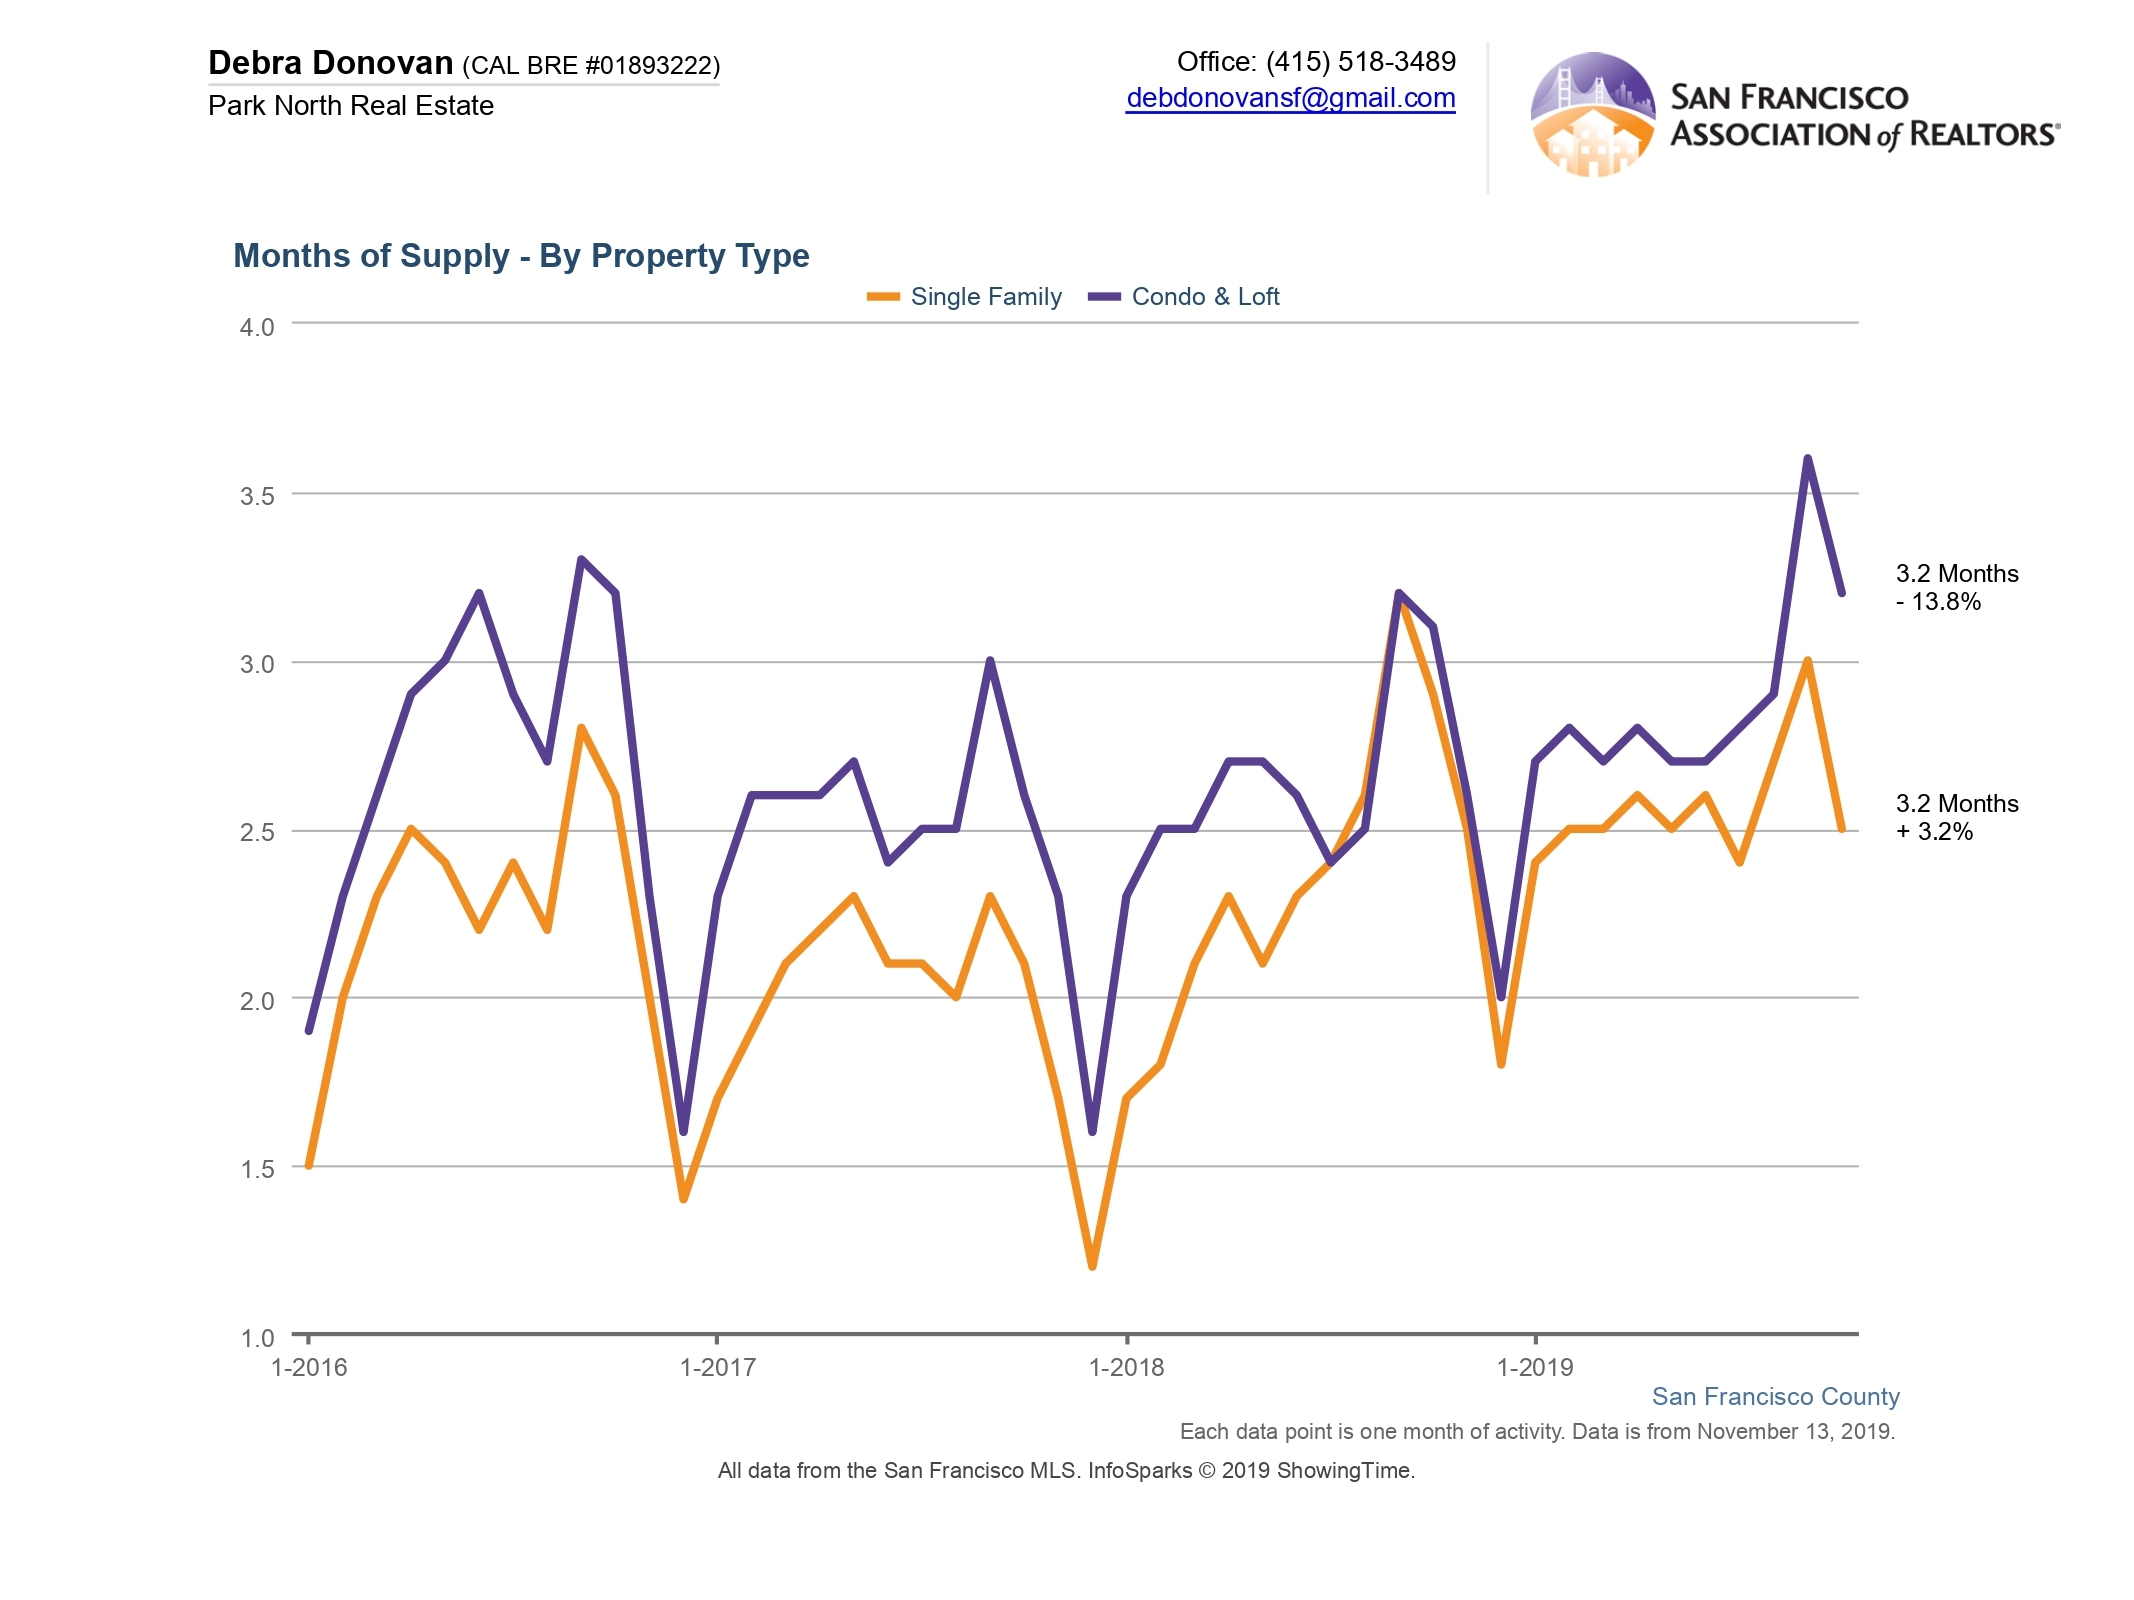
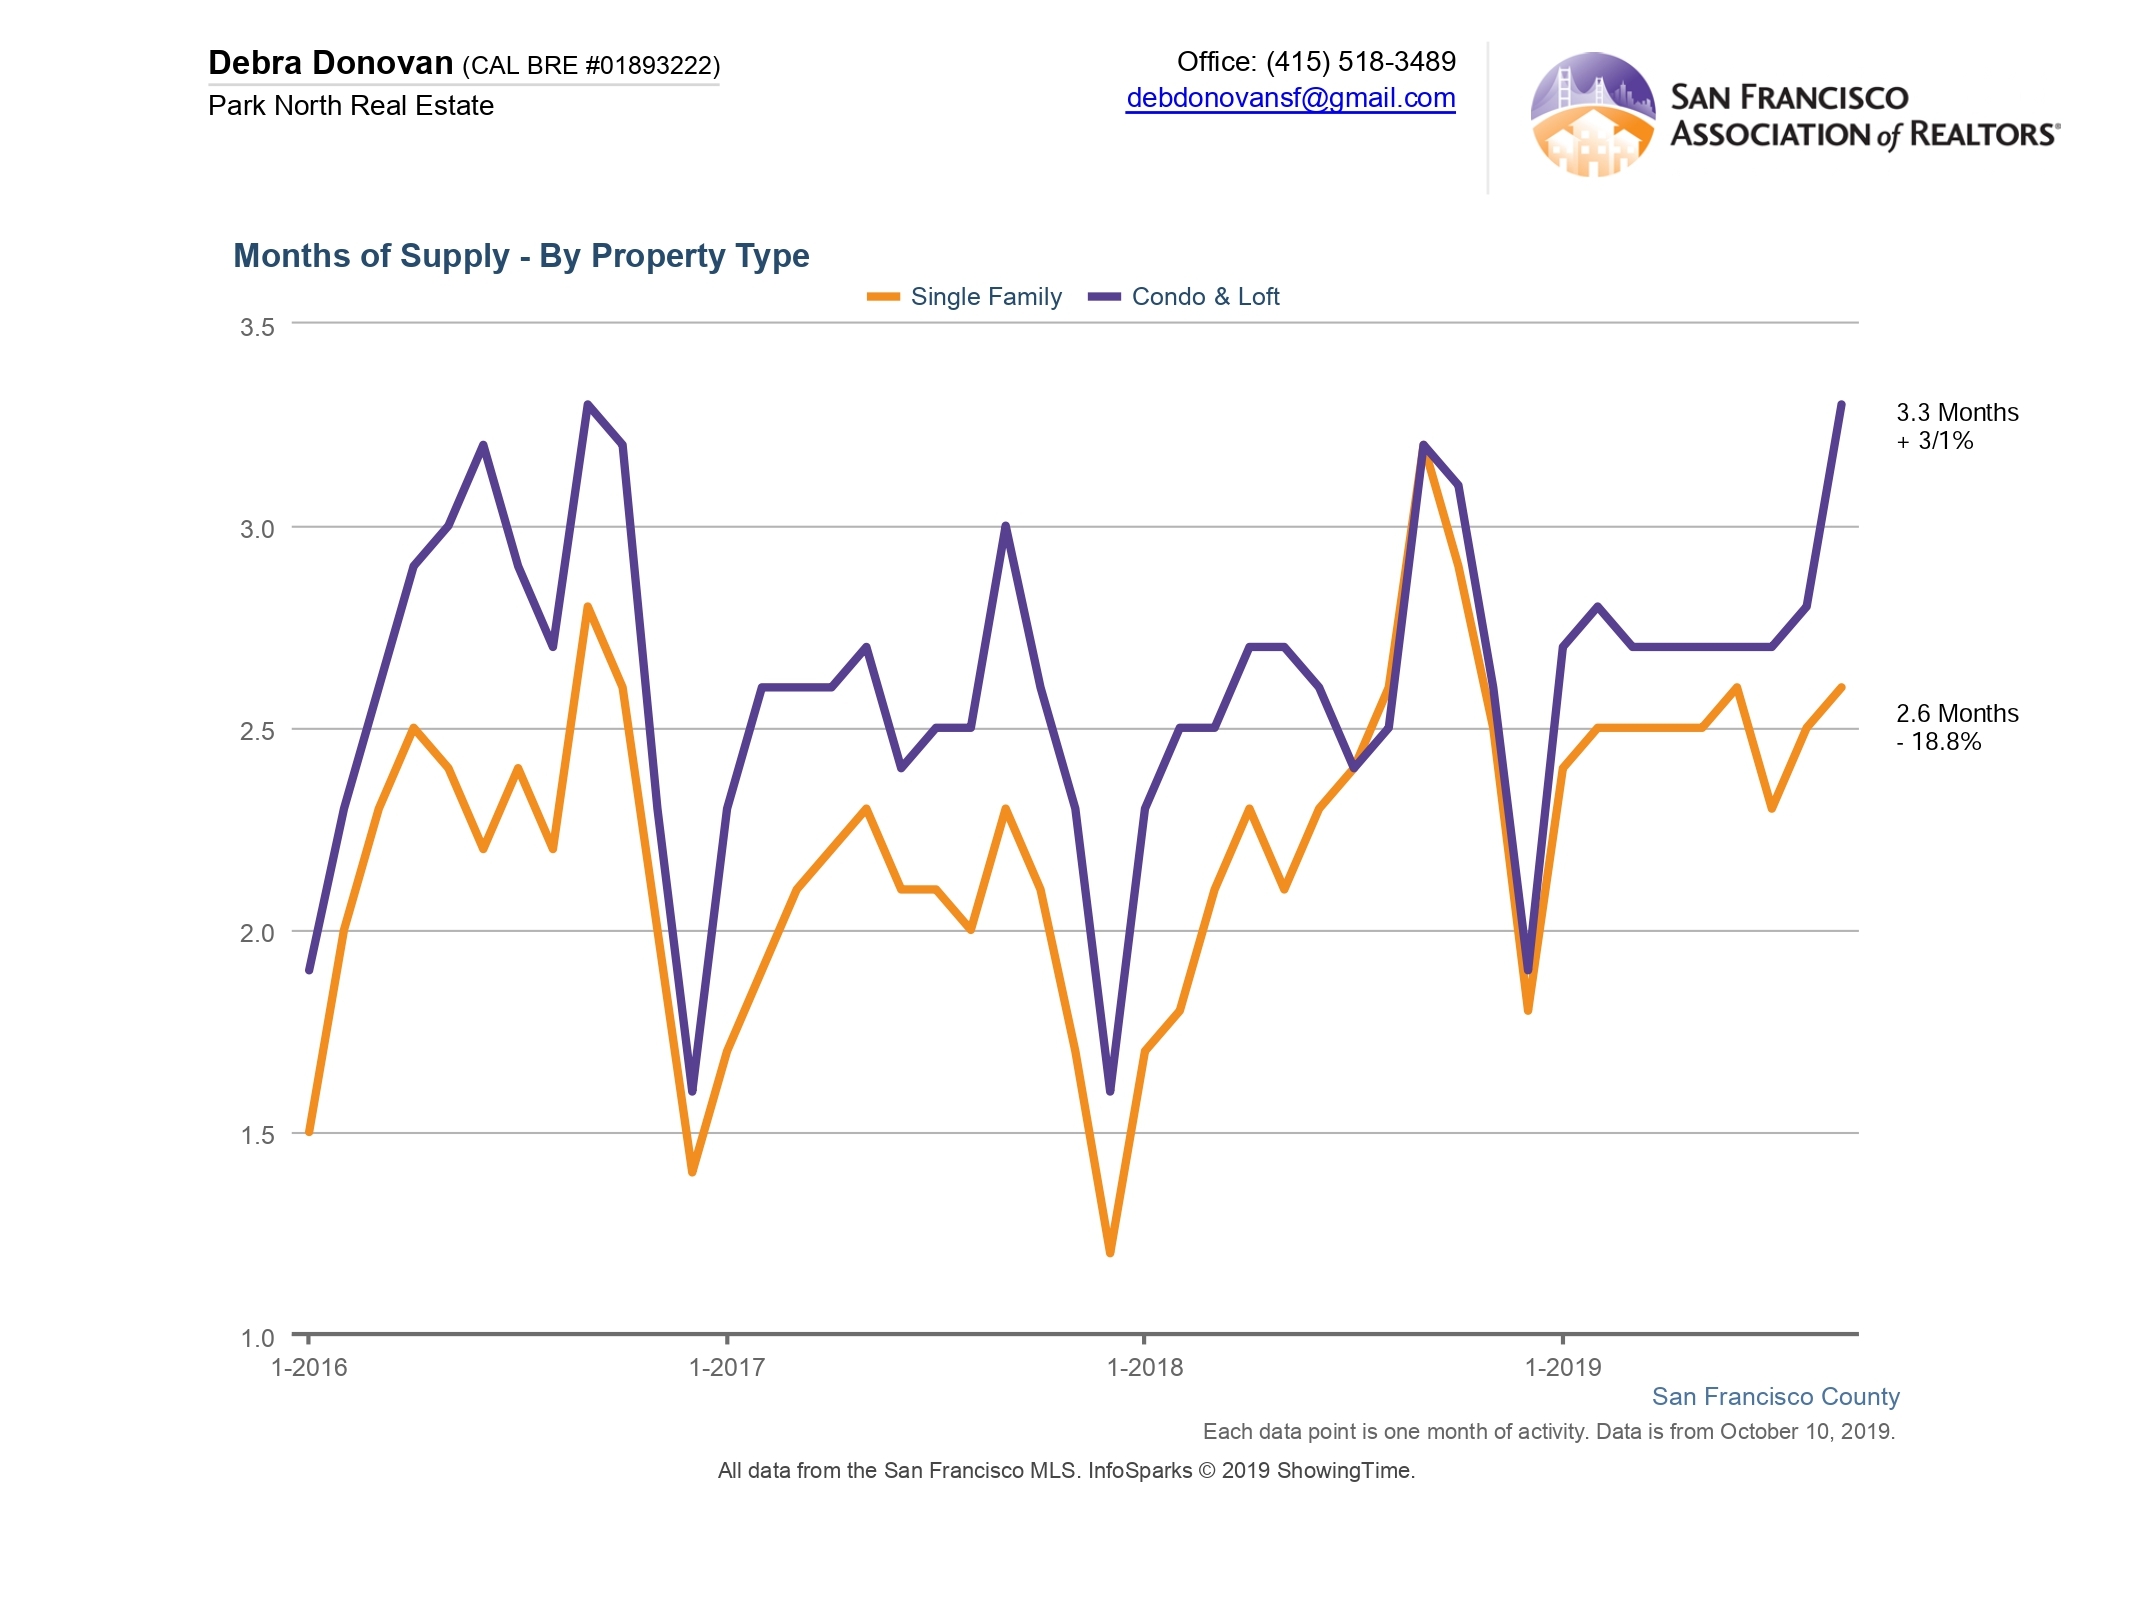
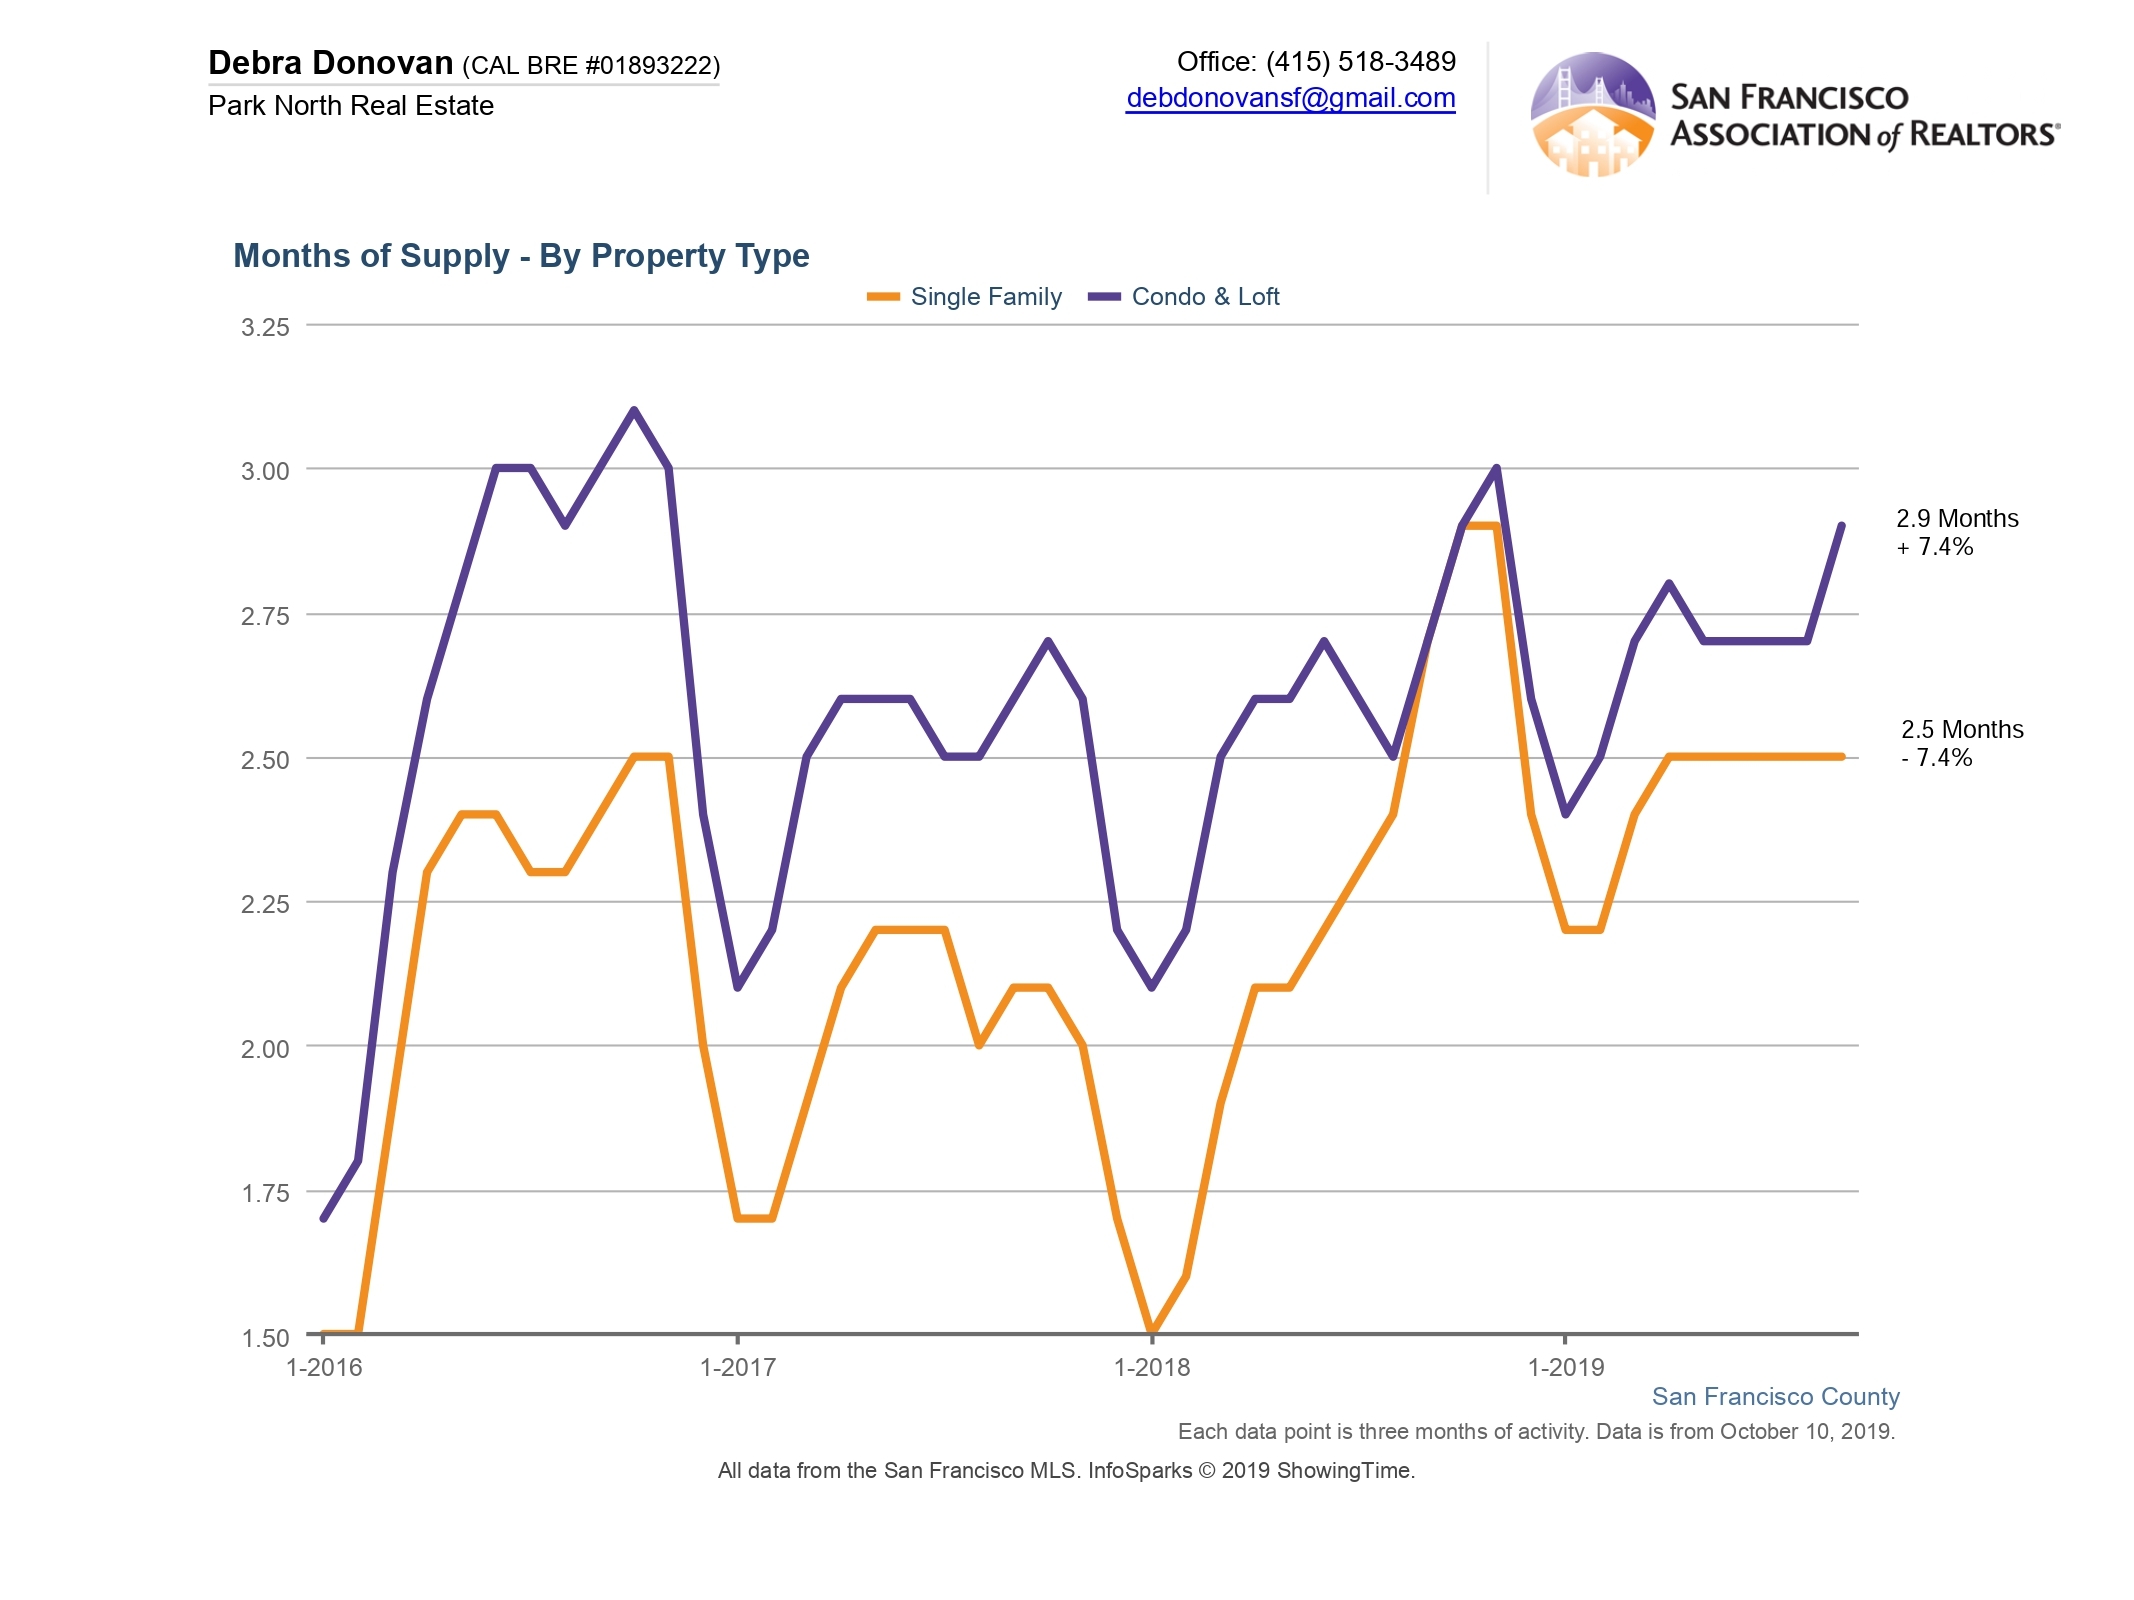
Months Supply of Inventory:
The influx of new inventory onto the market brought MSI, the absorption rate of properties, to the highest it’s been all year. Single family homes ended the month with 2.6 months of inventory, though it was still down almost 20% compared to last year. Condos and lofts hit over 3 months of inventory, up about 3% compared to September 2018.
MSI for single family homes was also down for the quarter, though not as dramatically, coming in at 2.5 months. Condos and lofts were up to 2.9 months of inventory, up 7.4%. Again, this does not include most new construction sales, so the actual amount of inventory for condos is unknown.
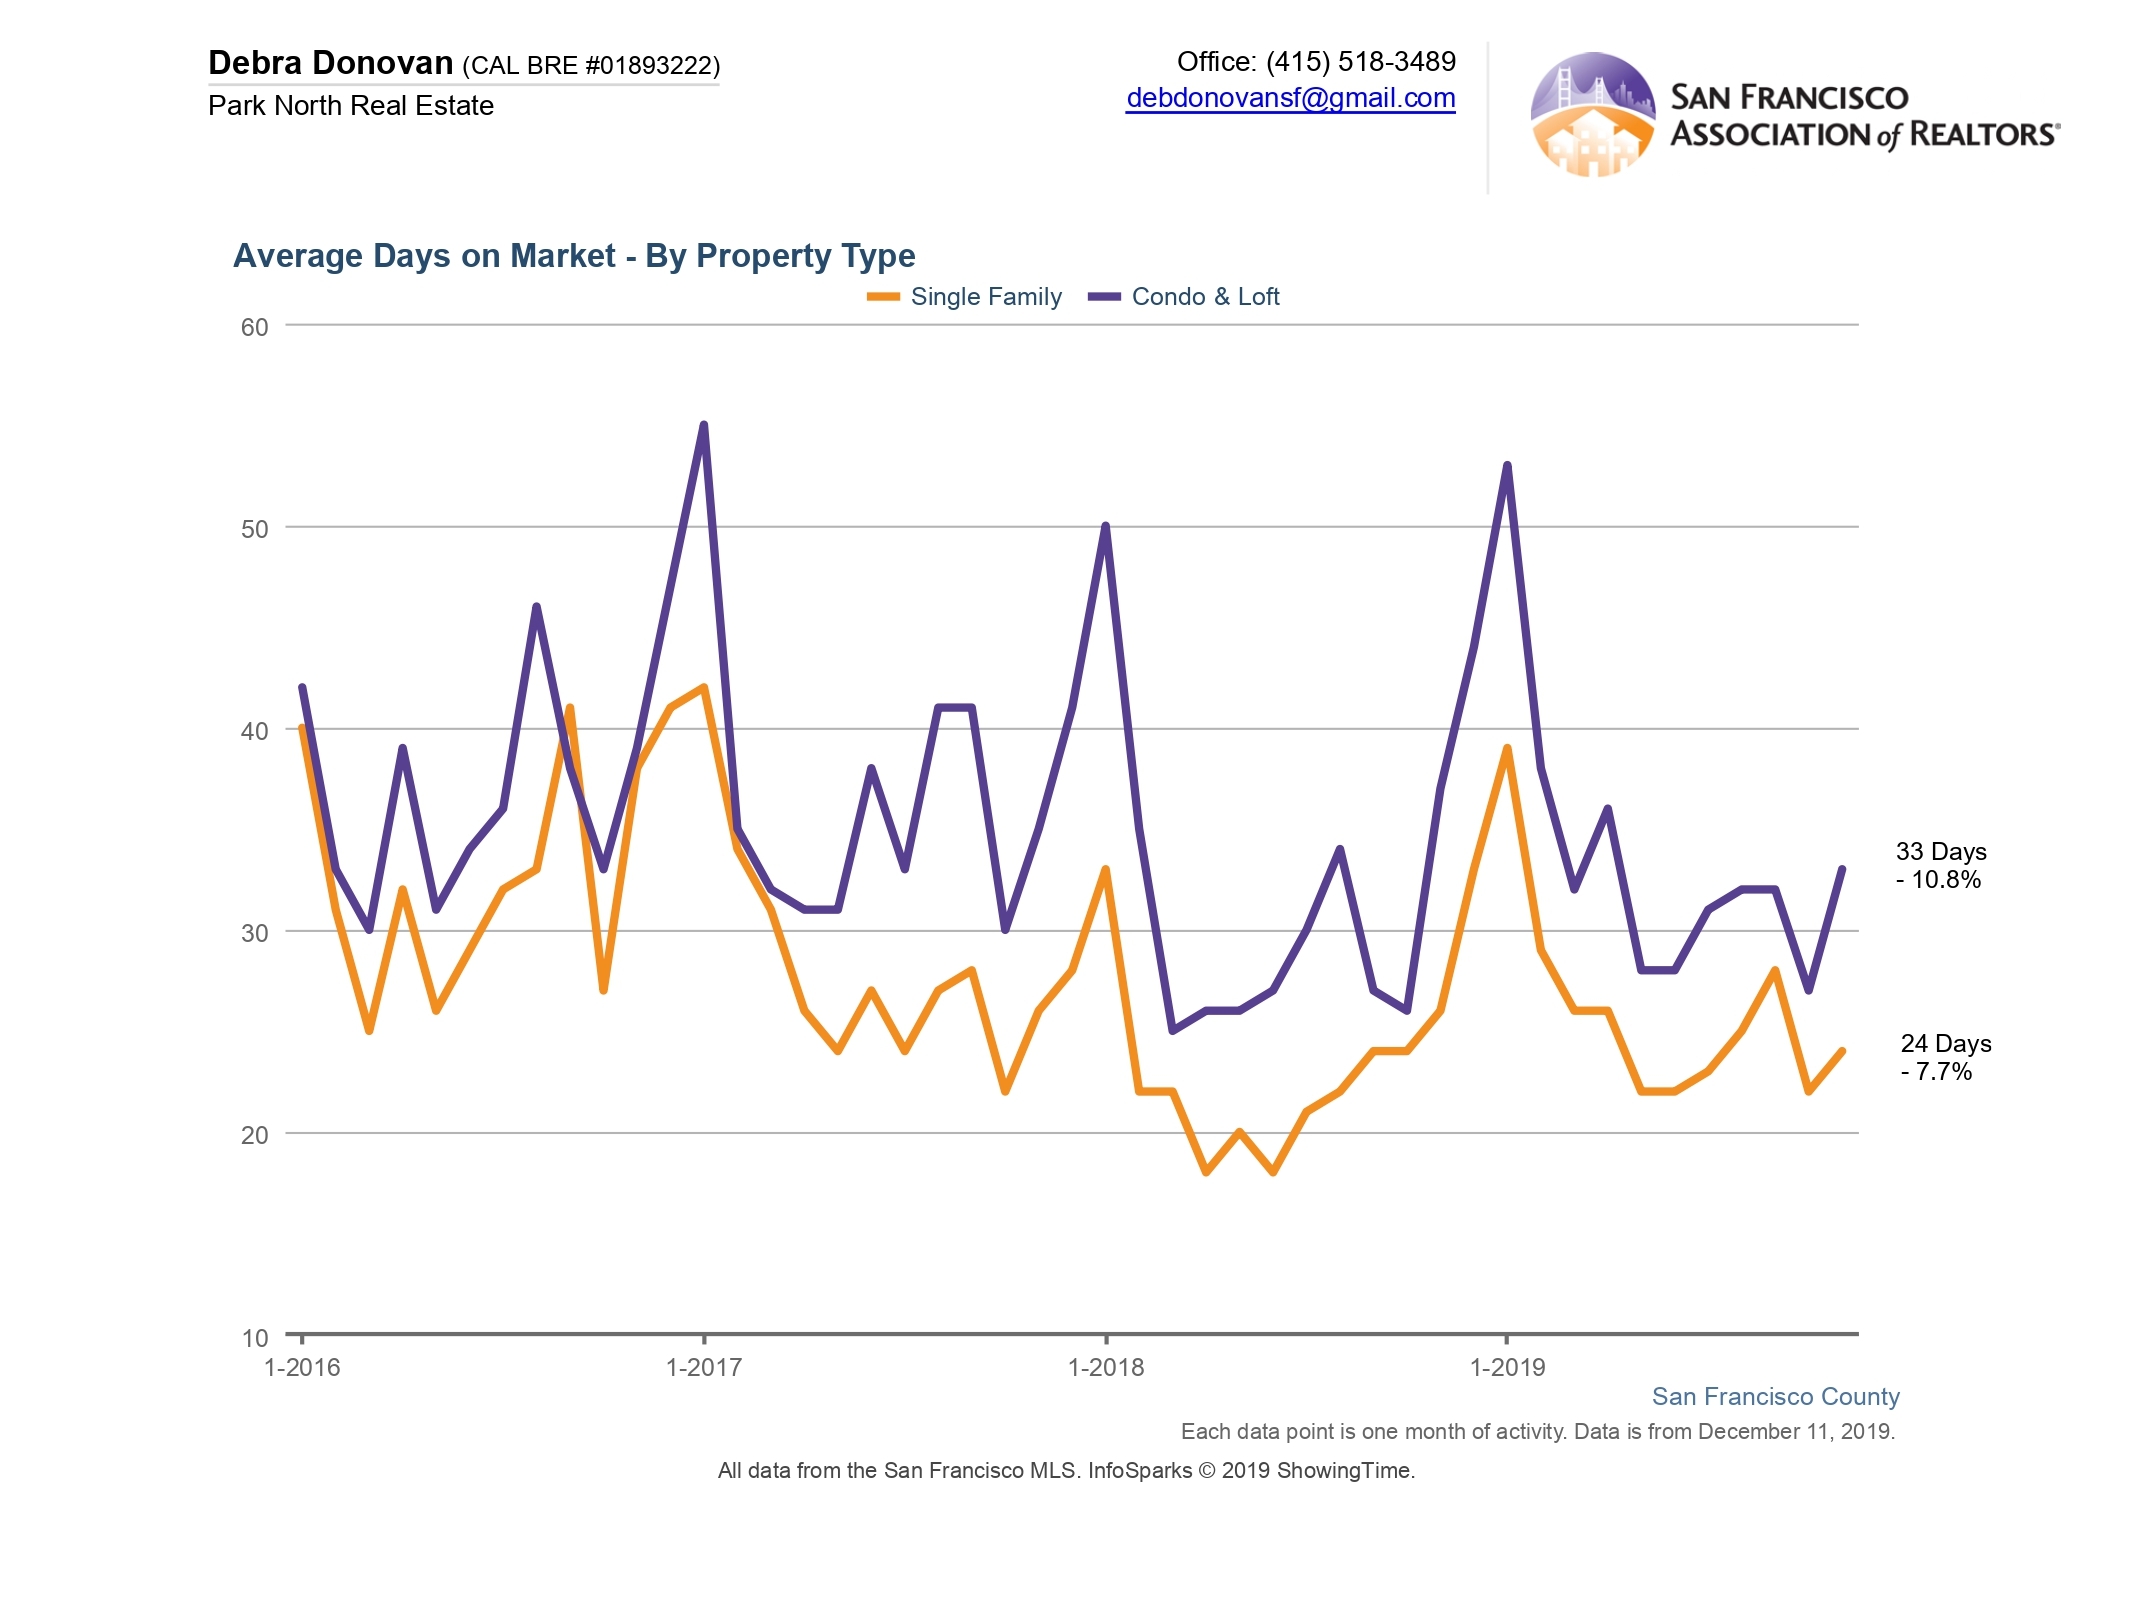
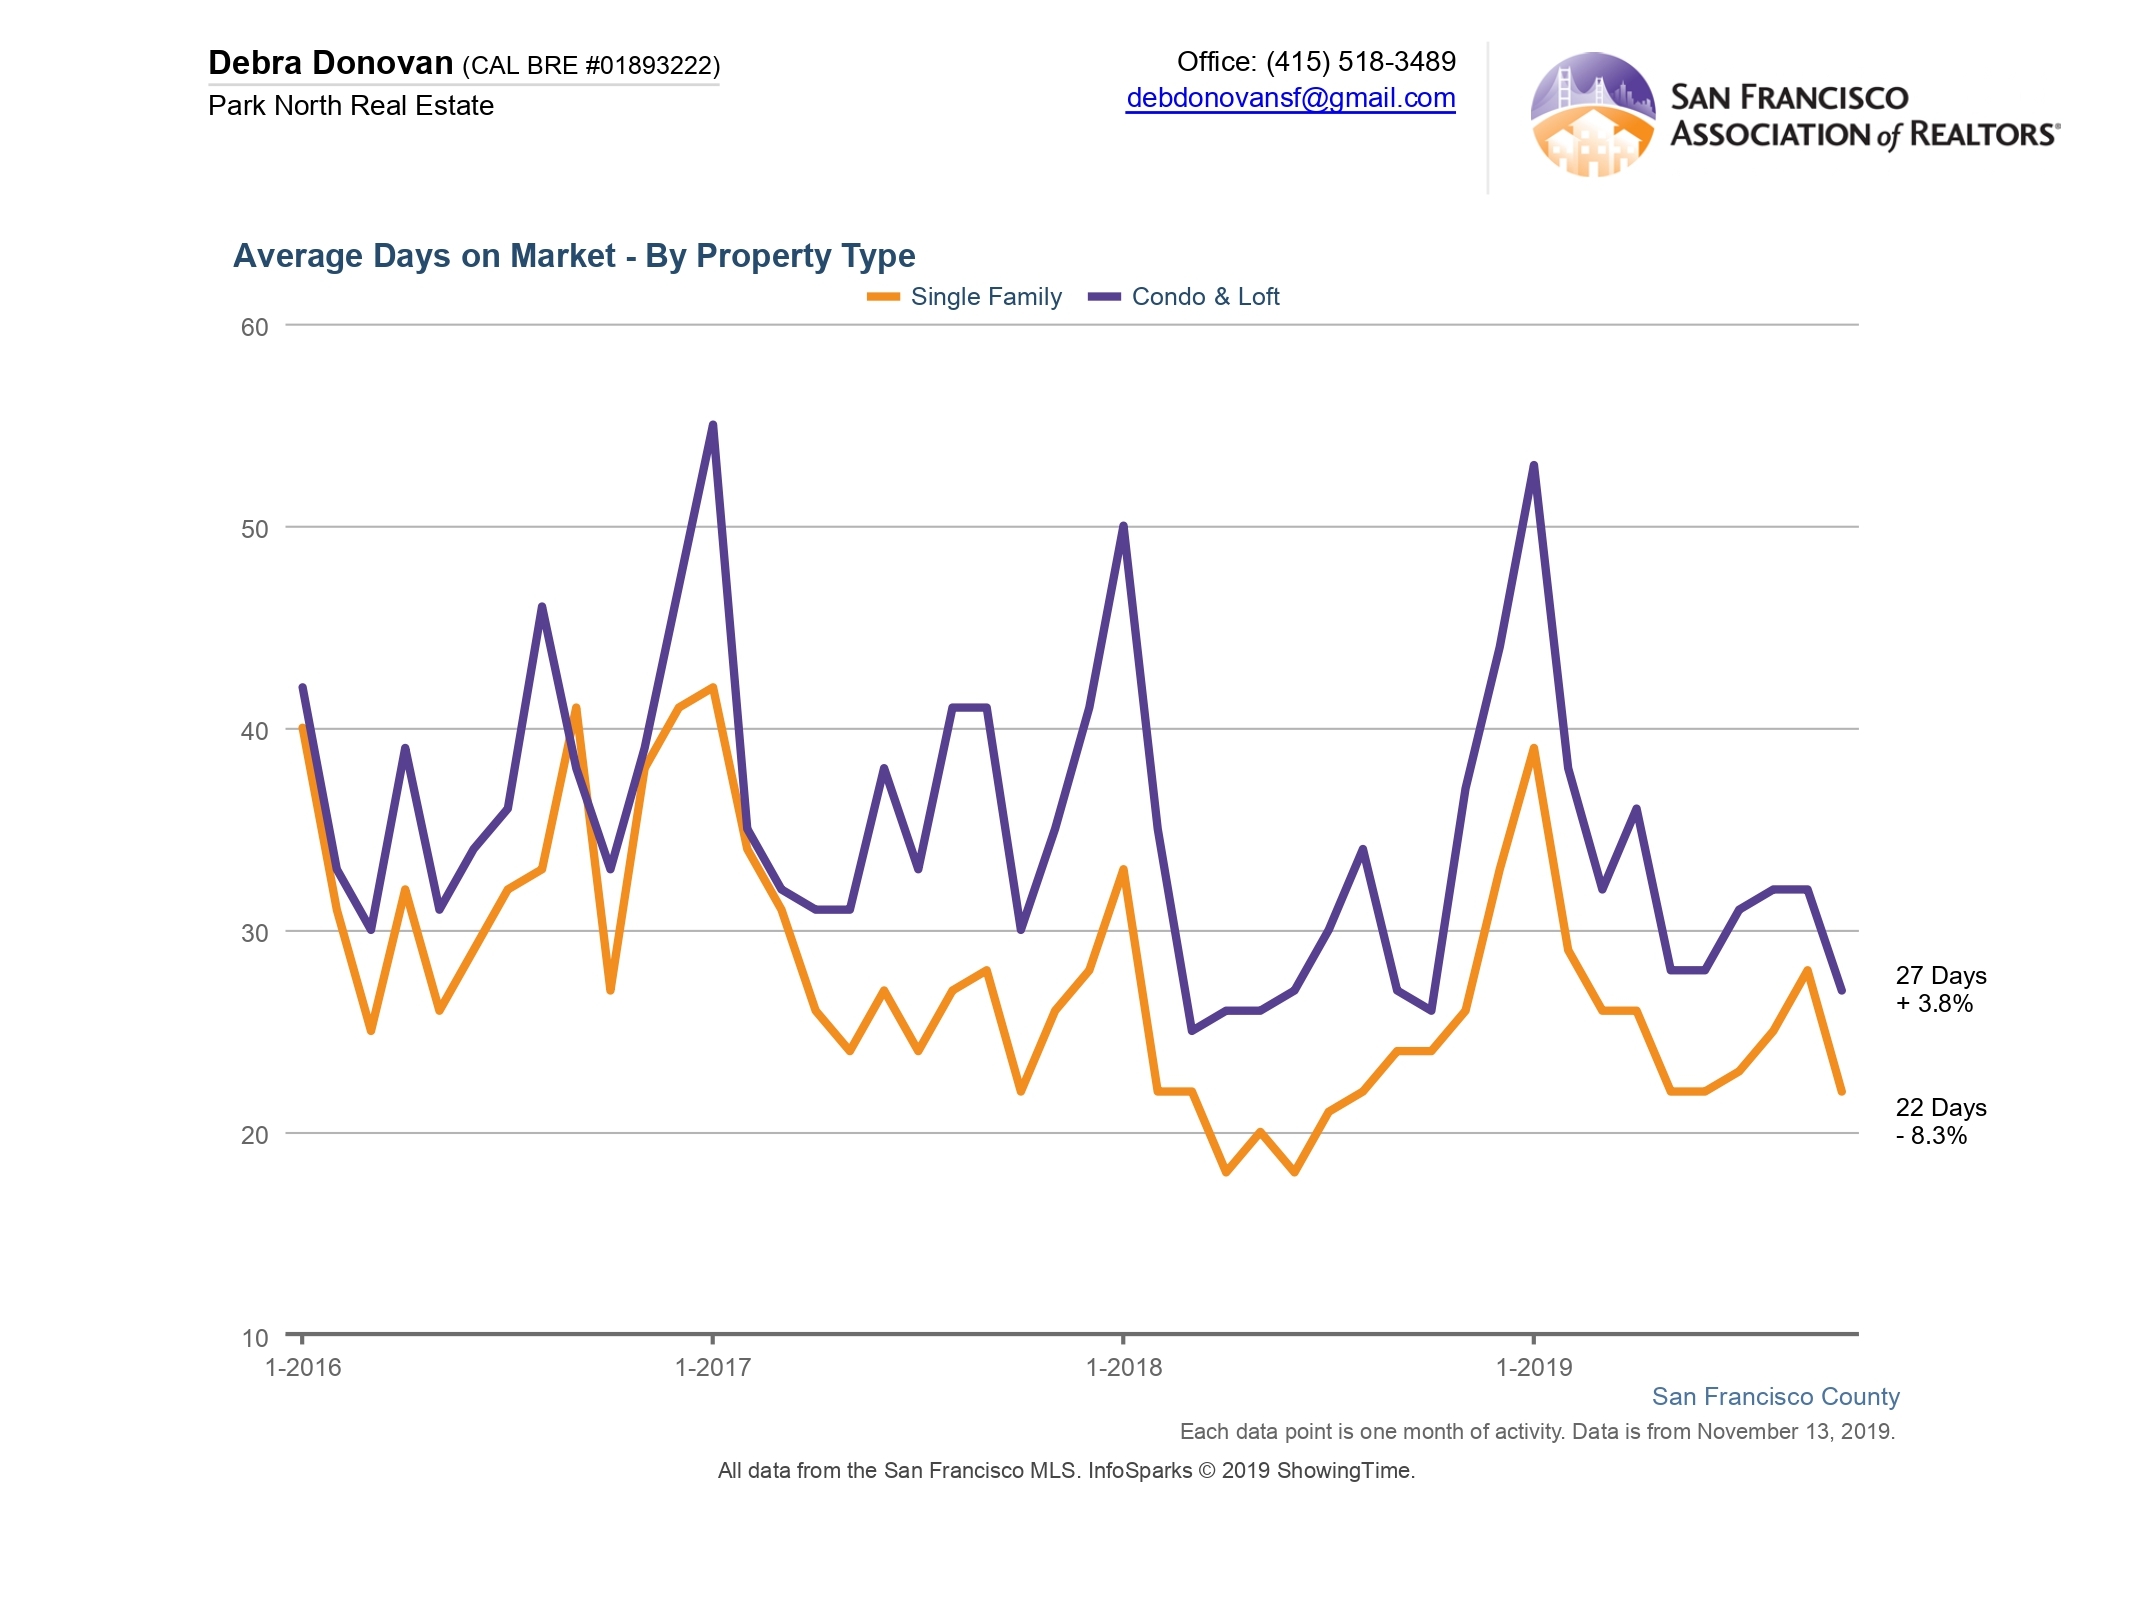
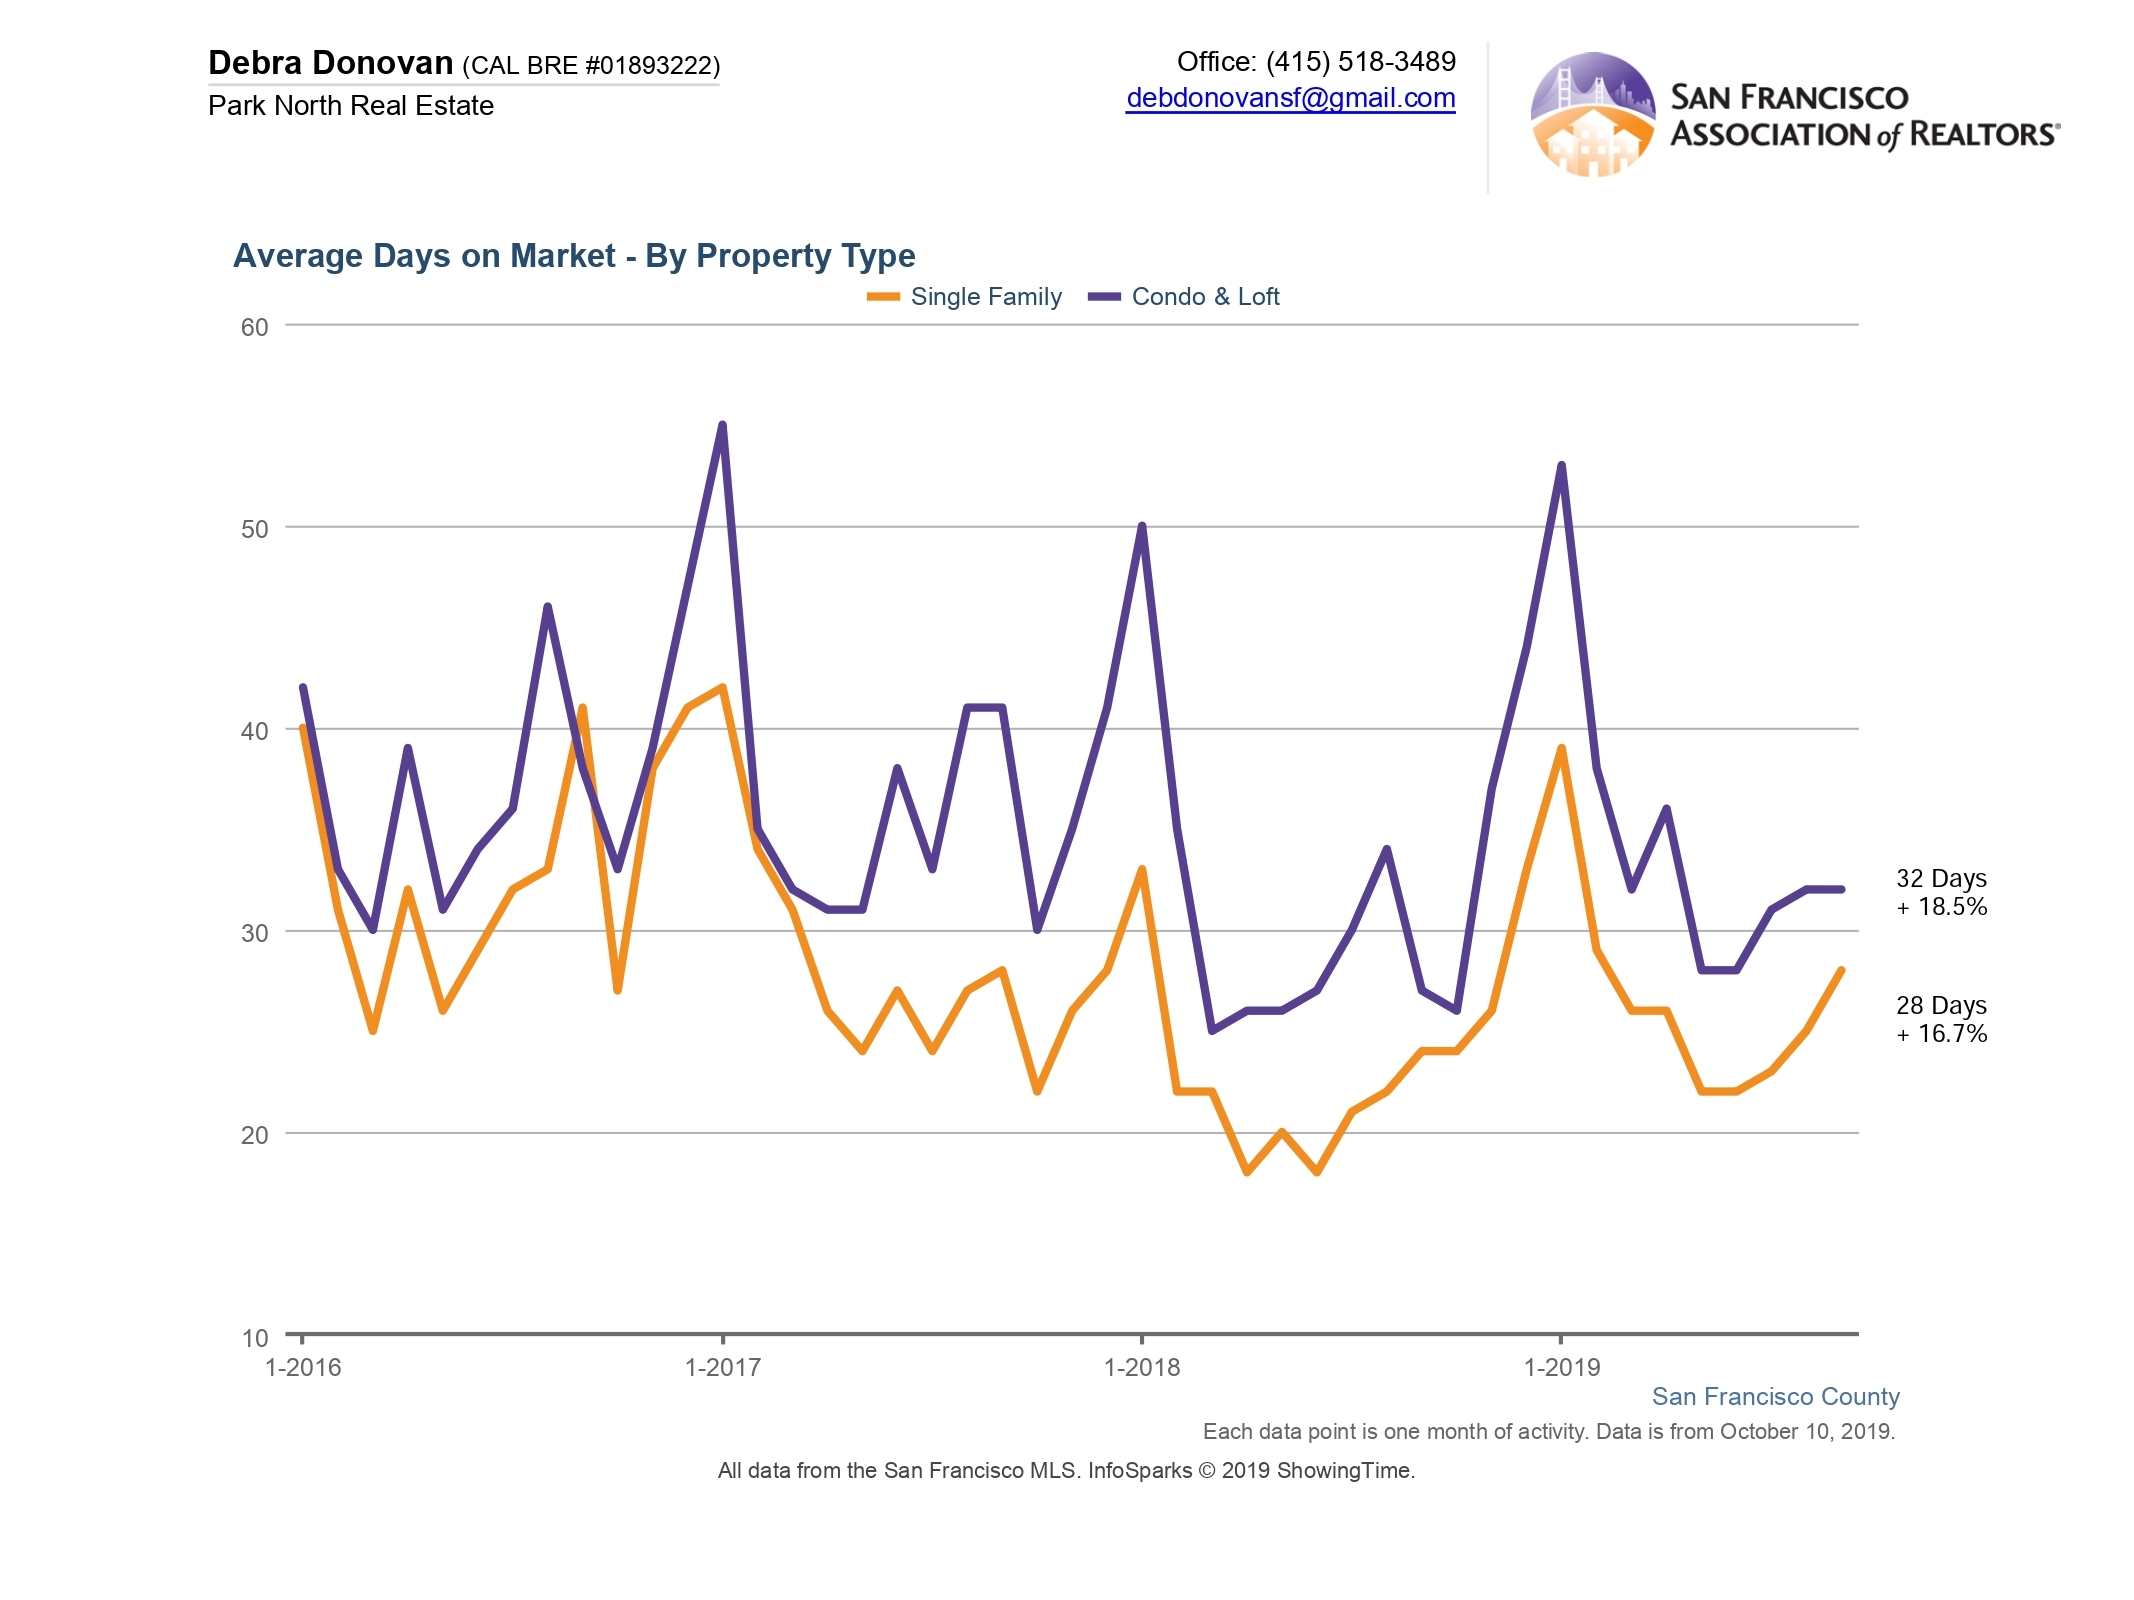
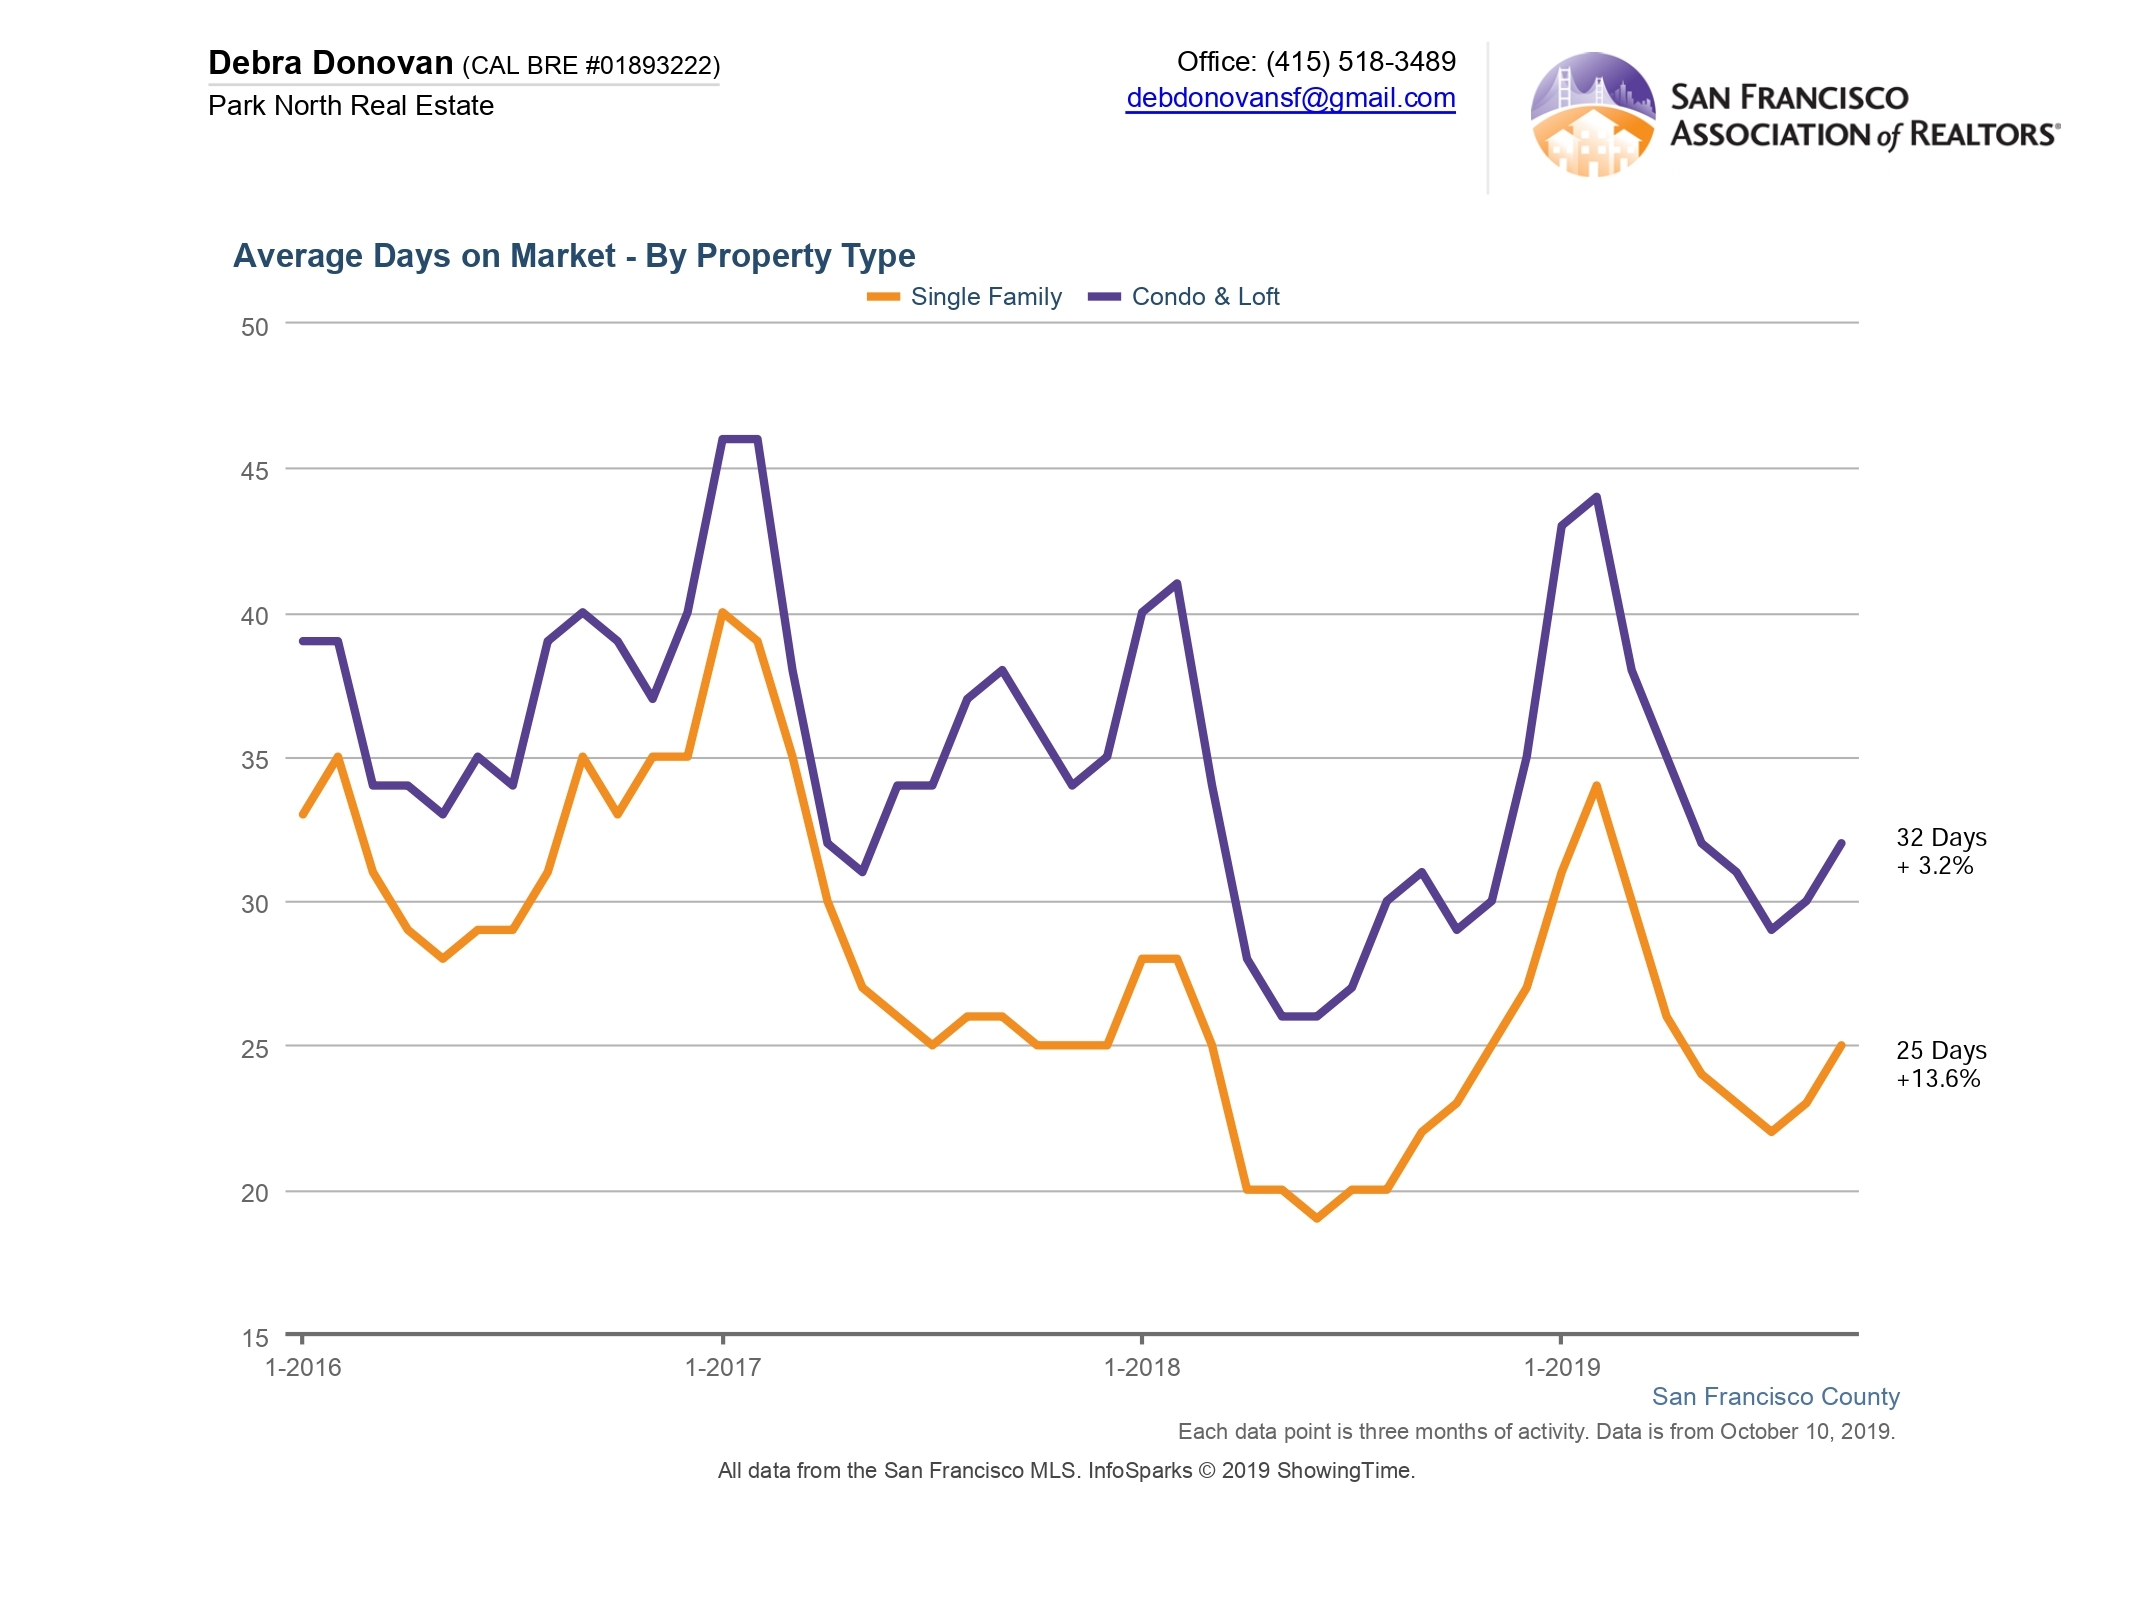
Average Days on Market:
The number of days on market increased for both single family homes and condos/ lofts for September, as well as for Q3. Compared to the same month last year, single family homes were on the market an average of 25 days in September, up over 13%, and for an average of 28 days over the quarter, which was up almost 17%. Condos and lofts on average spent 32 days on the market for the month and the quarter before accepting an offer, up 3.2% and 18.5% respectively.
The fine print: All information deemed reliable but not guaranteed or warranted. Data comes from MLS so does not include off-market and most new construction condo sales. The San Francisco real estate market is dynamic so statistics can change on a daily basis. These statistics are meant to be a snapshot of the day and time they were pulled.