After significant jumps in median sales price earlier this year, particularly for single family homes, the market has mostly remained flat for the 2nd quarter. New and active listings continue to be down double-digits compared to the same month last year as our anemic inventory situation continues. On the other hand, months supply of inventory was at its lowest point since January, particularly for single family homes. The percentage of homes selling for over asking price also jumped. For single family homes it was the highest since September of last year; for condos and lofts since May 2016. See the latest stats, as well as which districts have the lowest cost per square foot in the city below.
Median Sales Price:
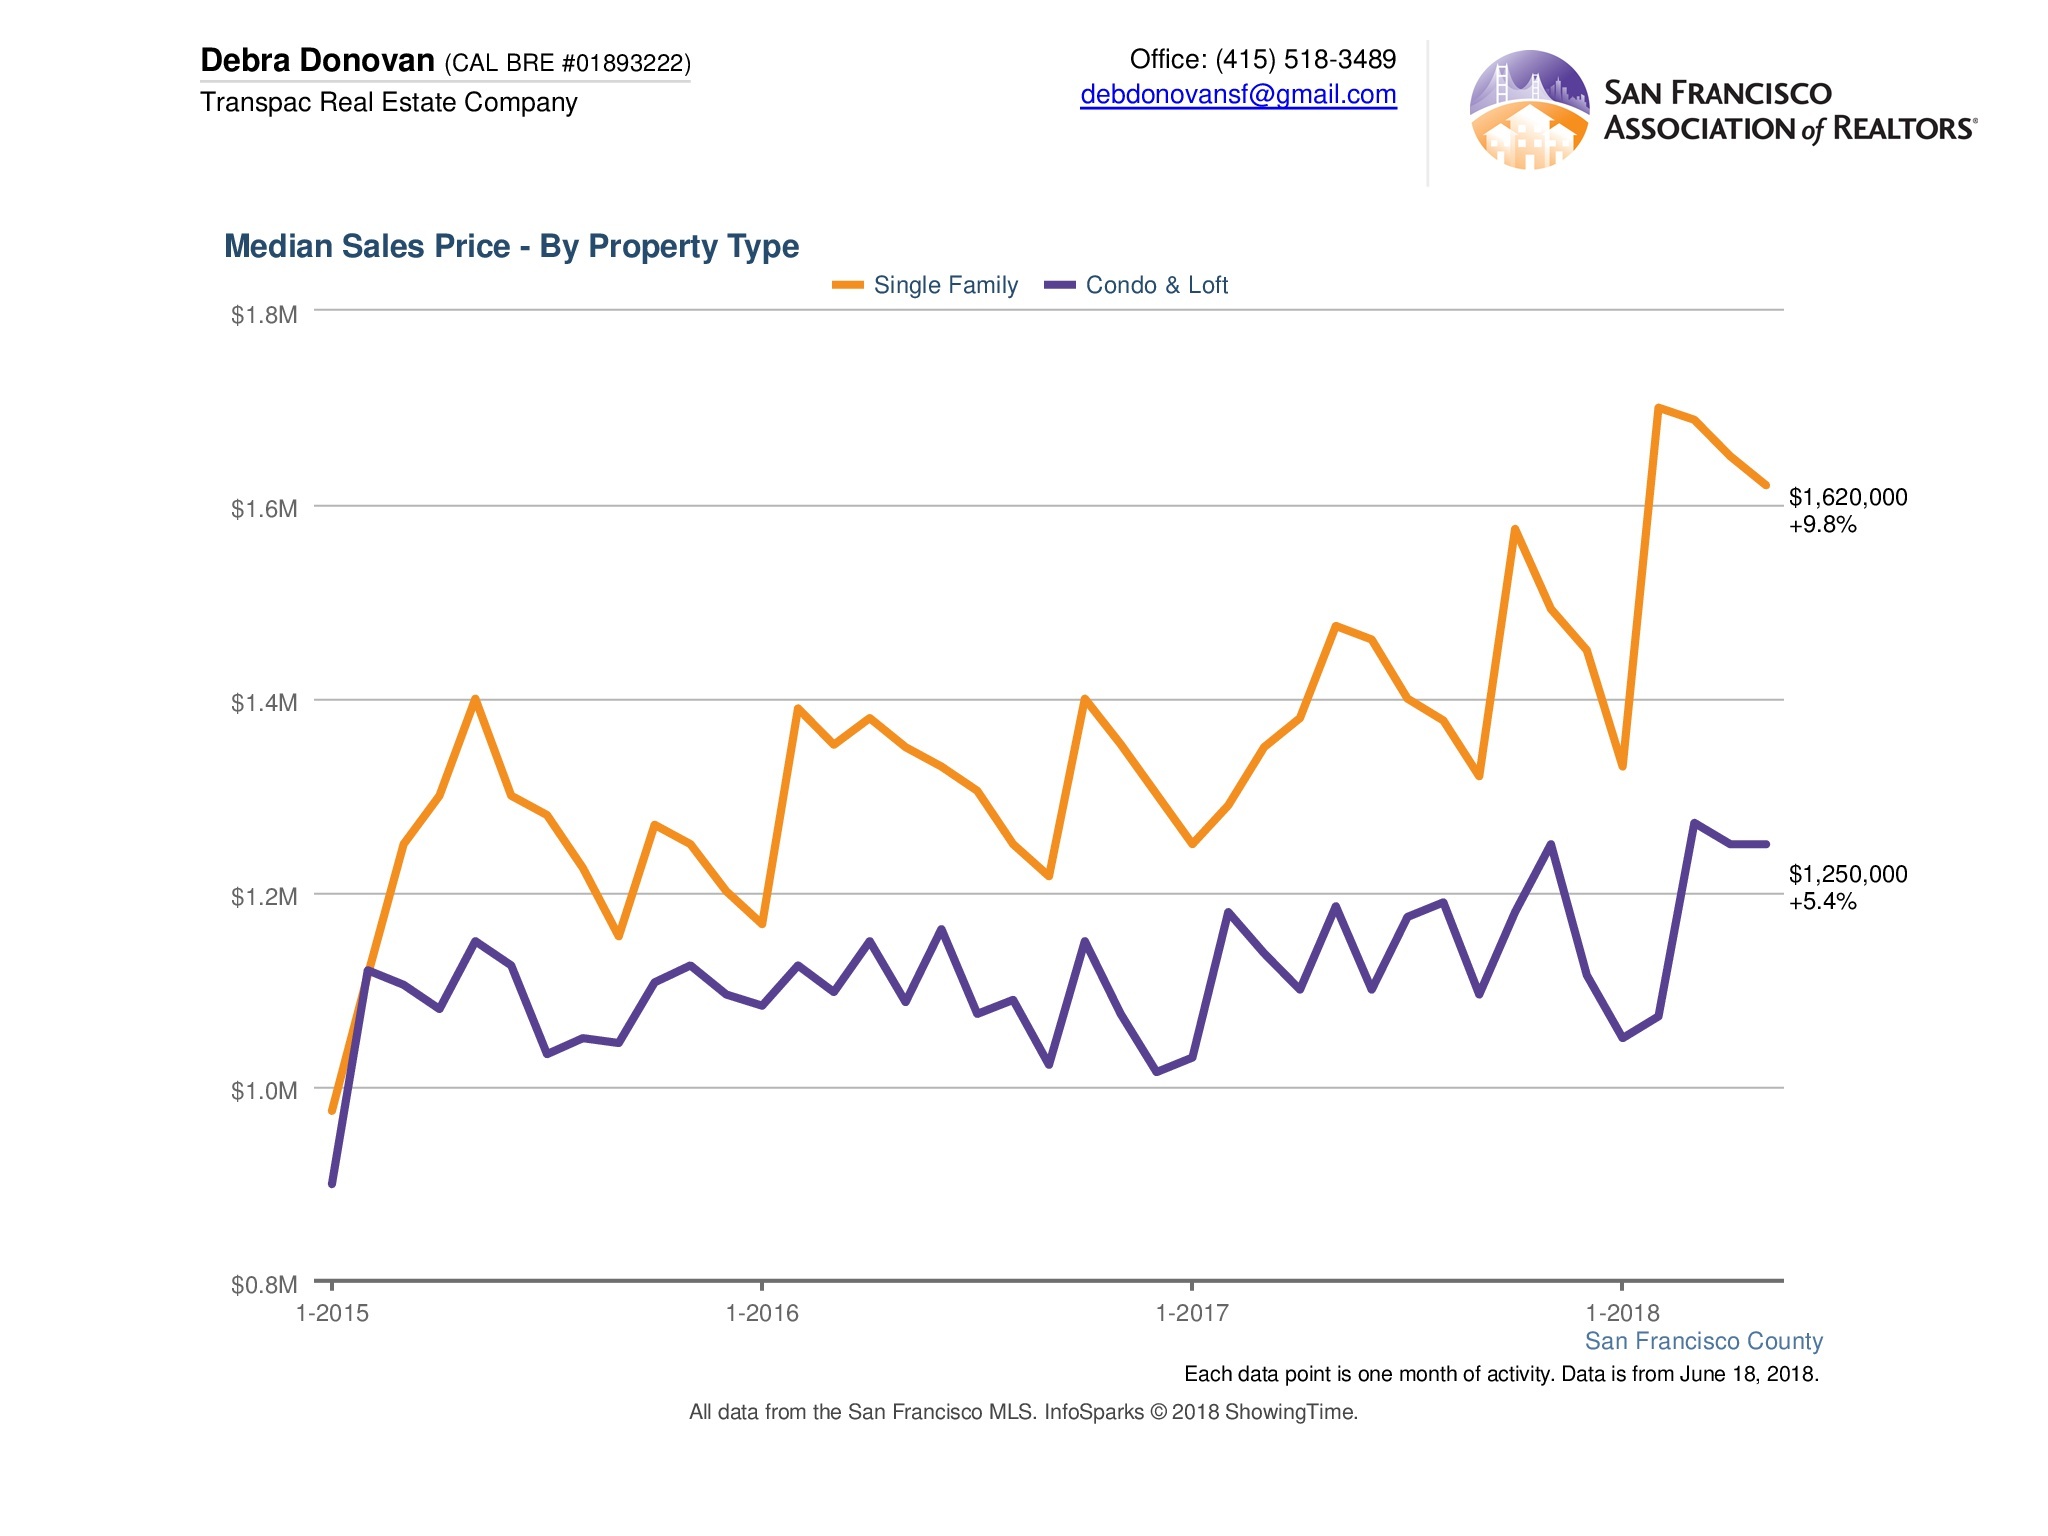
The median sales price for a single family home dropped slightly compared to last month and ended at $1,620,000. That’s still up almost 10% compared to June 2017. Condos and loft median prices remained steady compared to last month at $1,250,000, but were still up more than 5% compared to the same month last year.
New Listings:
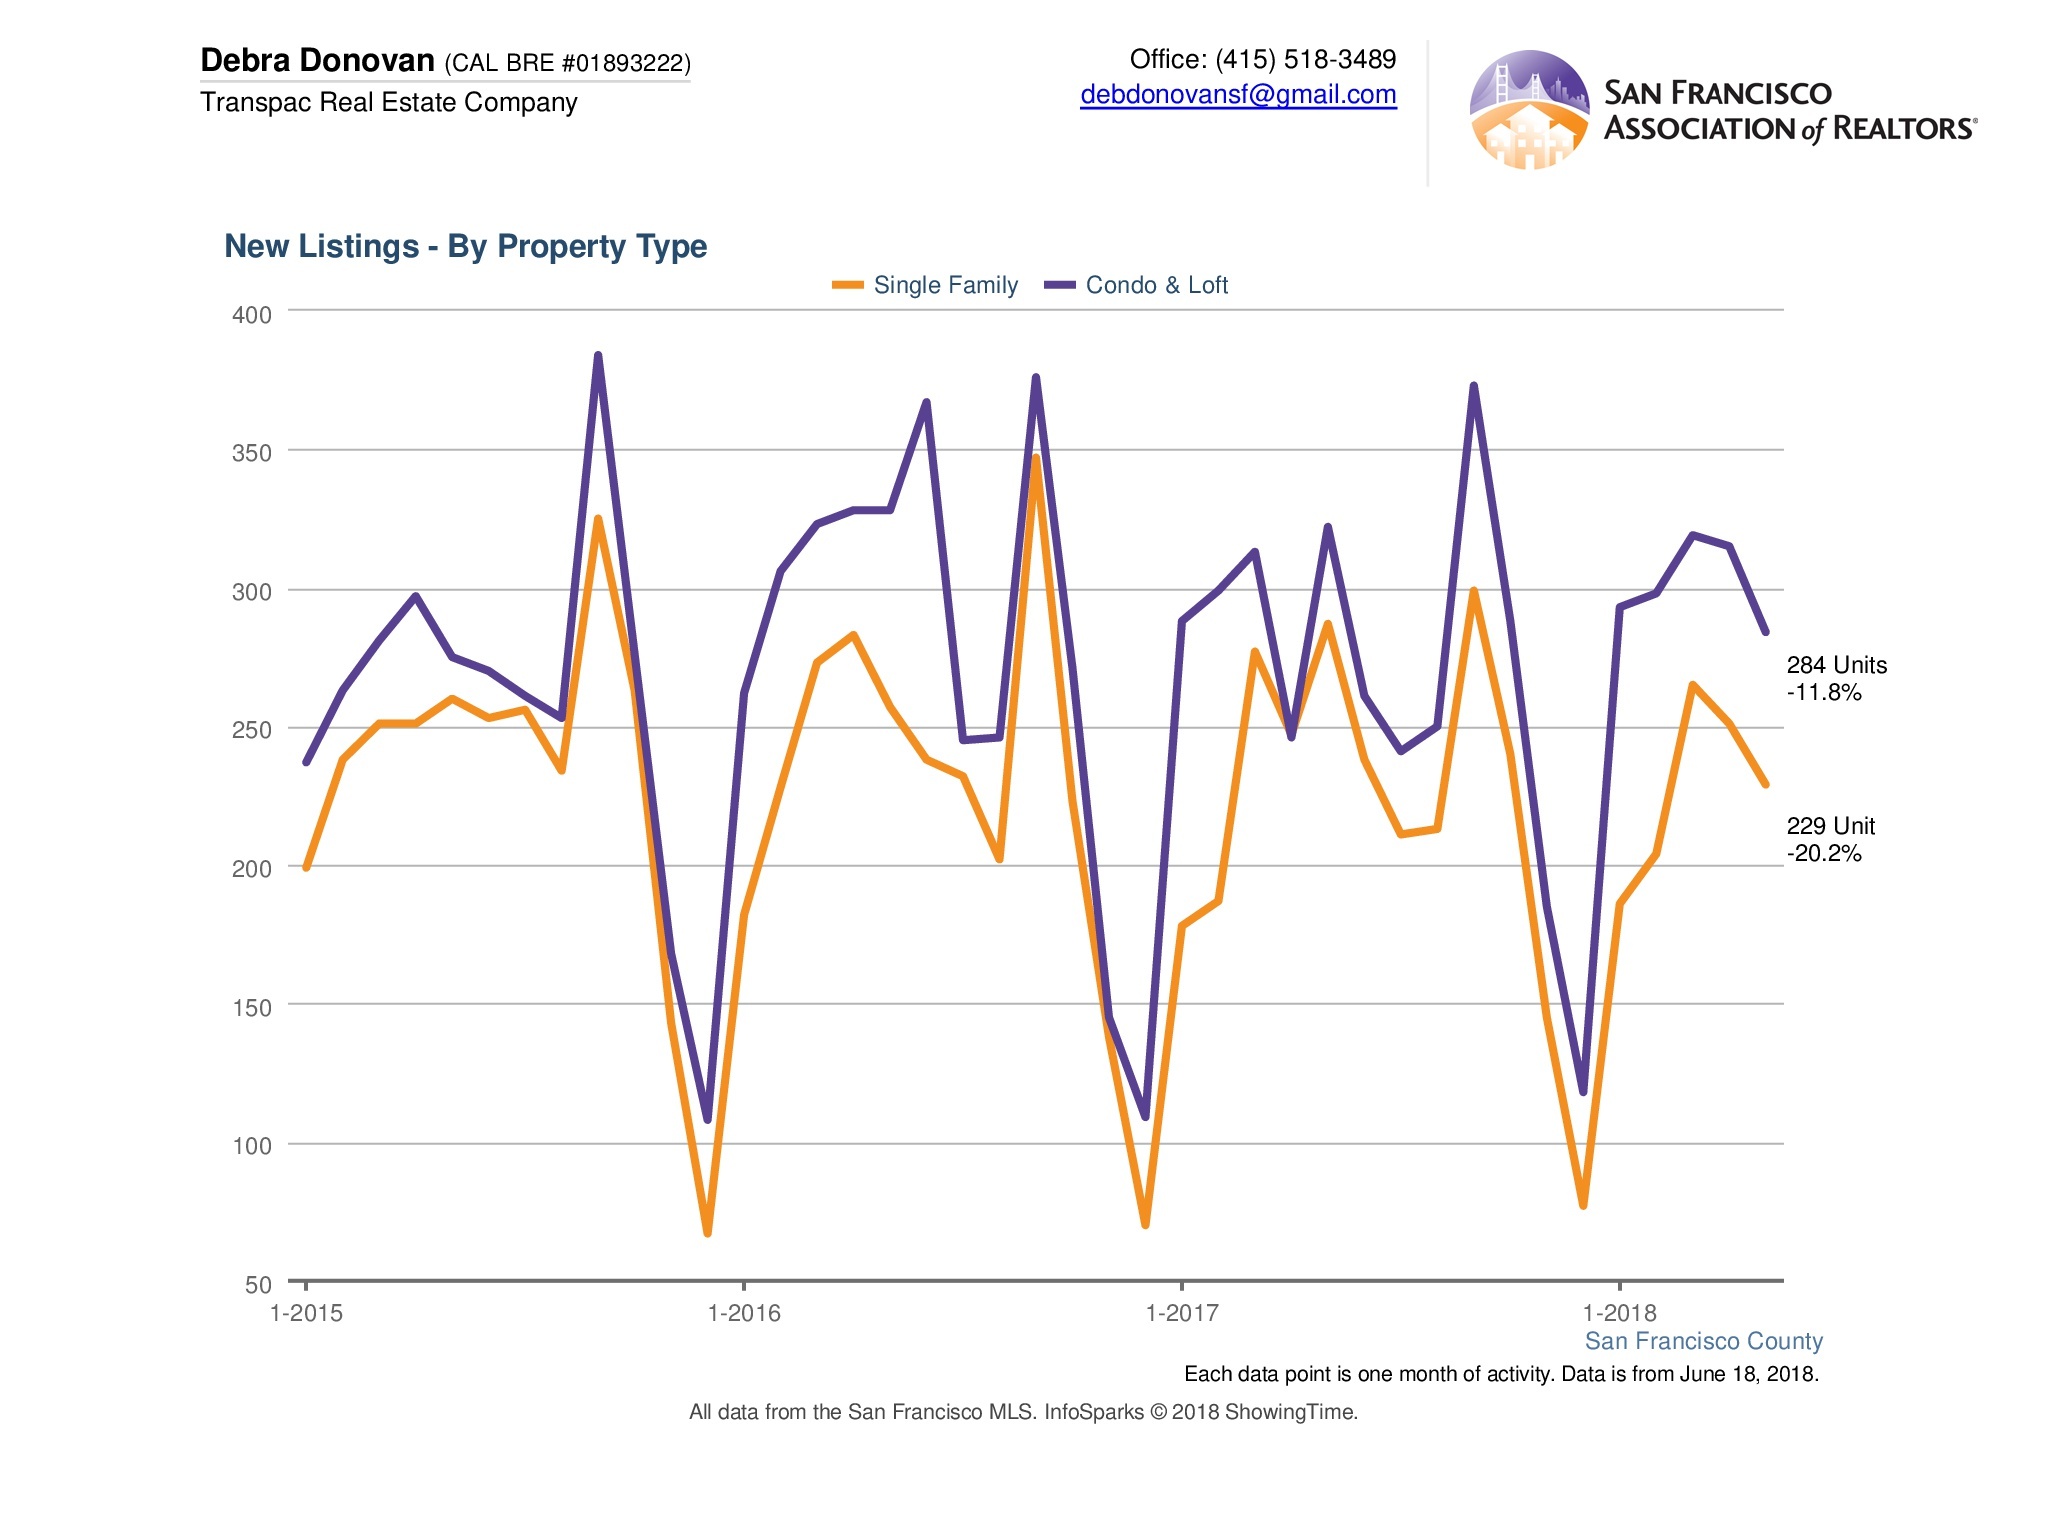
New single family home listings were down 20% compared to May of last year, and also down slightly compared to last month. Only 229 listings came to market in May. Condos and loft new inventory was also down compared to last month, and down almost 12% compared to last year with only 284 new listings for the month. Again as a reminder, this typically does not include new construction projects, which are typically not listed in the MLS. Those new projects, though, do impact overall sales for existing condos and lofts.
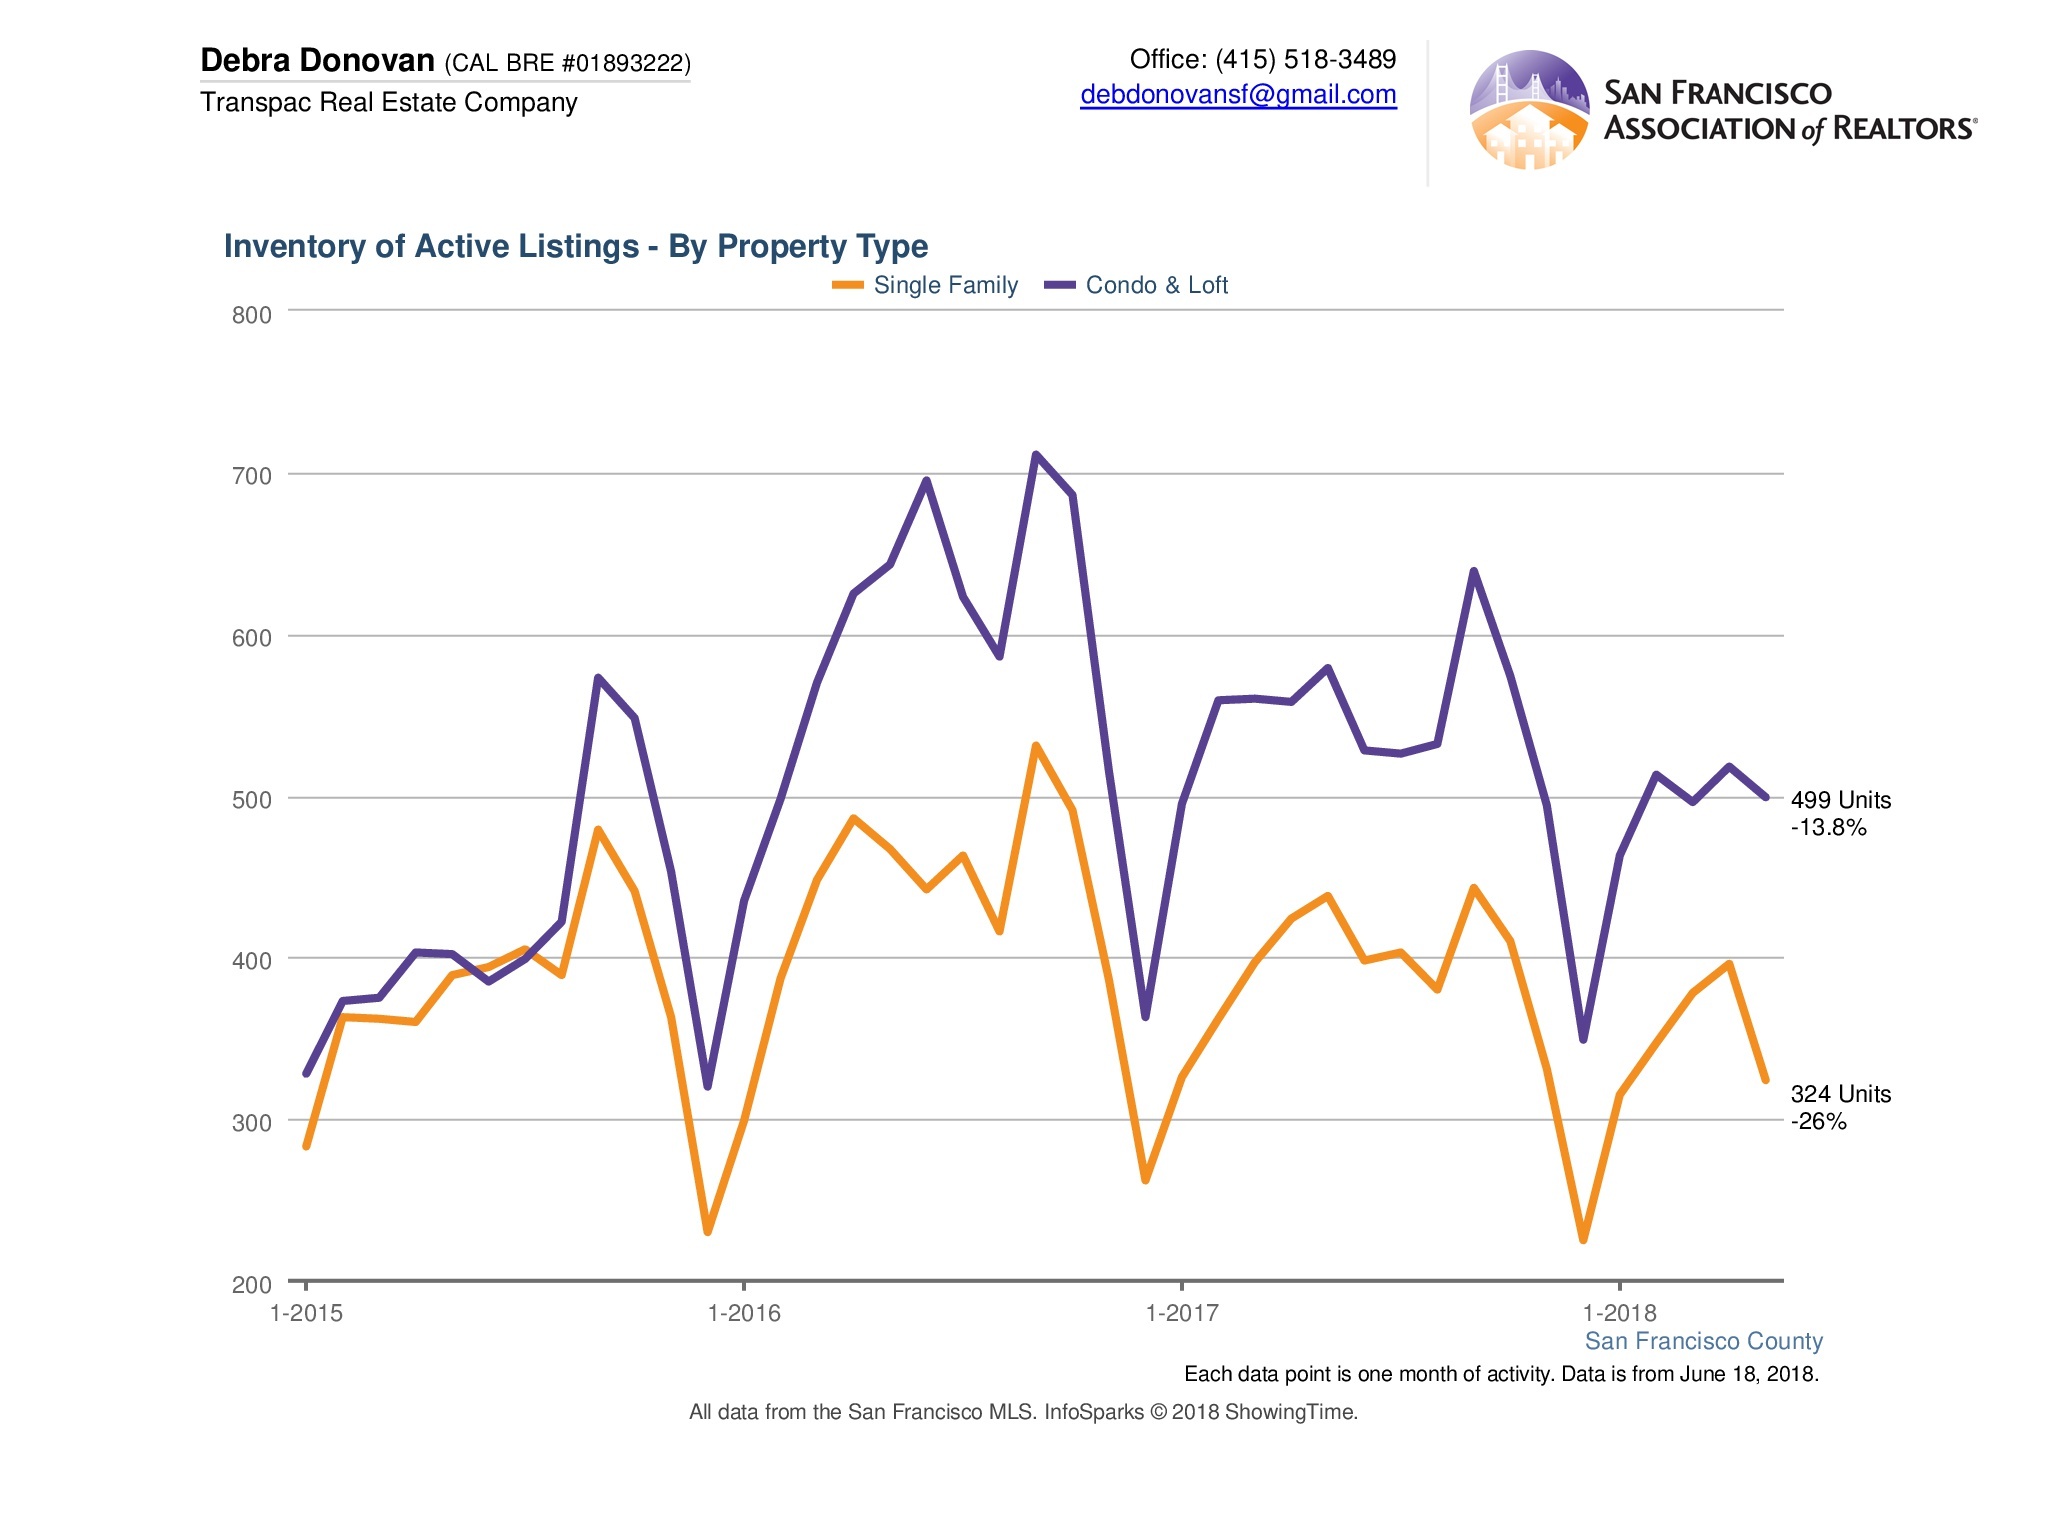
Active Listings:
Active listings are the number of properties available for sale in active status at the end of a given month. In May, there were just 324 homes actively for sale by month’s end, down 26% compared to the same month last year. There were just under 500 condo and loft listings available, representing an almost 14% decrease compared to May 2017.
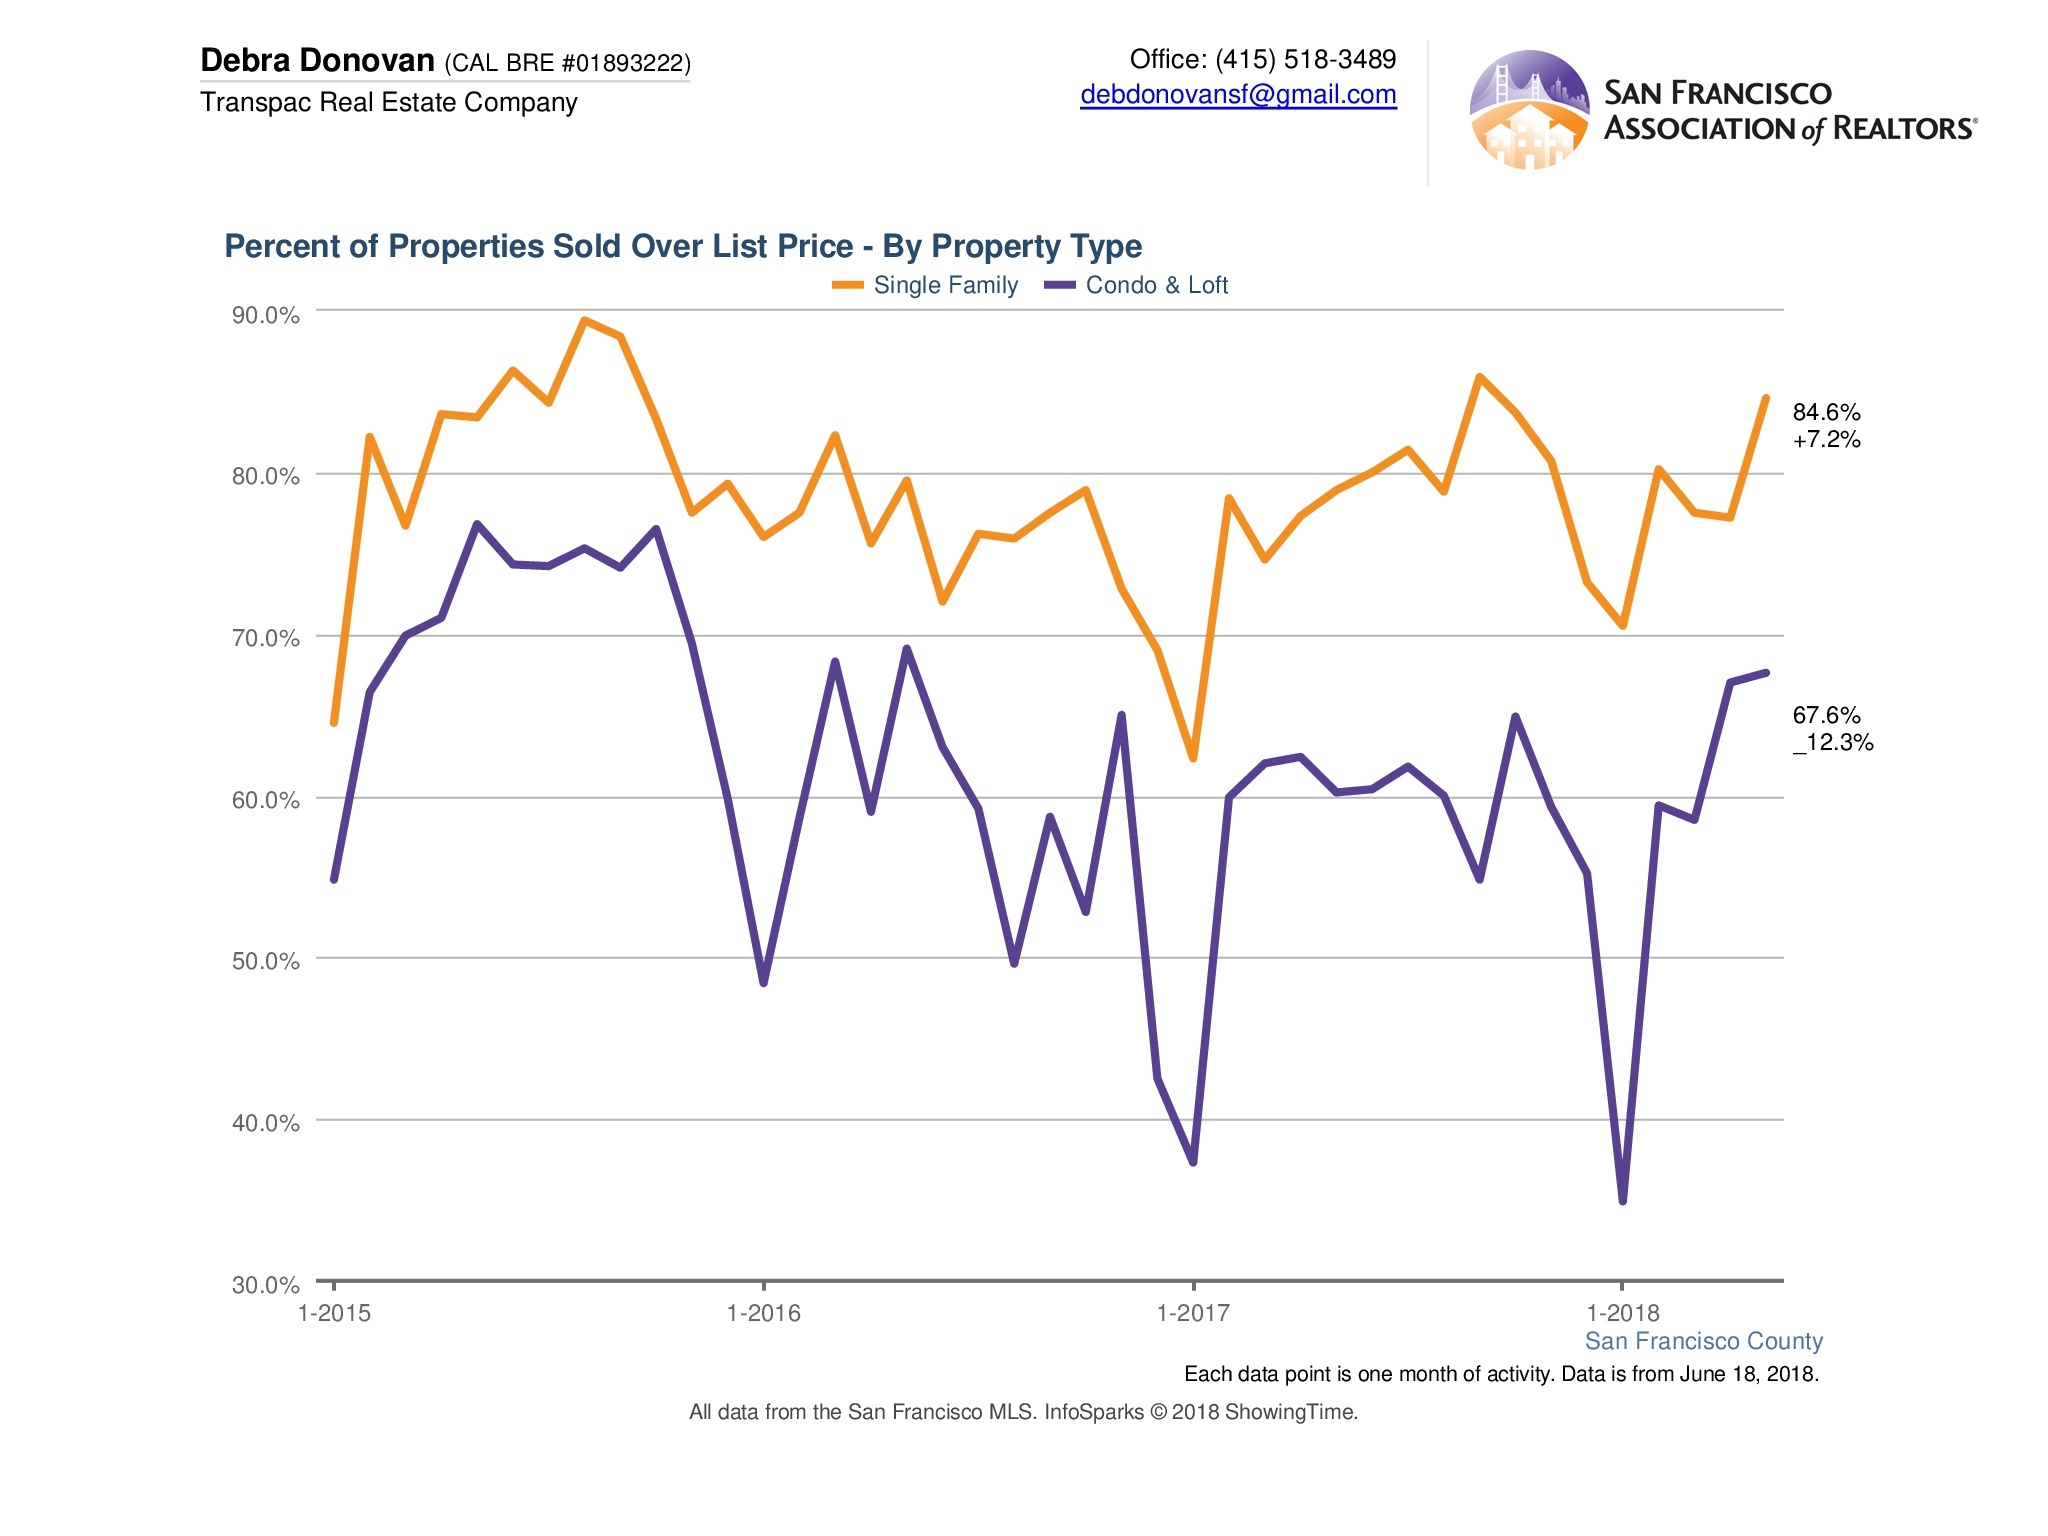
Percentage of Properties Sold Over List Price:
Further proof that demand continues to outstrip supply, almost 85% of single family homes sold for over the asking price in May. This was up over 7% compared to the same time last year, and the highest it’s been since September 2017. About 68% of condos and lofts sold for over their asking price, up more than 12% compared to last year and the highest percentage since May 2016.
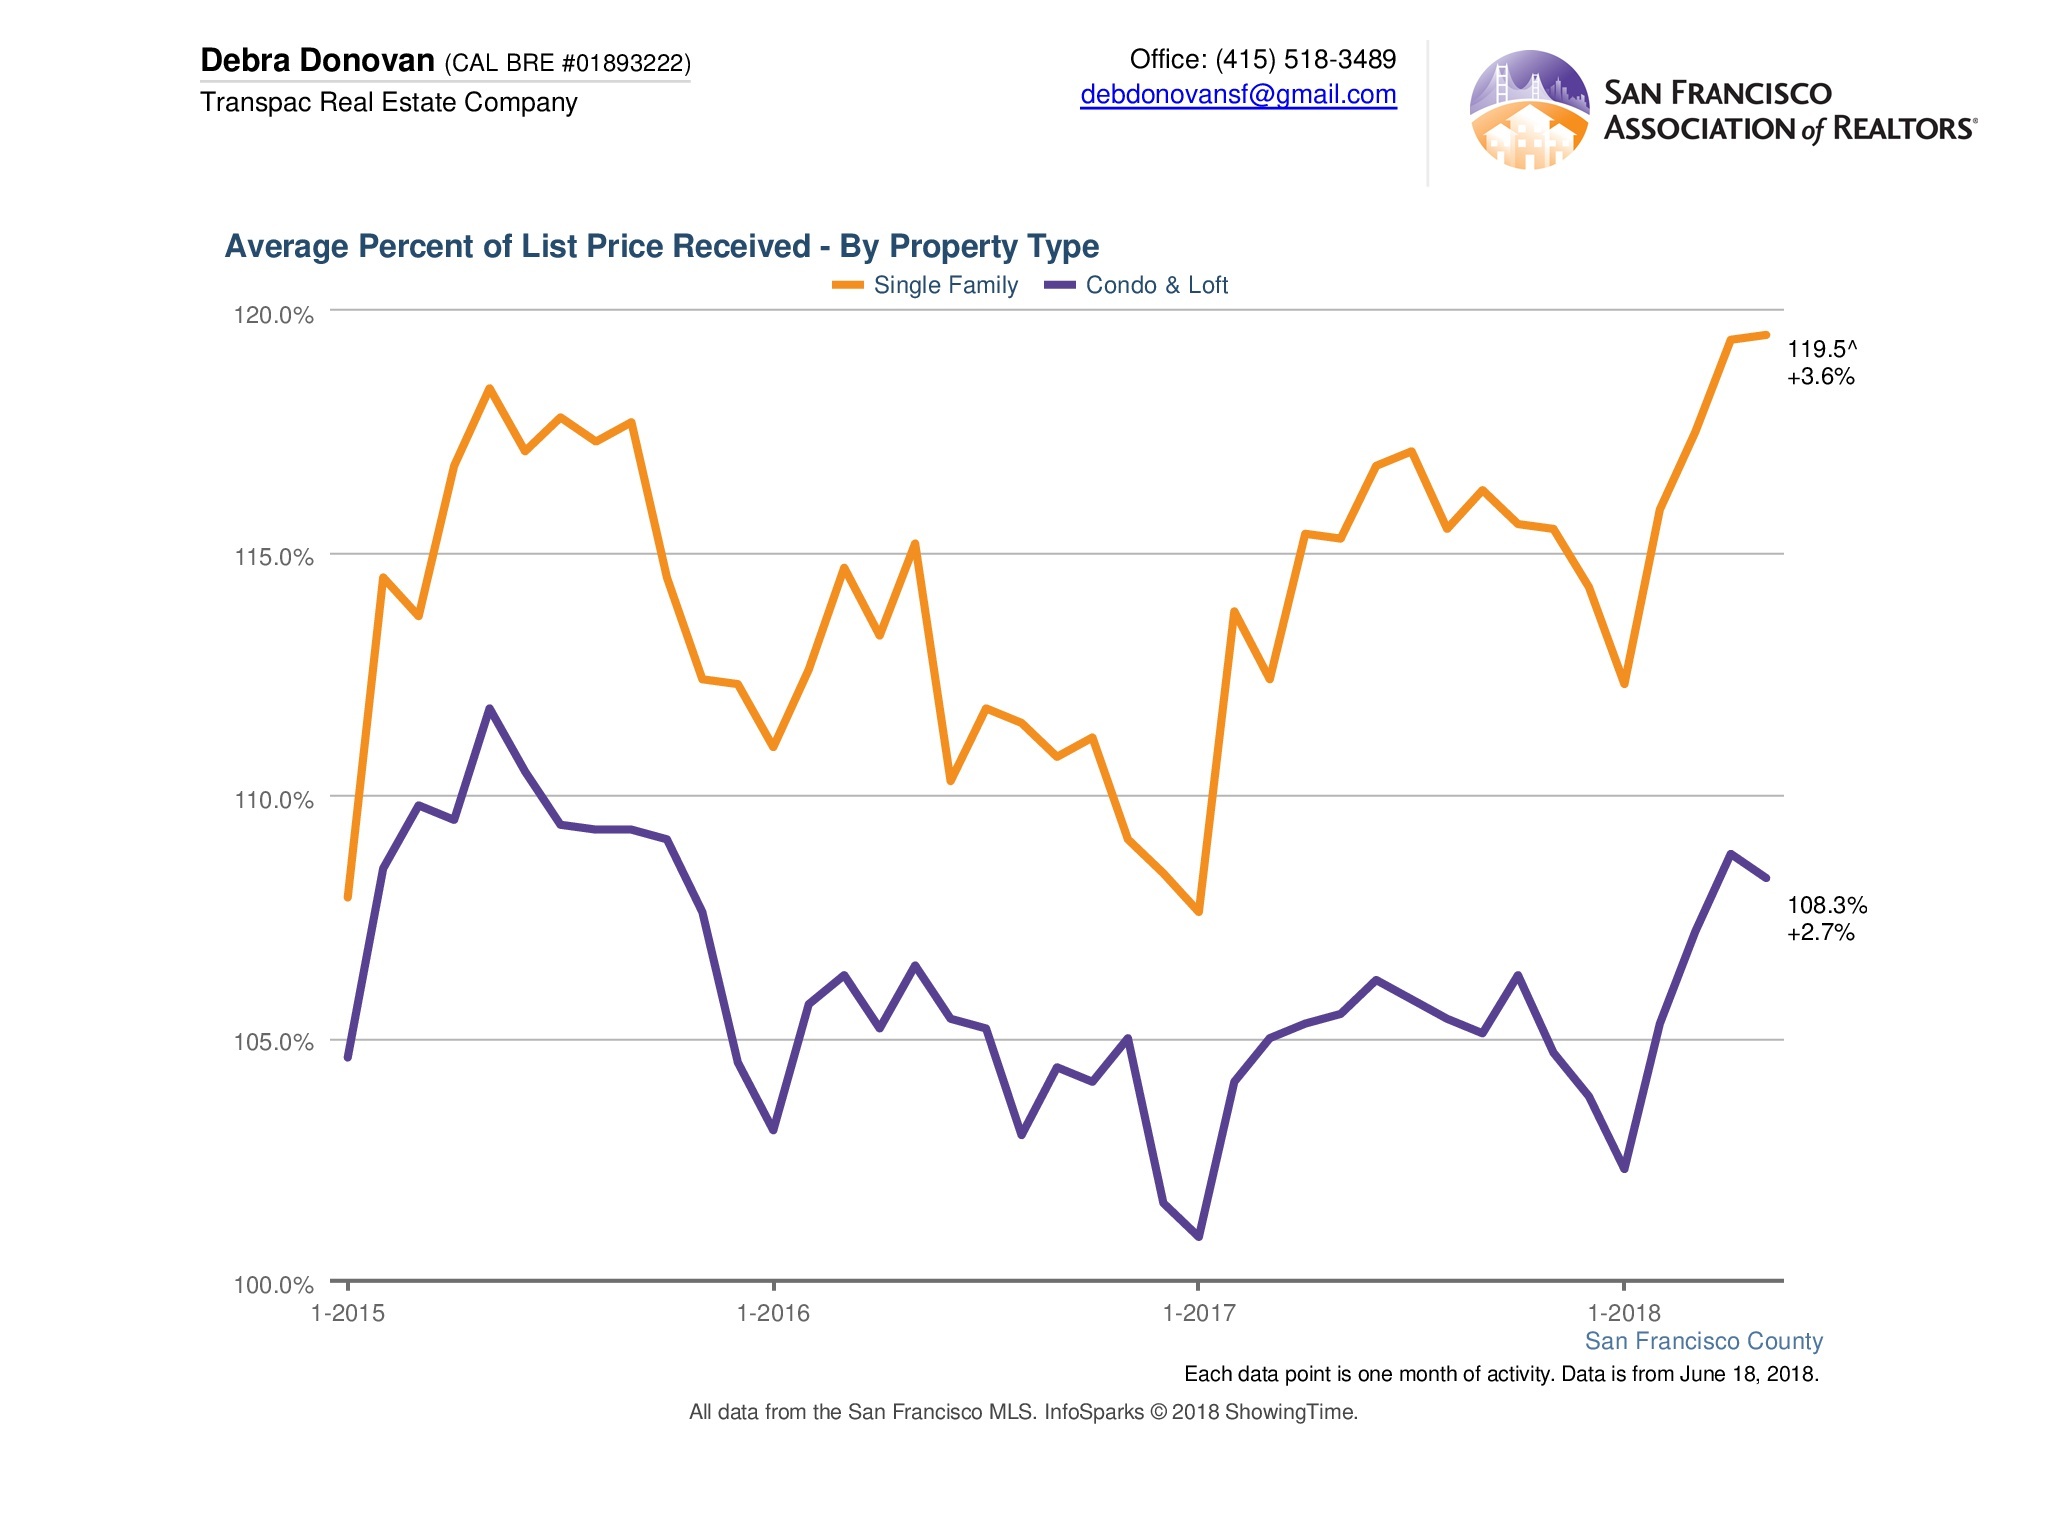
Average Percentage of List Price Received:
The average percentage of list price received remained steady for both single family homes and condos and lofts in May. Single family homes sold for an average of 119.5% over their list price, up 3.6% compared to May of last year. Condos and lofts sold for 108.3% over list, up 2.7% compared to last year.
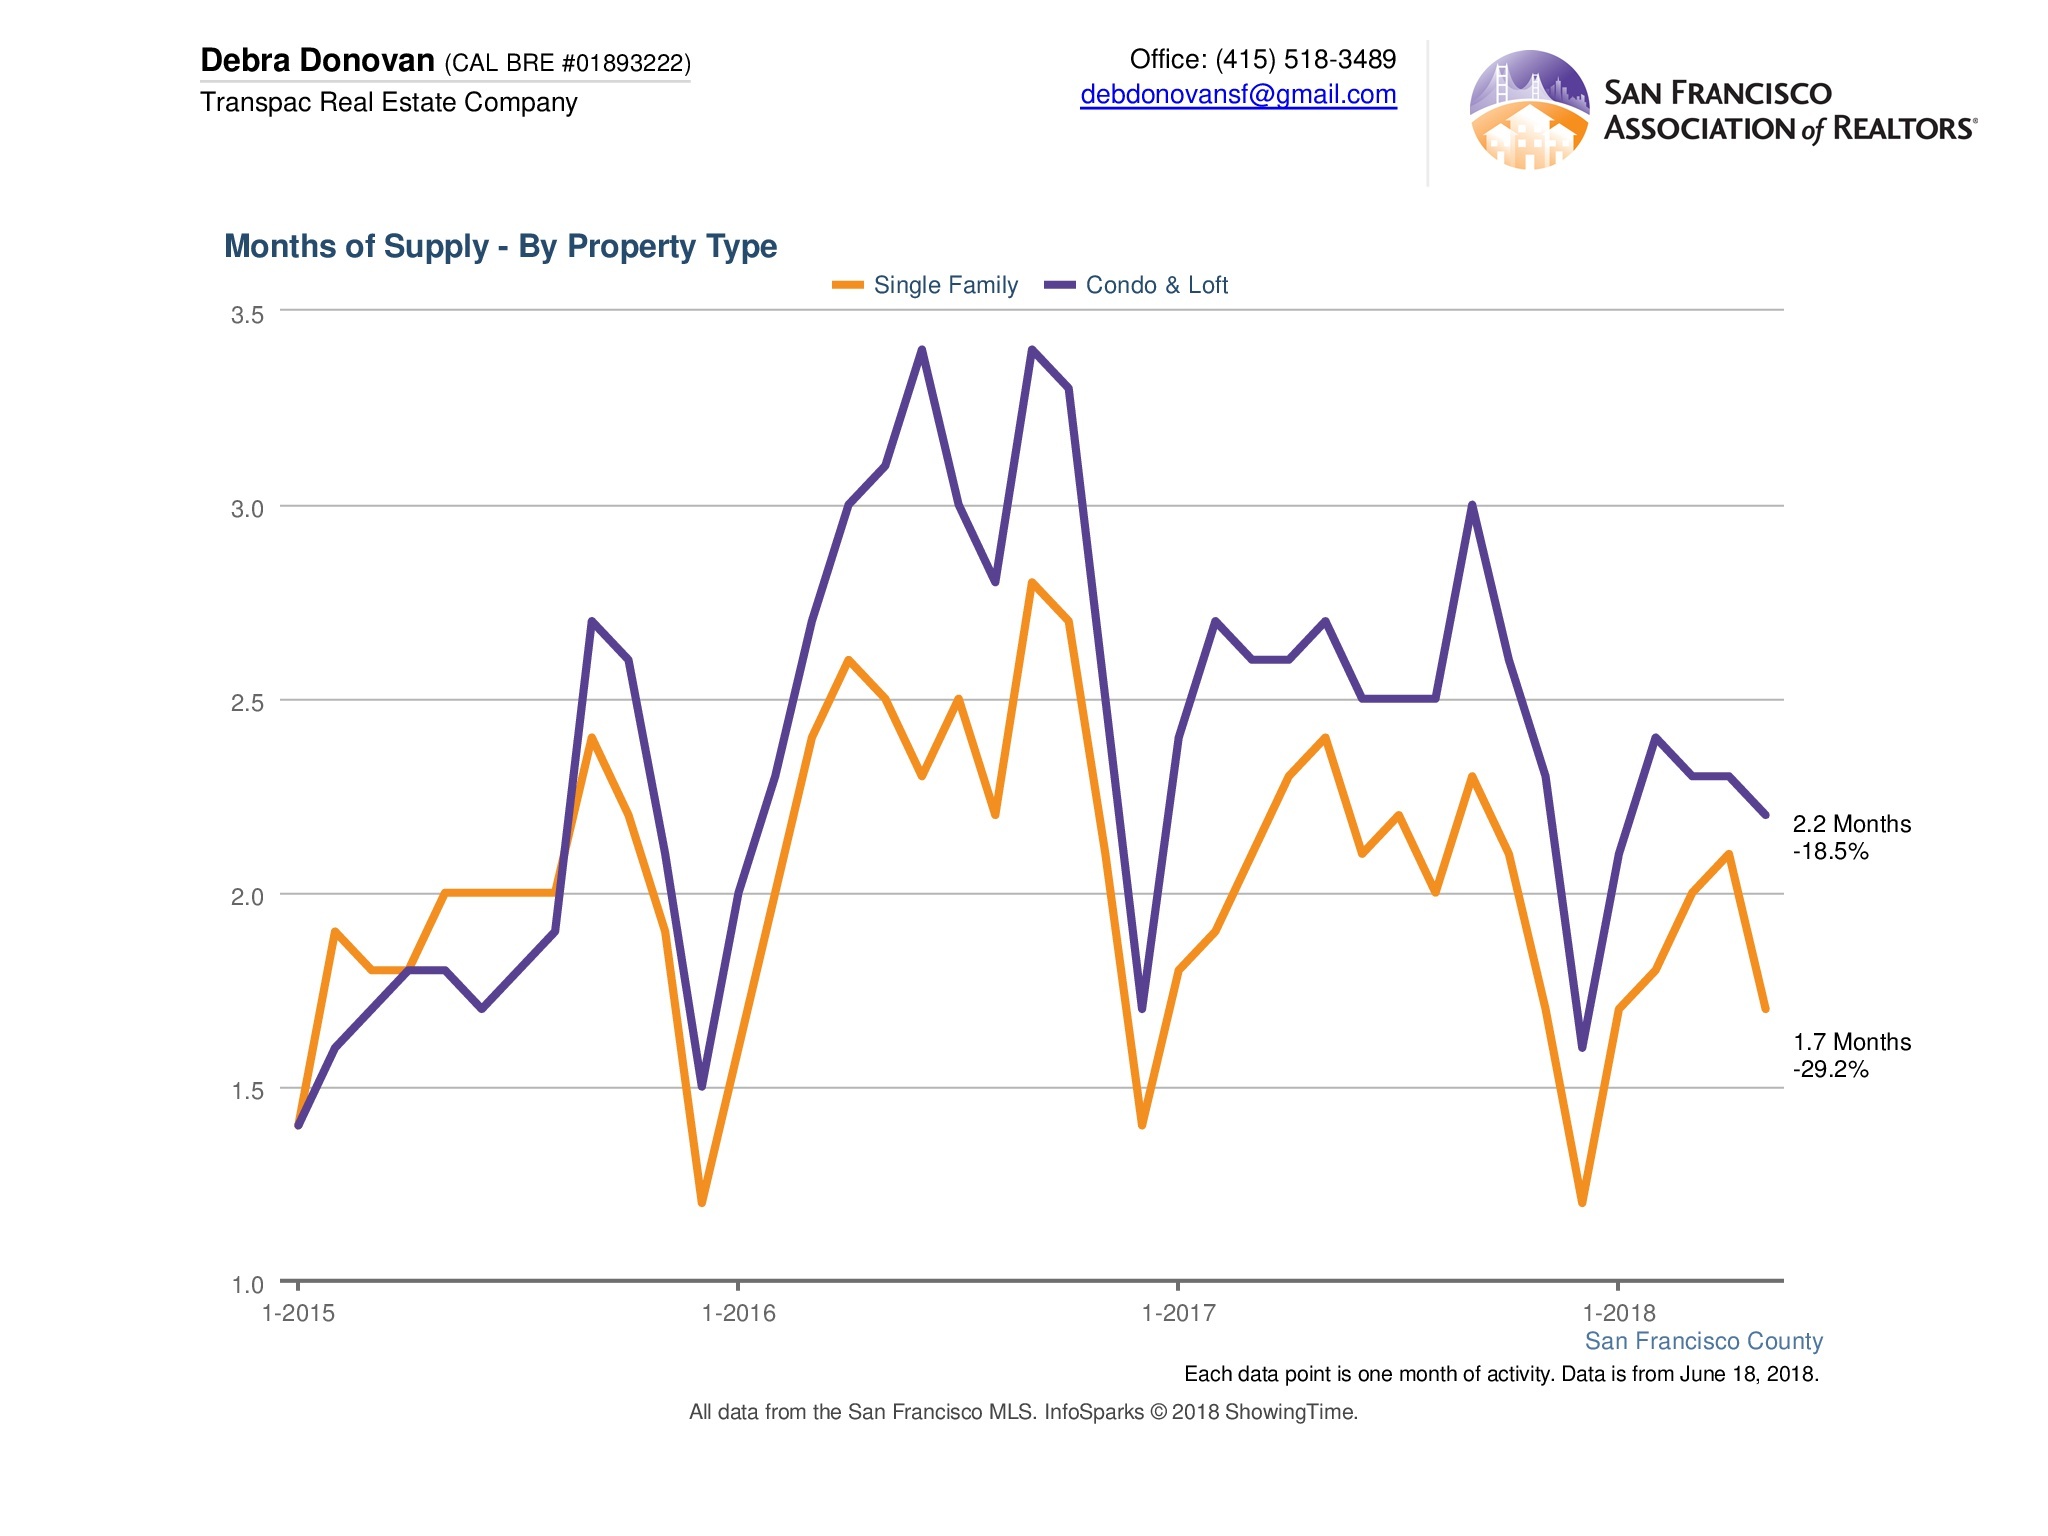
Months Supply of Inventory:
Also called MSI, this is the rate at which homes on the market are being absorbed. For example, if there are 50 homes on the market and 10 homes selling each month, there is a 5 month supply of inventory (wouldn’t that be nice!). Last month, there was a 1.7 month supply of single family homes, down 29% from last year. MSI for condos and lofts was at 2.2 months, down 18.5% compared to last May. A more balanced market would have 4-6 months of inventory, so this is just another indication of our paltry inventory.
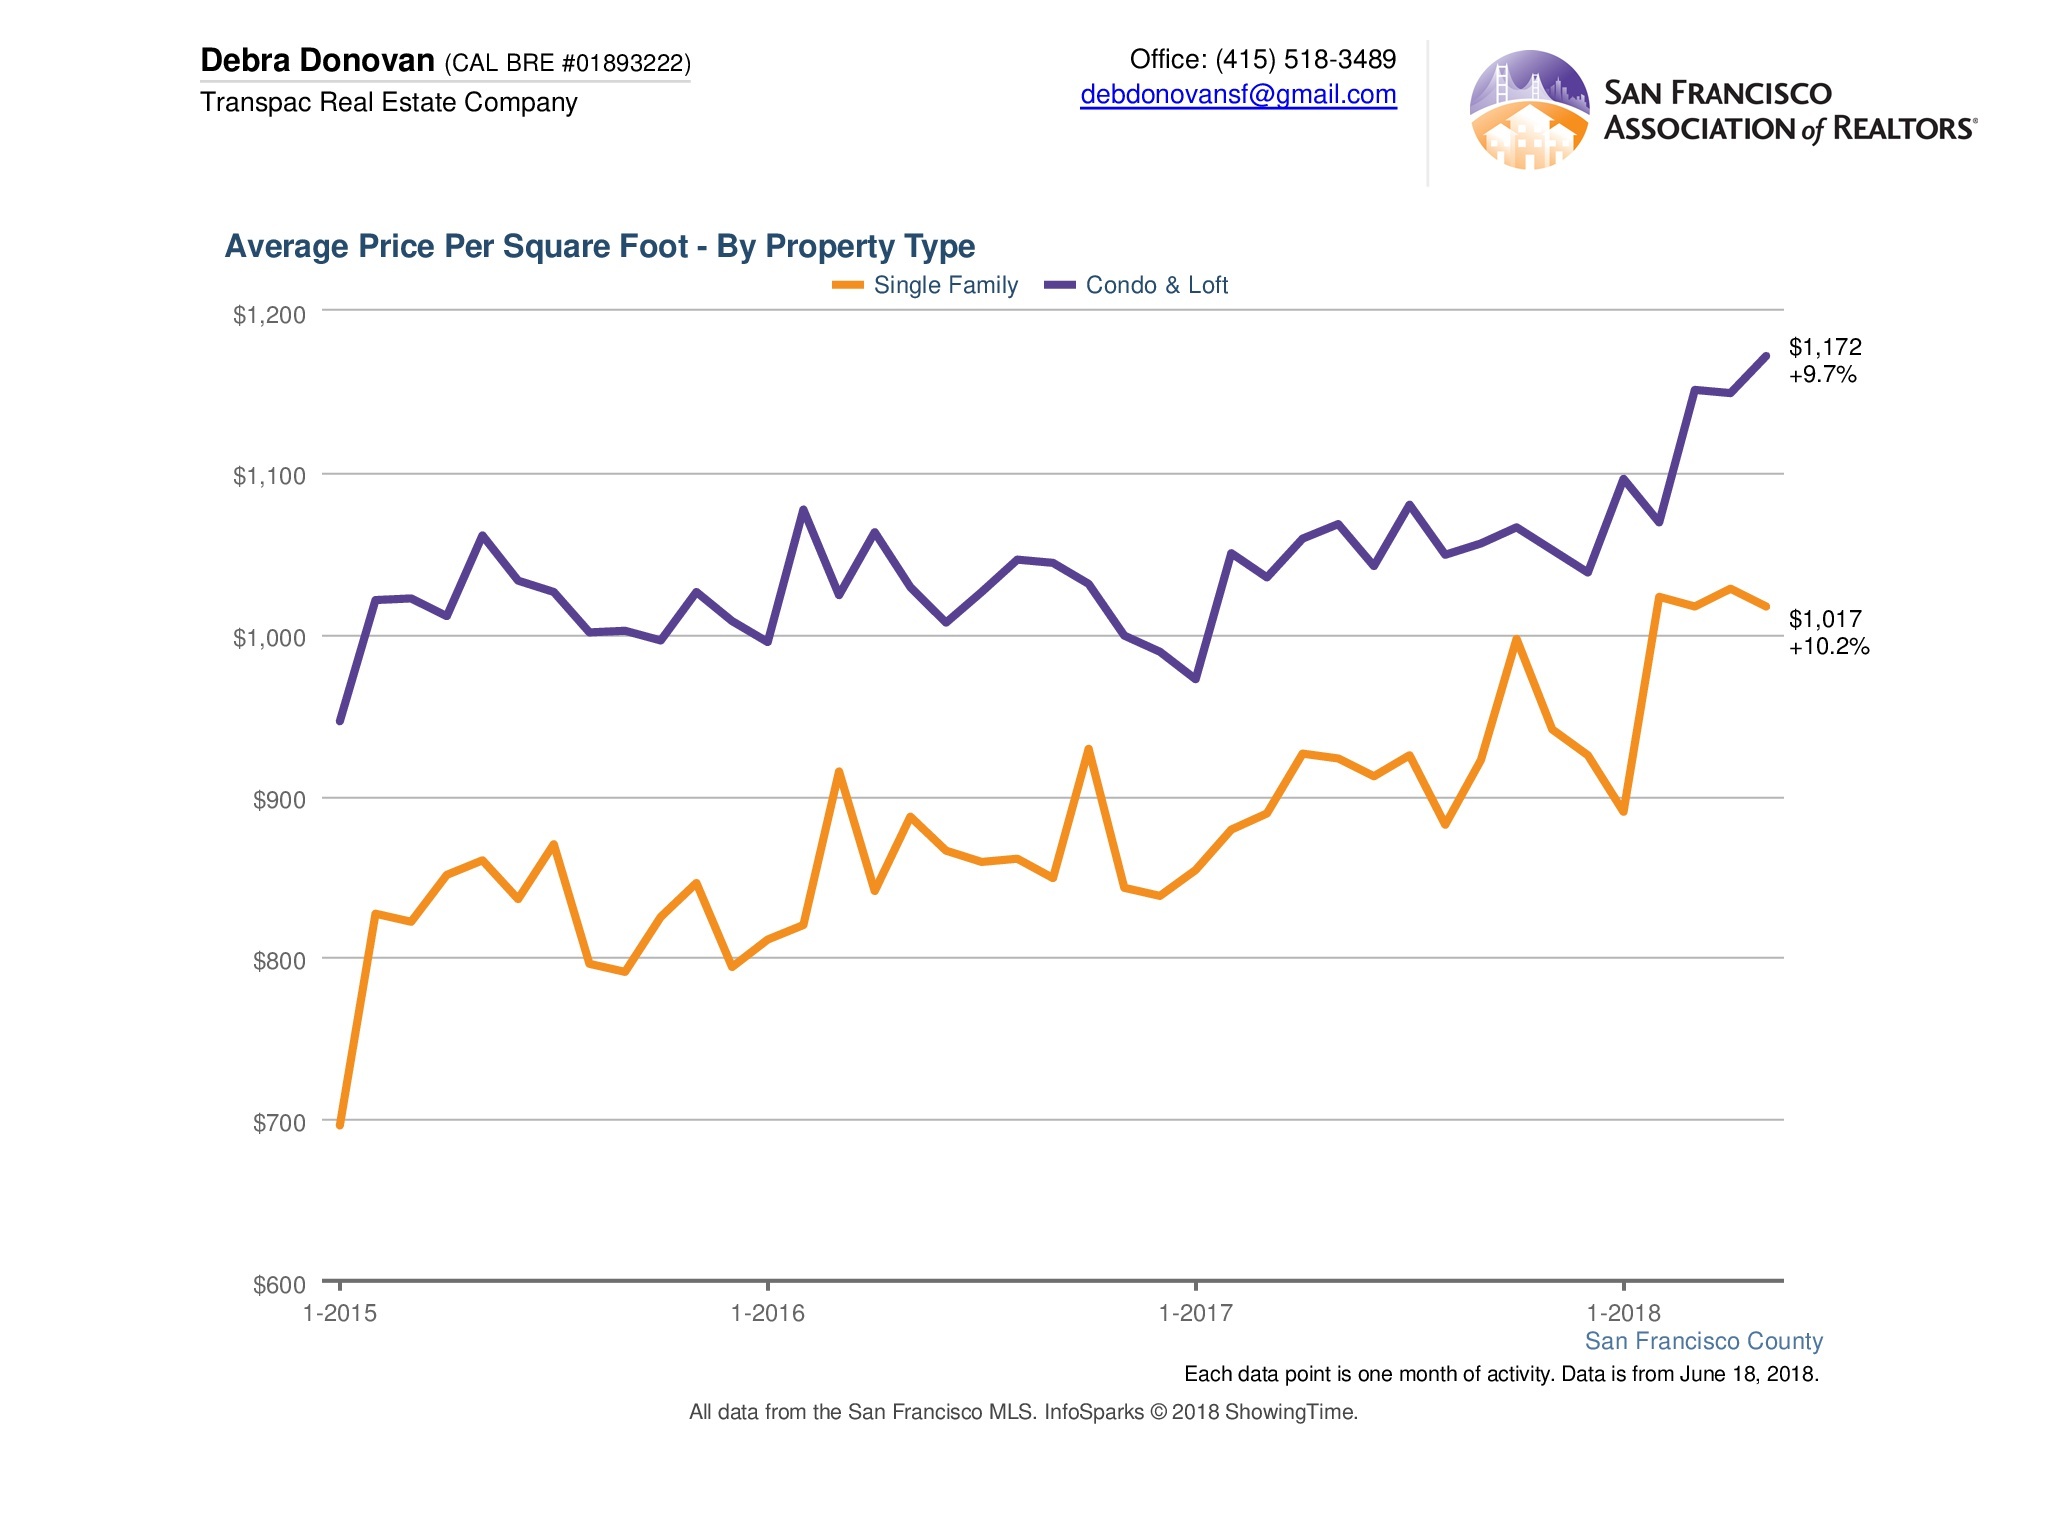
Average Price per Square Foot:
In February of this year single family homes crossed the threshold of reaching over $1,000/ square foot. It’s been hovering there ever since. In May, the average price per square foot was $1,017, up more than 10% compared to last year. Condos and lofts surpassed $1,100/ square foot in March of this year. In May the average cost per square foot was $1,149, up almost 10% compared to the same month last year.
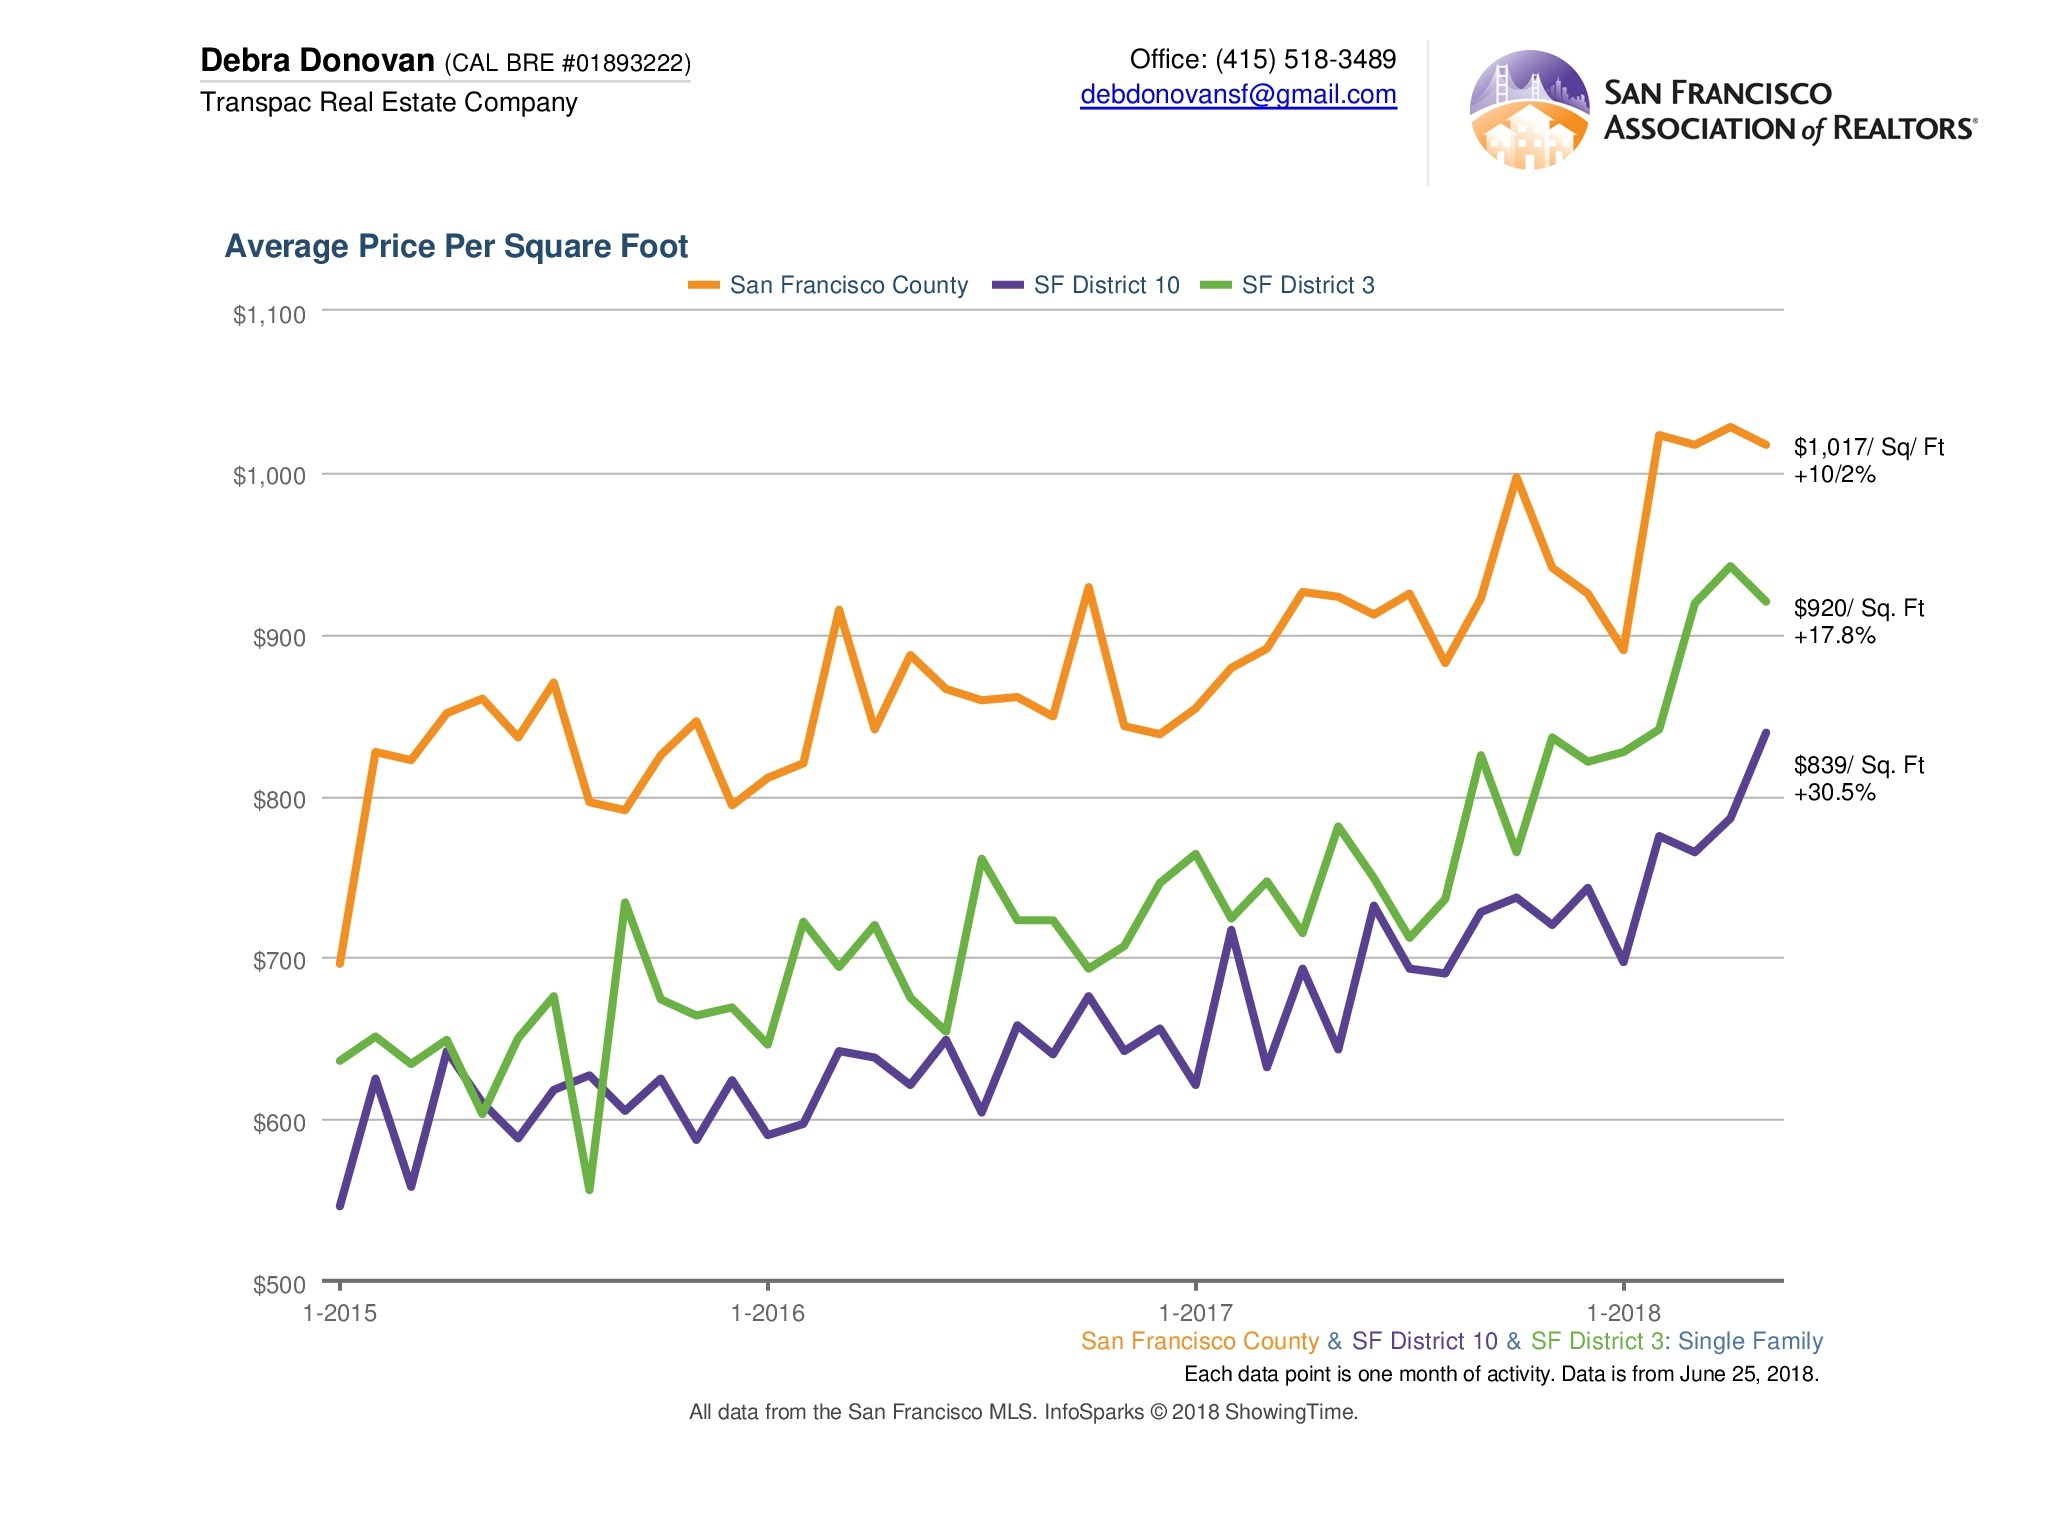
Districts with Lowest Average Cost per Square Foot for Single Family Homes:
When looking at the districts in San Francisco that have the lowest cost per square foot, I noticed an interesting, but perhaps not surprising, correlation. Districts 3 and 10 (the southwest and southeast portions of the city respectively) not only had the lowest average cost per square foot, they also saw the largest percentage of increase in May. District 3’s average cost per square foot increased 17.8% to $920/ square foot. District 10’s average cost per square foot rose a whopping 30.5% in May to $839/ square foot. As prices continue to rise, buyers are flocking to those areas of the city where you can get the most bang for your buck. As a result, those areas are seeing the largest jumps in pricing. For a look at where those districts are, click here.
Districts with Lowest Average Cost per Square Foot for Codos and Lofts:
The picture for condos and lofts plays out almost the same as for single family homes. Here, district 4 saw the largest percentage of year-over-year increase in average cost per square foot, rising 30% to $925/ square foot. District 10 saw a 16.3% increase to $733/ square foot. The only slight outlier here was district 3, which increased 3.6% compared to last May to $723/ square foot. But this was actually down compared to May, and down quite a bit compared to February. This district has a combination of older condos as well as higher end and new condos and townhomes. As with all data, one large or small sale can skew the numbers.

The fine print: All information deemed reliable but not guaranteed or warranted. Data comes from MLS so does not include off-market and most new construction condo sales. The San Francisco real estate market is dynamic so statistics can change on a daily basis. These statistics are meant to be a snapshot of the day and time they were pulled.