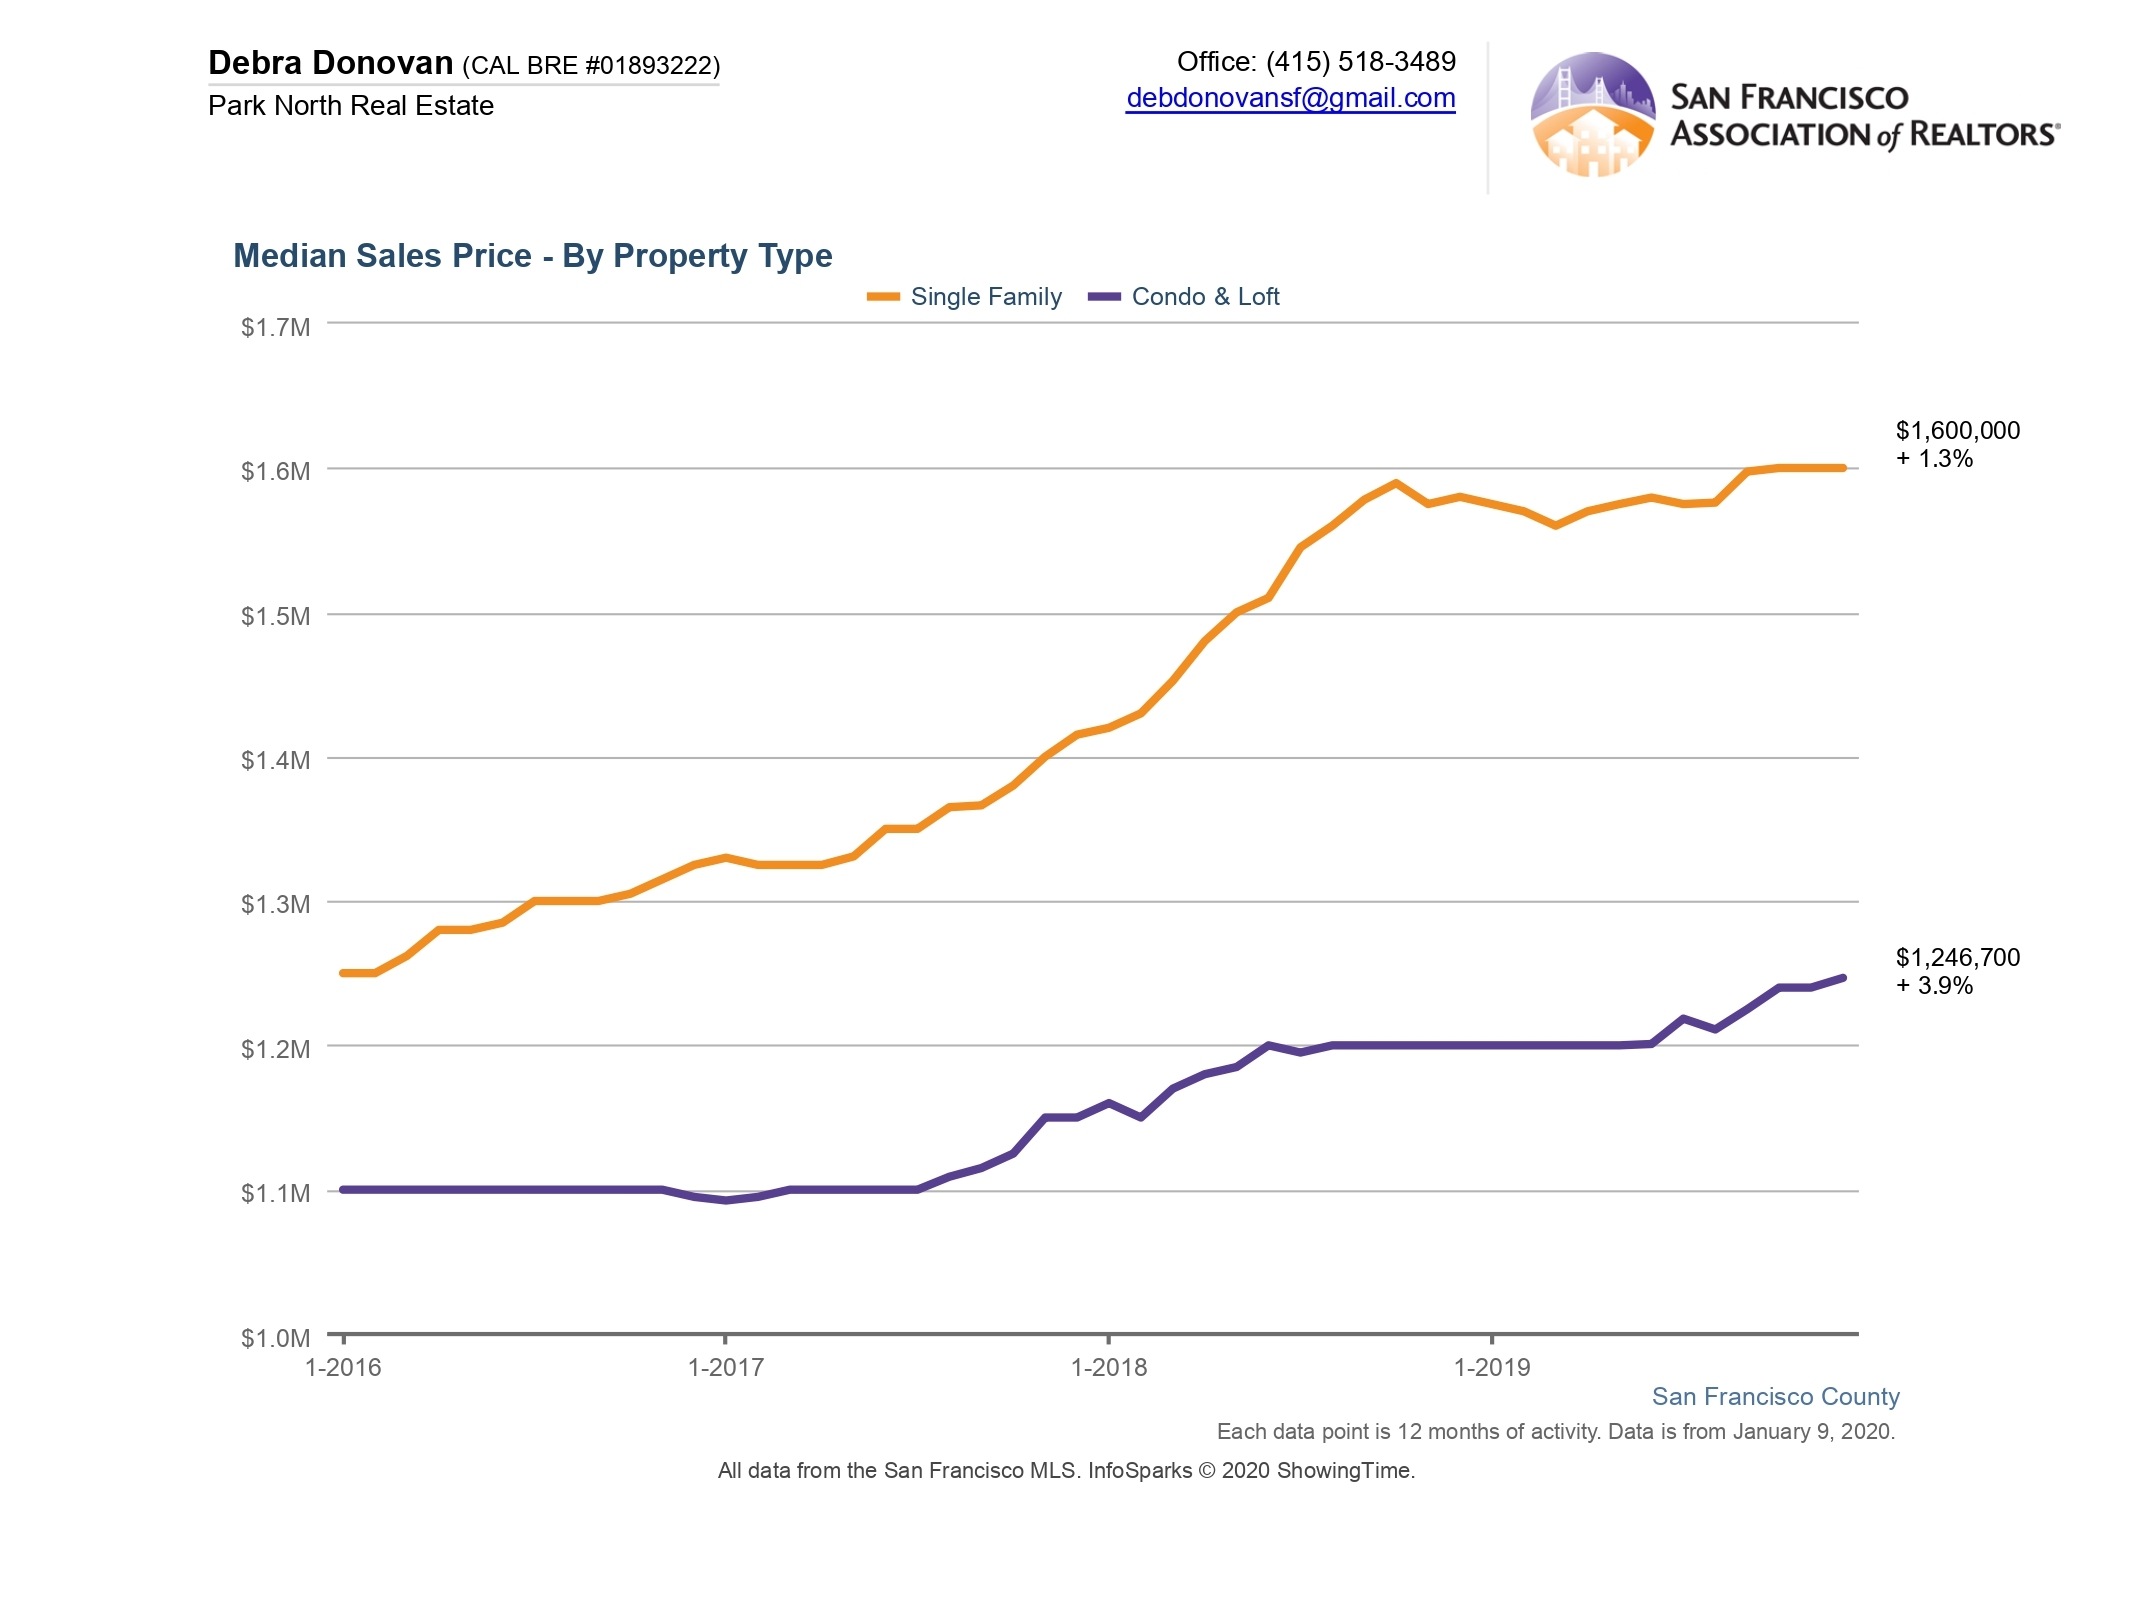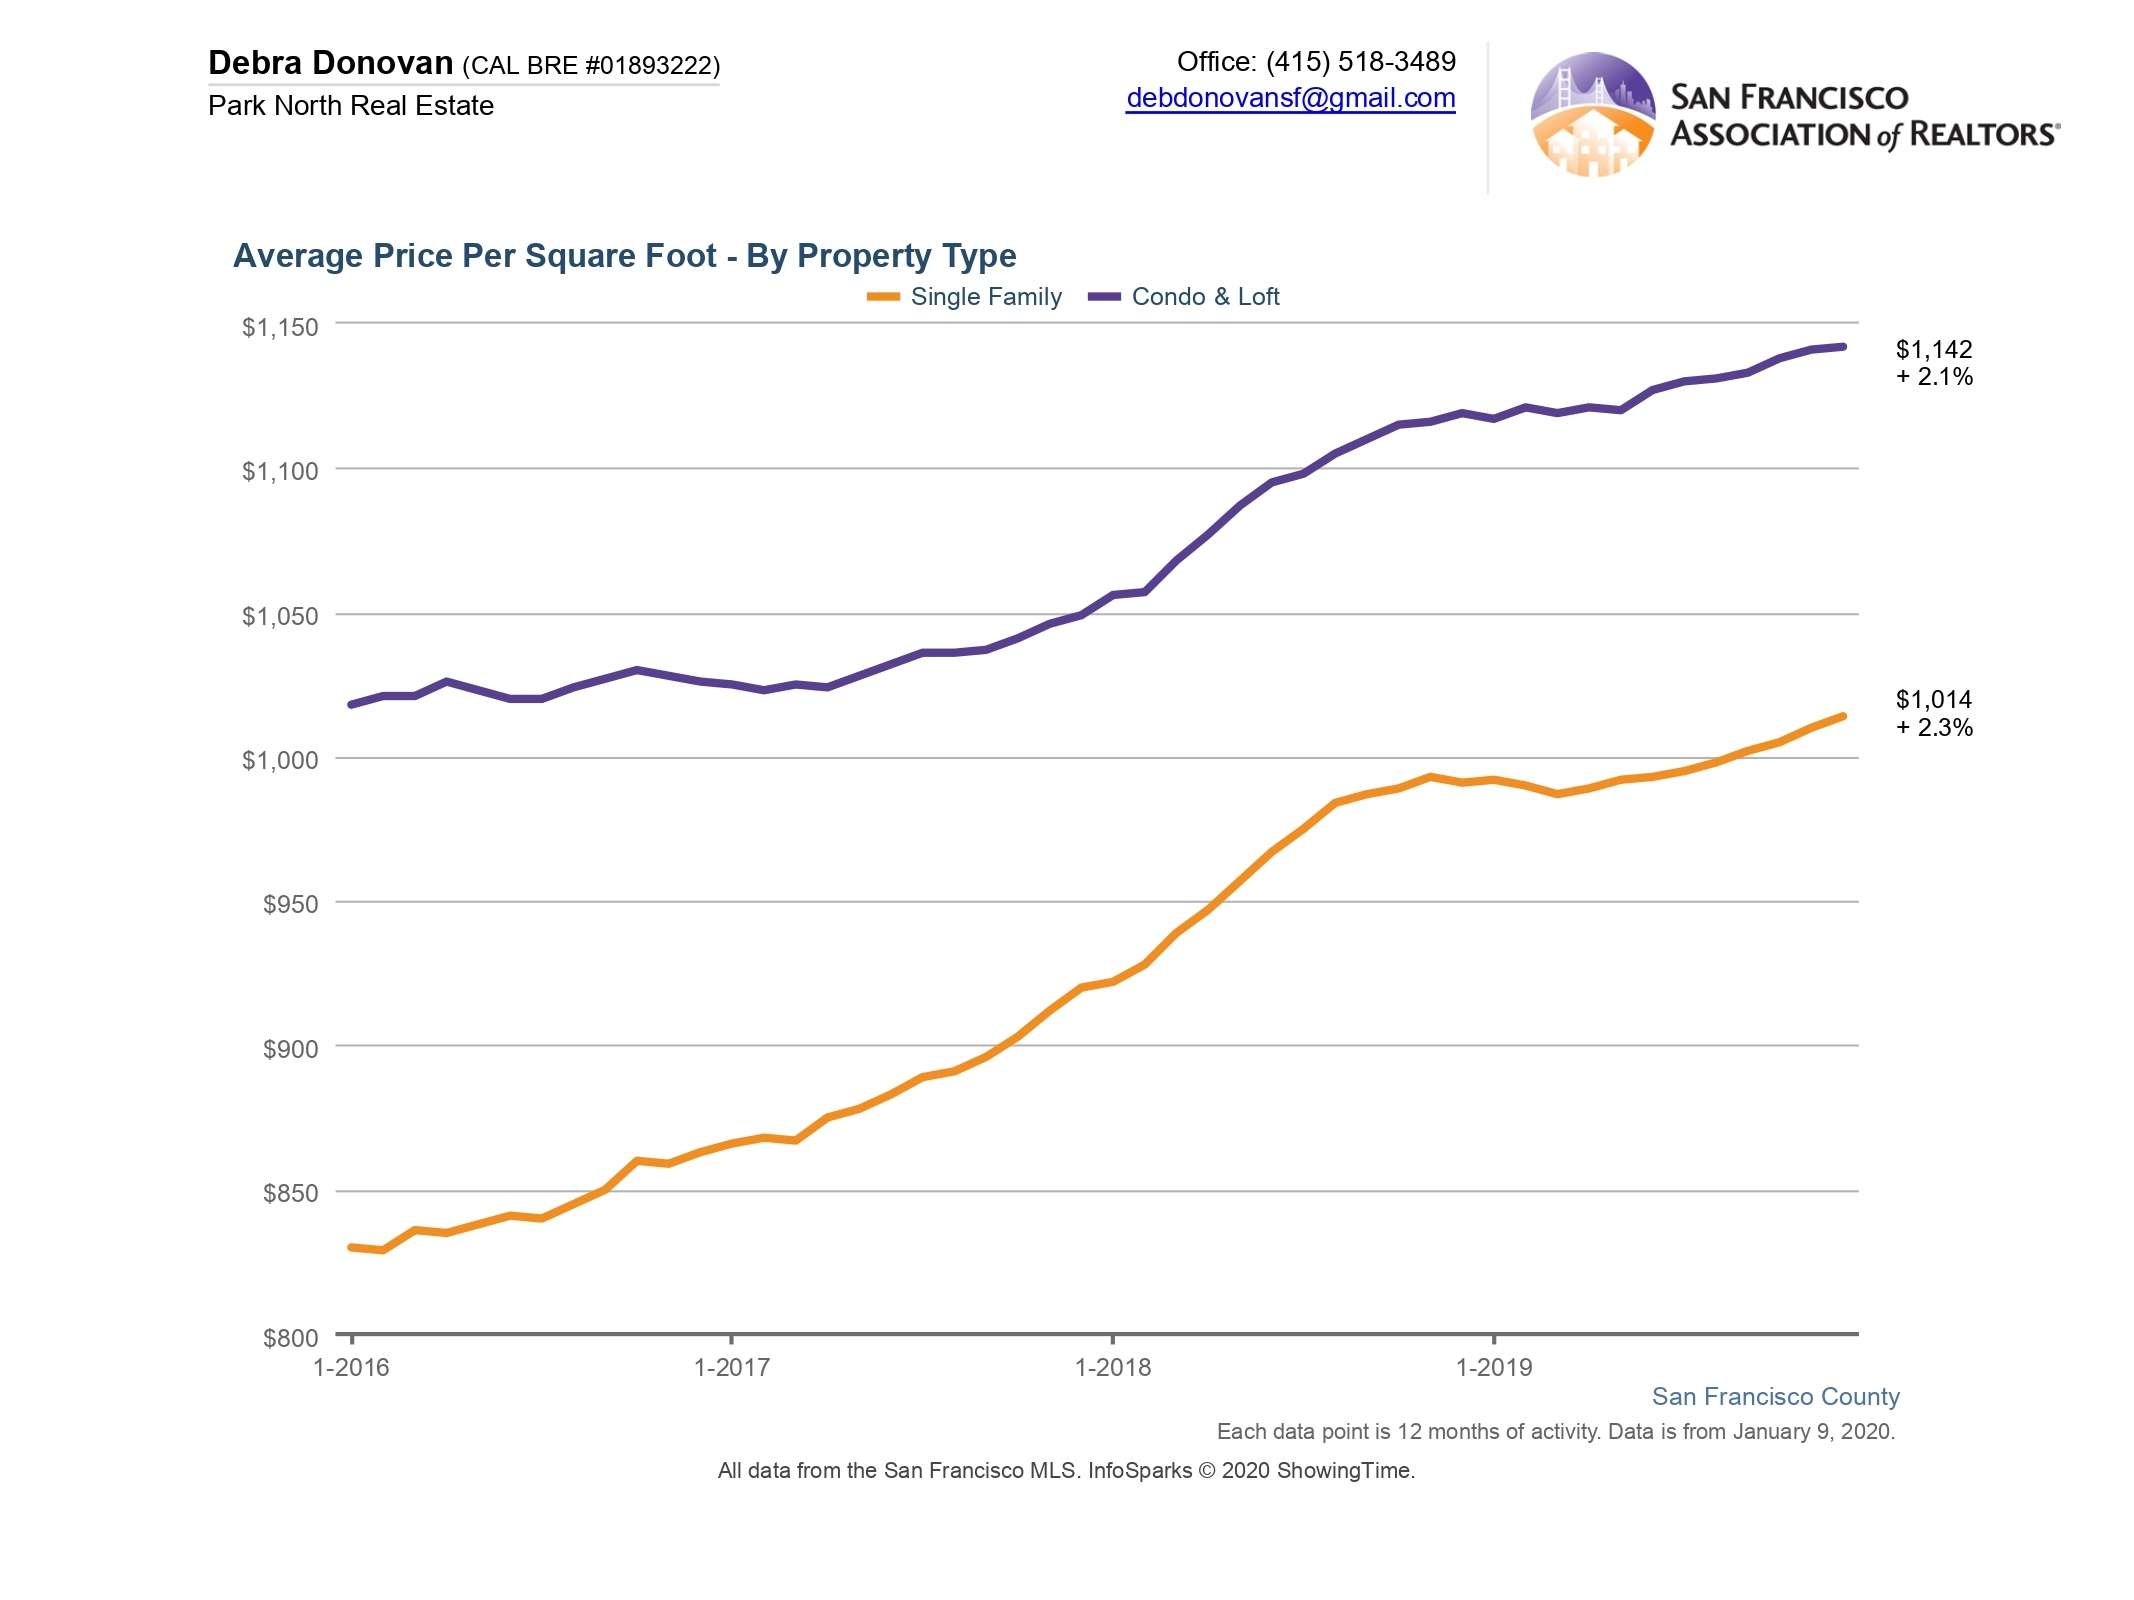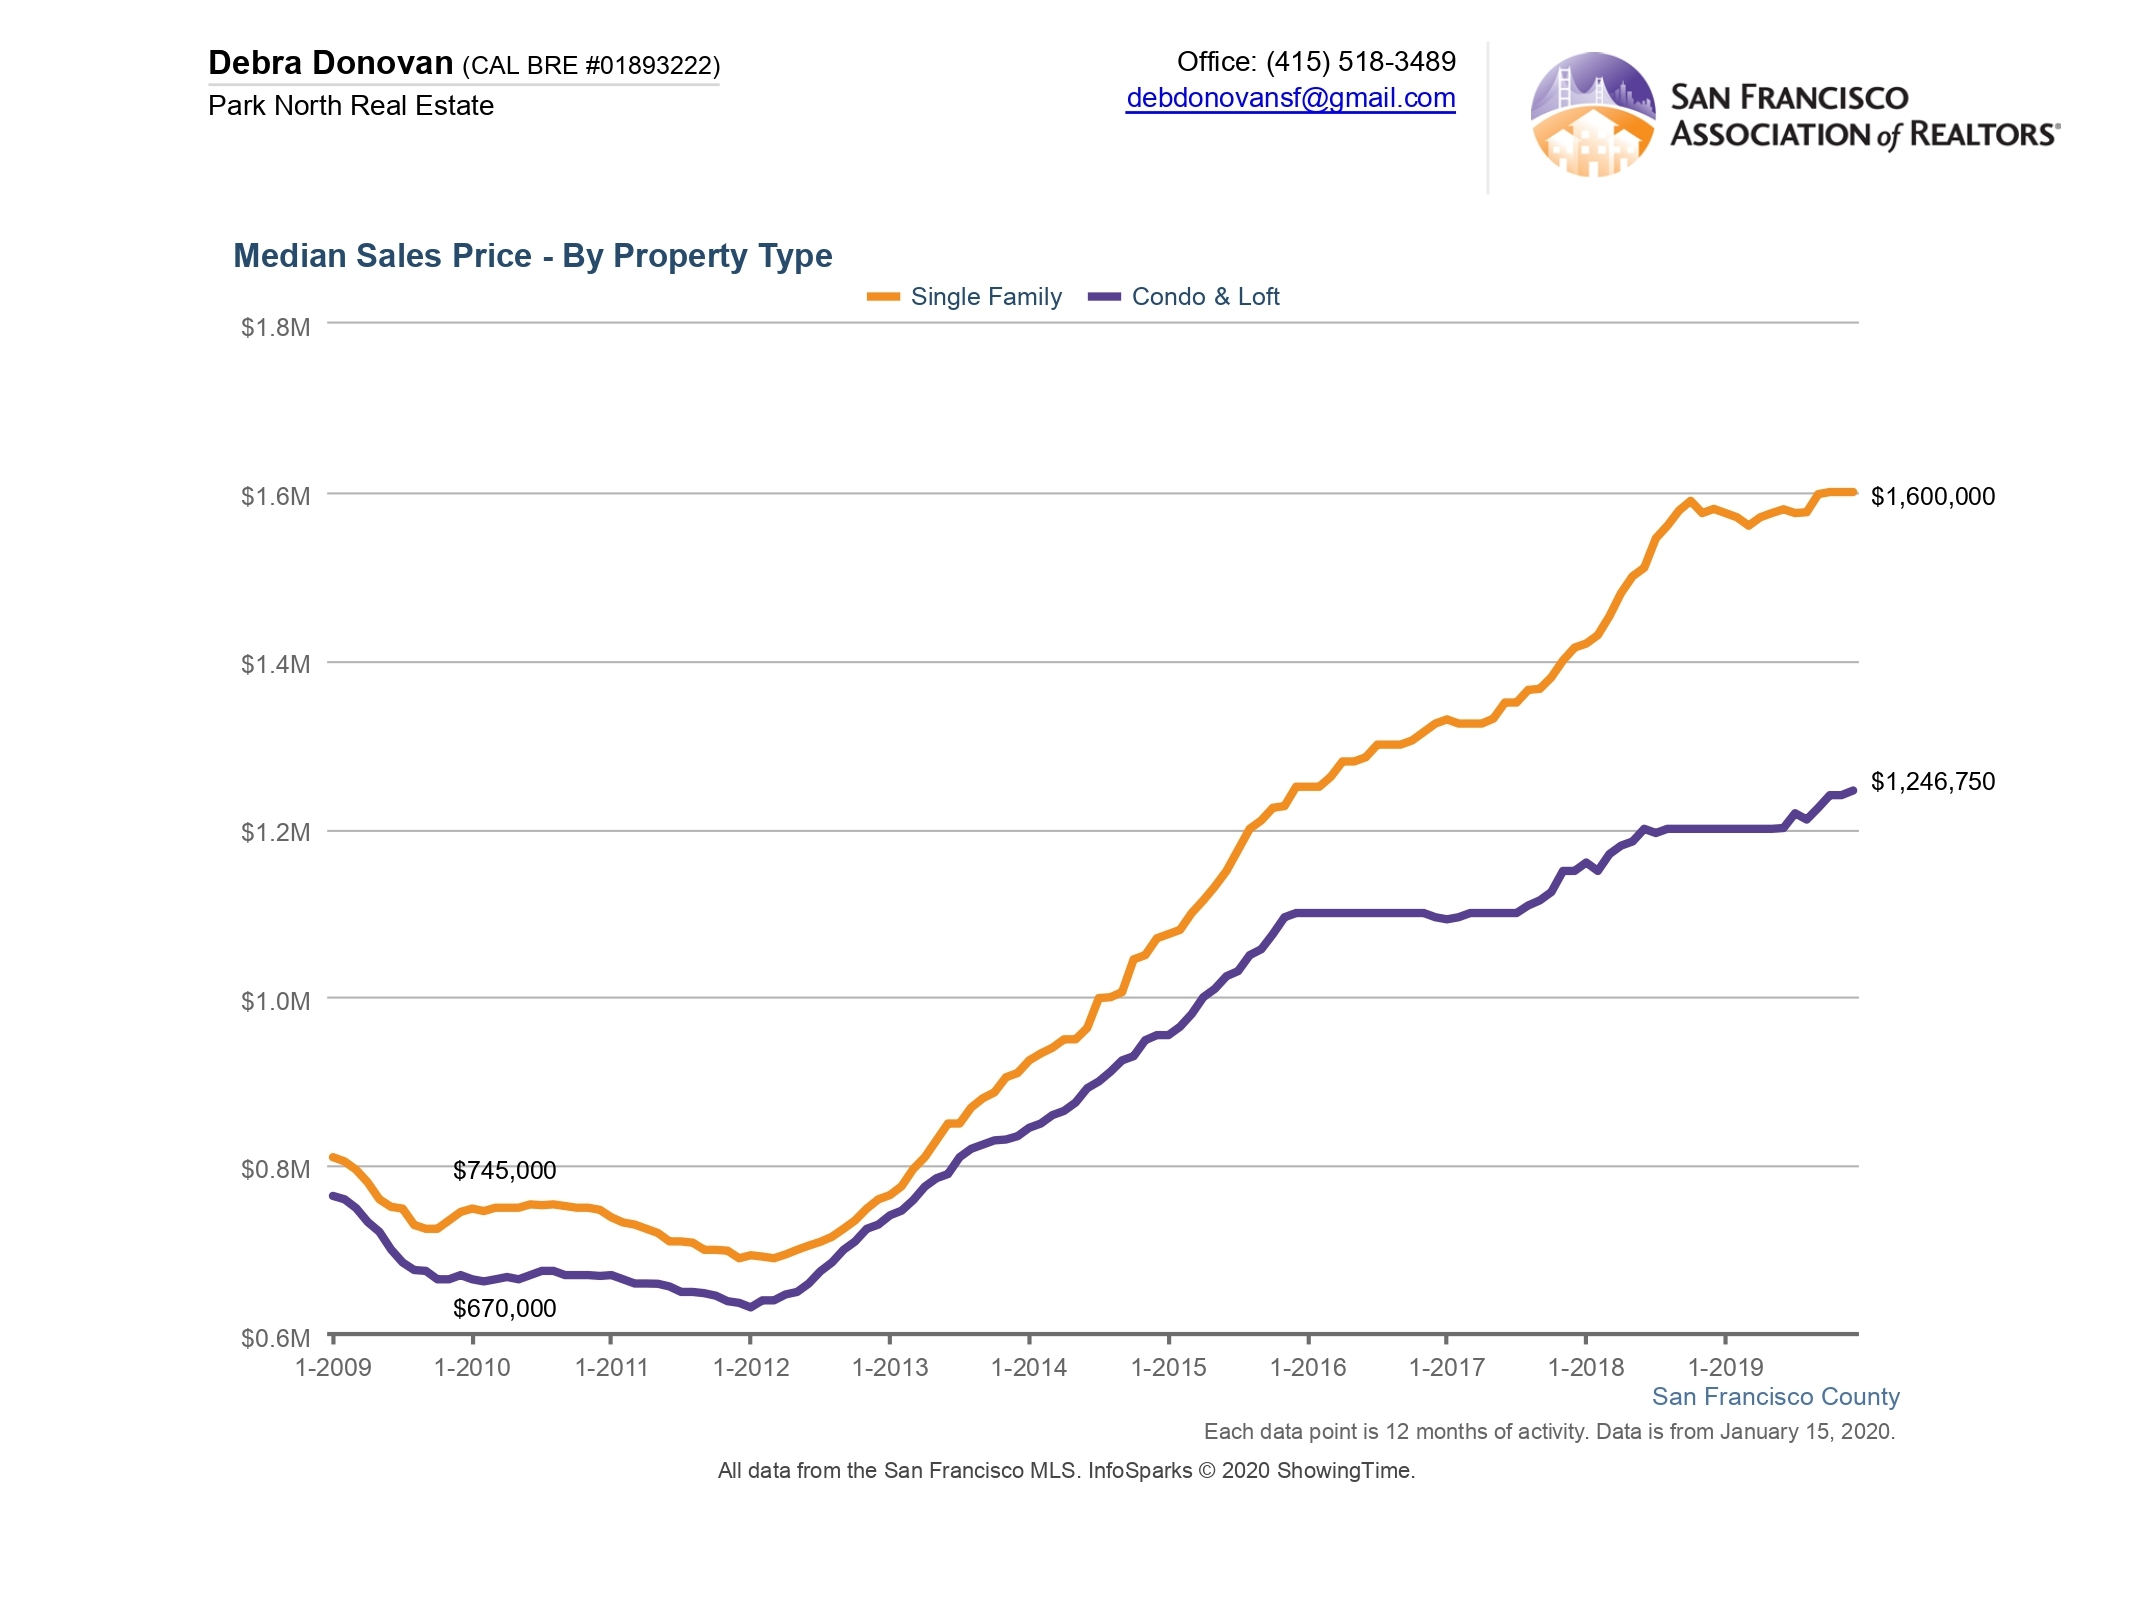
In 2019 the median price for a San Francisco home grew by 2.1%, the smallest growth we’ve seen in years. Single family home prices grew by just 1.3%. Condo and loft prices grew by 3.9%. (If you want to see all of my market statistics for 2019 you can find them here). But not all areas grew or contracted equally. Below are the 2019 statistics for median sales price for homes broken out by district. San Francisco is broken into 10 districts, with multiple sub-districts and neighborhoods comprising each larger district. You can see a map of San Francisco’s districts here.
If you are interested in learning more information about any district, subdistrict or neighborhood please reach out to me.
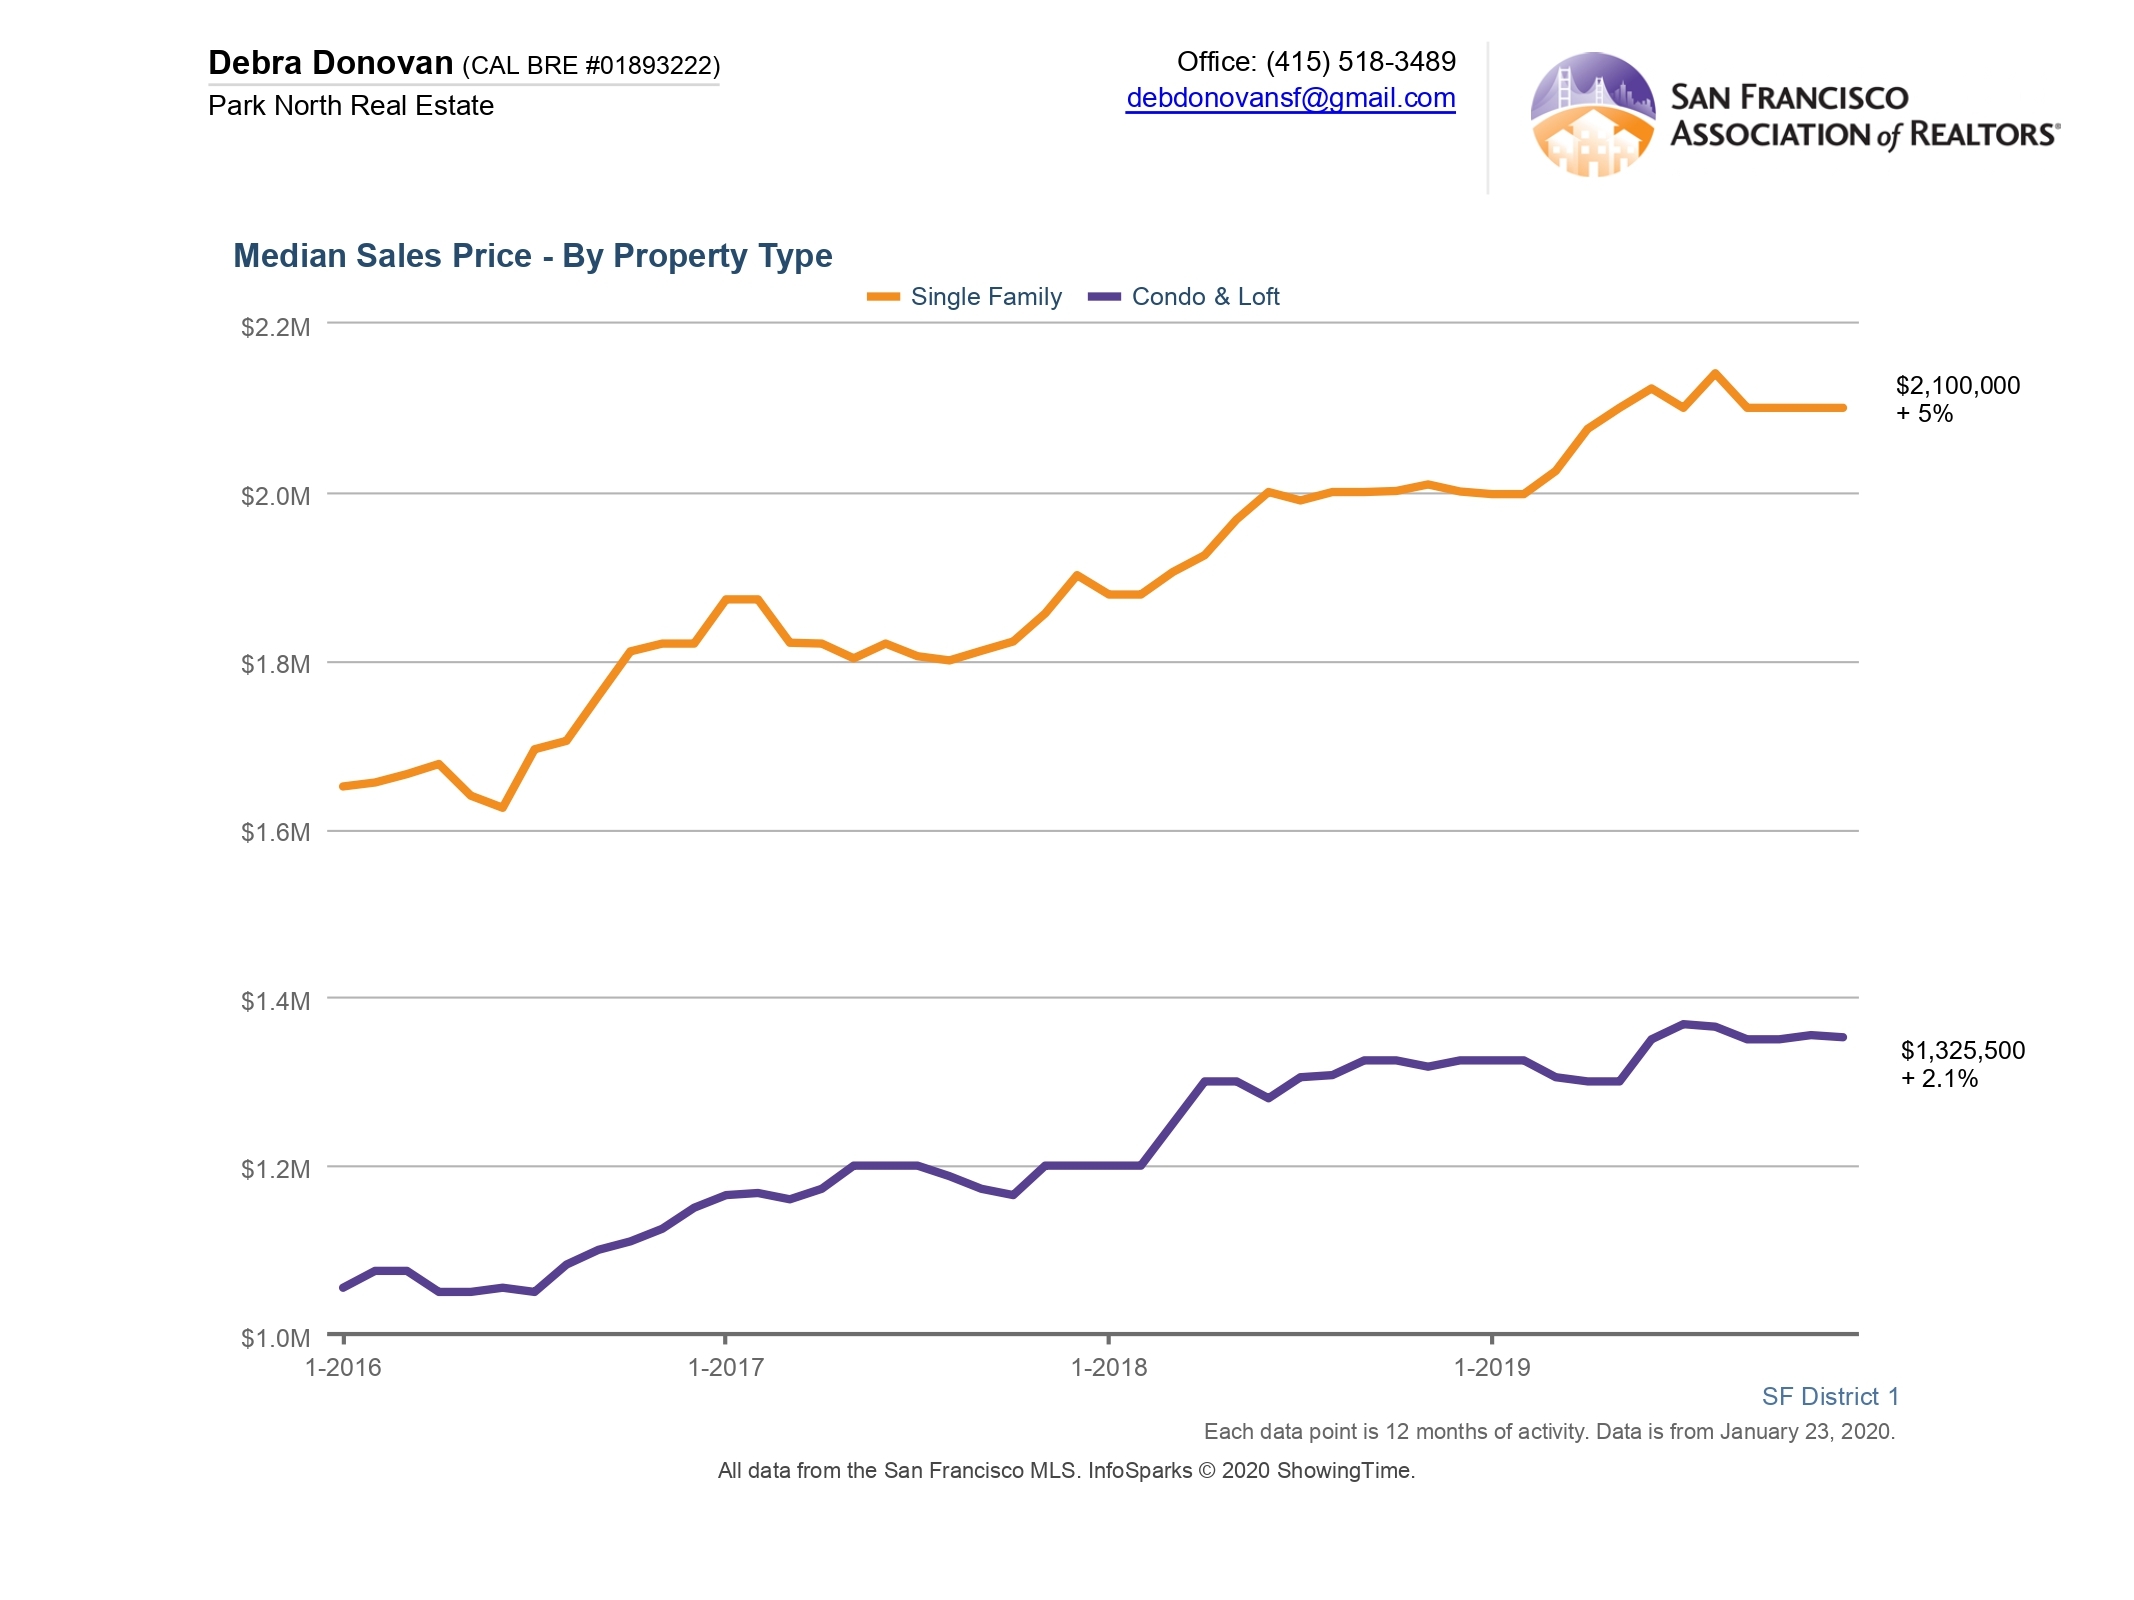
District 1: Northwest. Includes the Richmond (Inner, Central, and Outer), Jordan Park/ Laurel Heights, Lake Street, Seacliff, and Lone Mountain.
Single family homes in District 1 grew 5% in 2019 to a median price of $2,100,000. The median sales price for a condo or loft was $1,352,500, a 2.1% increase.
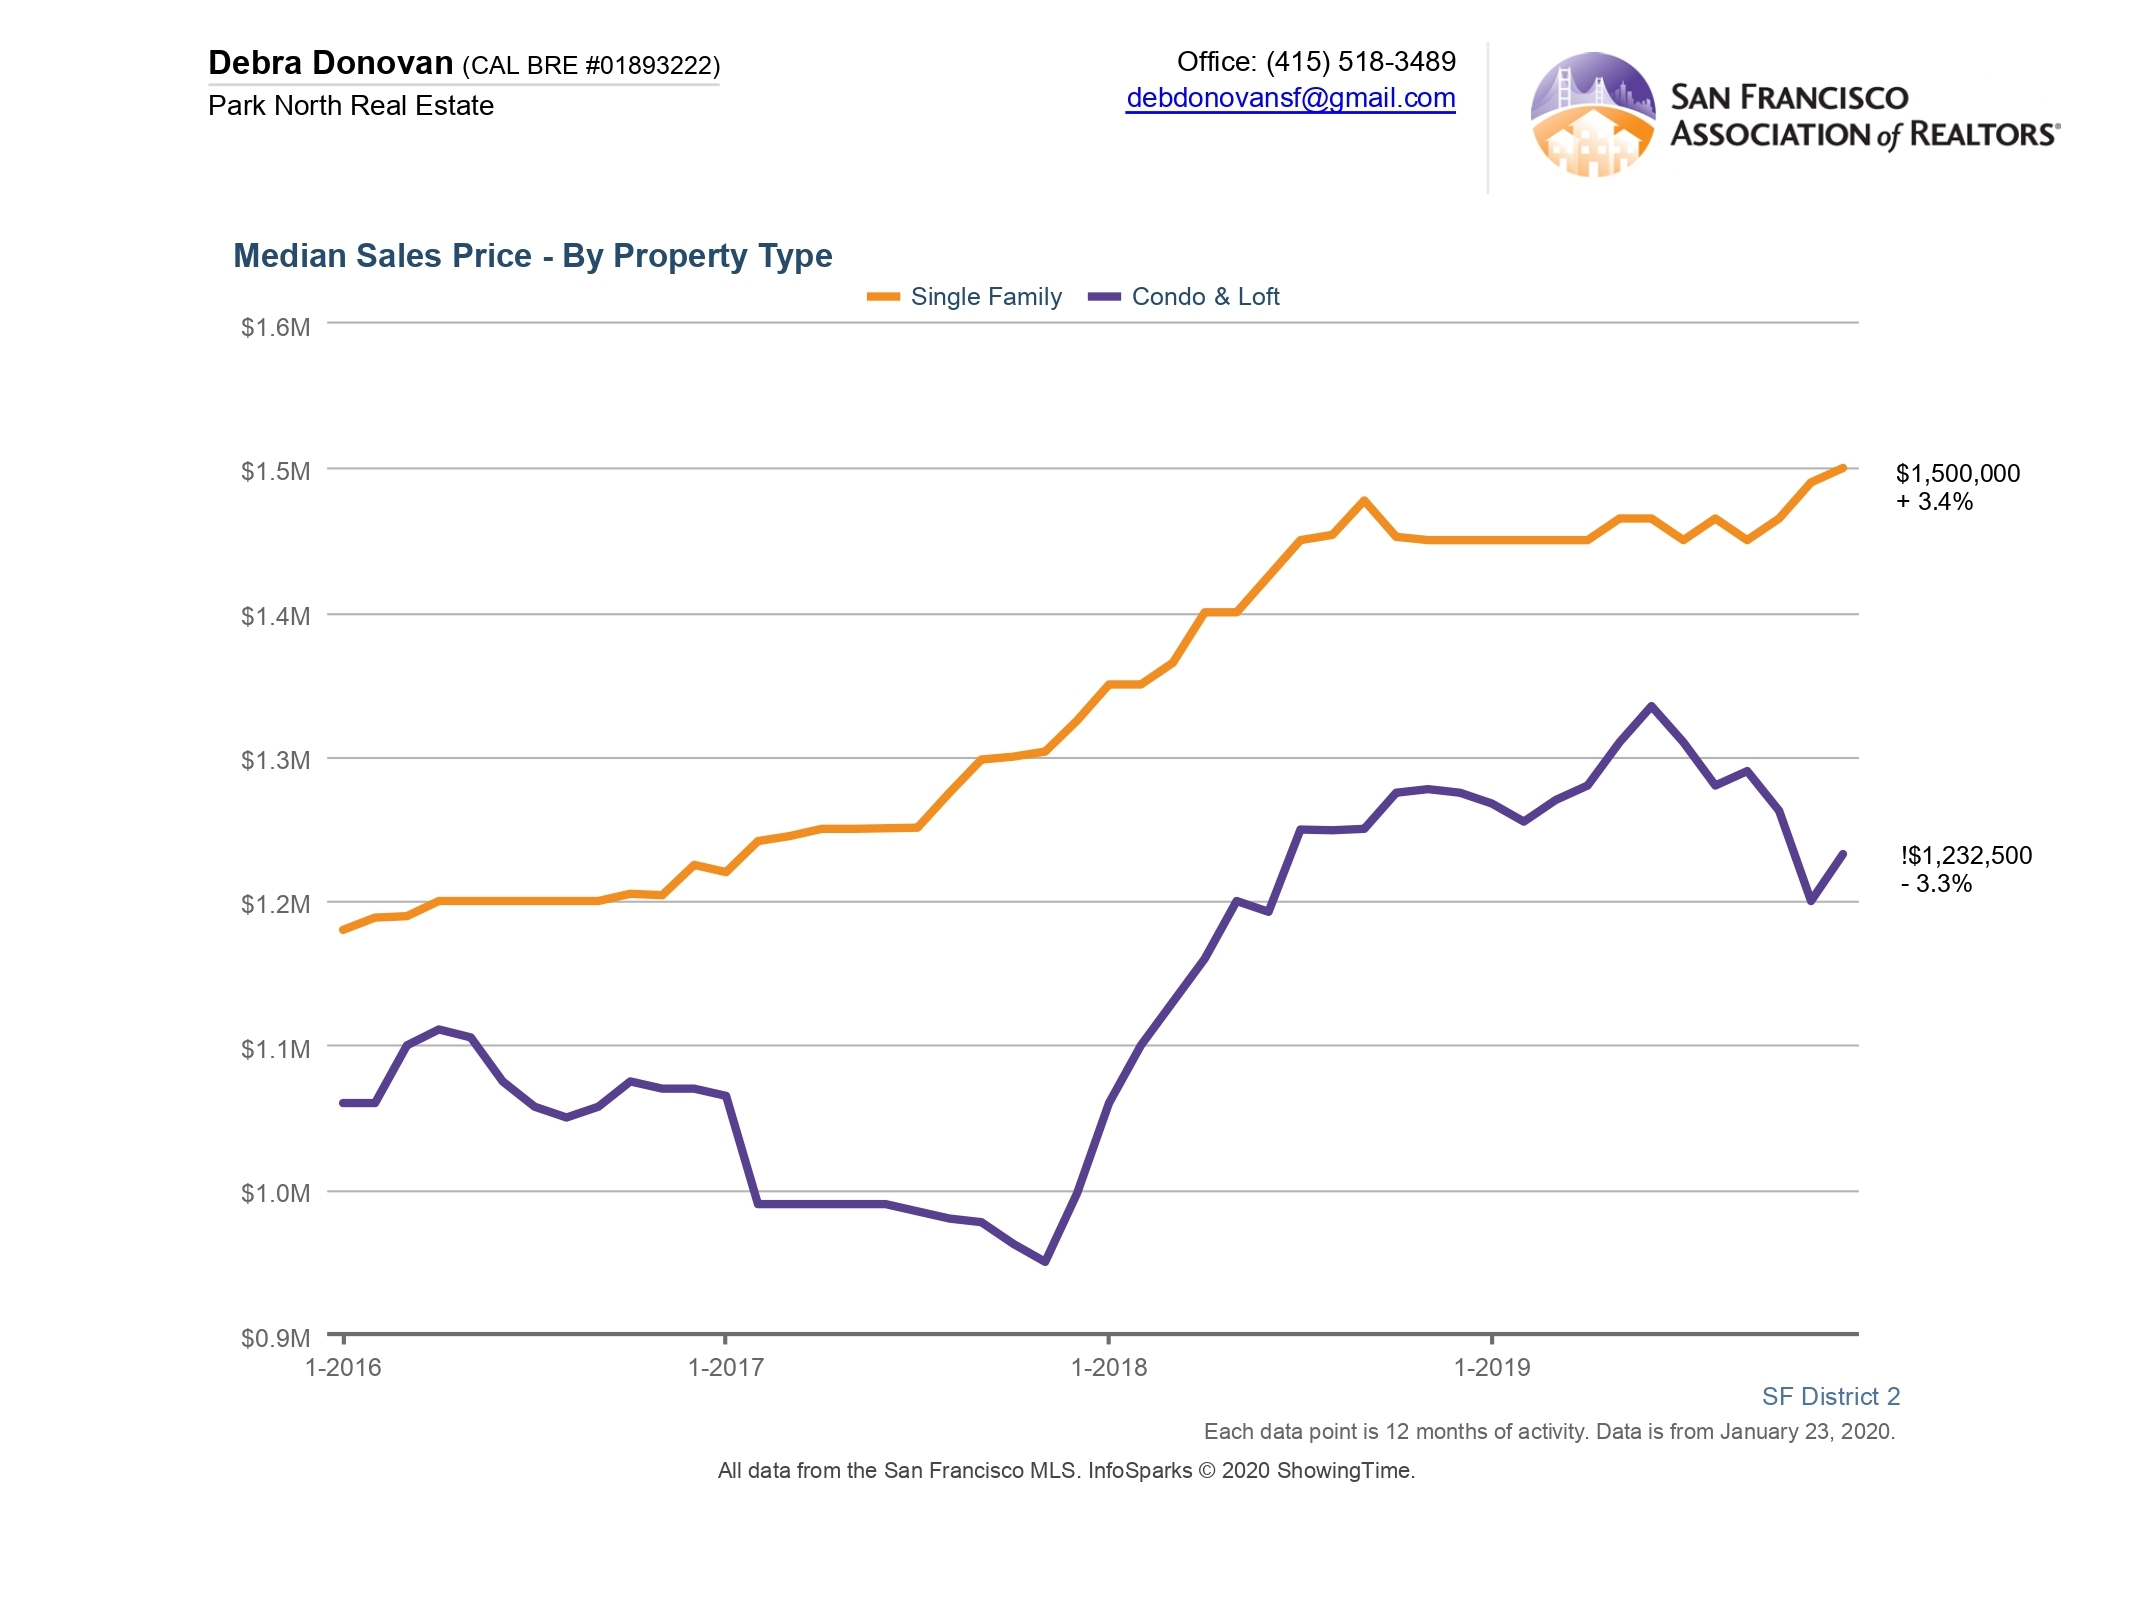
District 2: Central West. Includes Golden Gate Heights, Parkside (Inner, Outer), Sunset (Inner, Outer, Central).
The median sales price in District 2 was $1,500,000, a 3.4% increase from 2018, while condo and loft prices decreased 3.3% to $1,232,500.
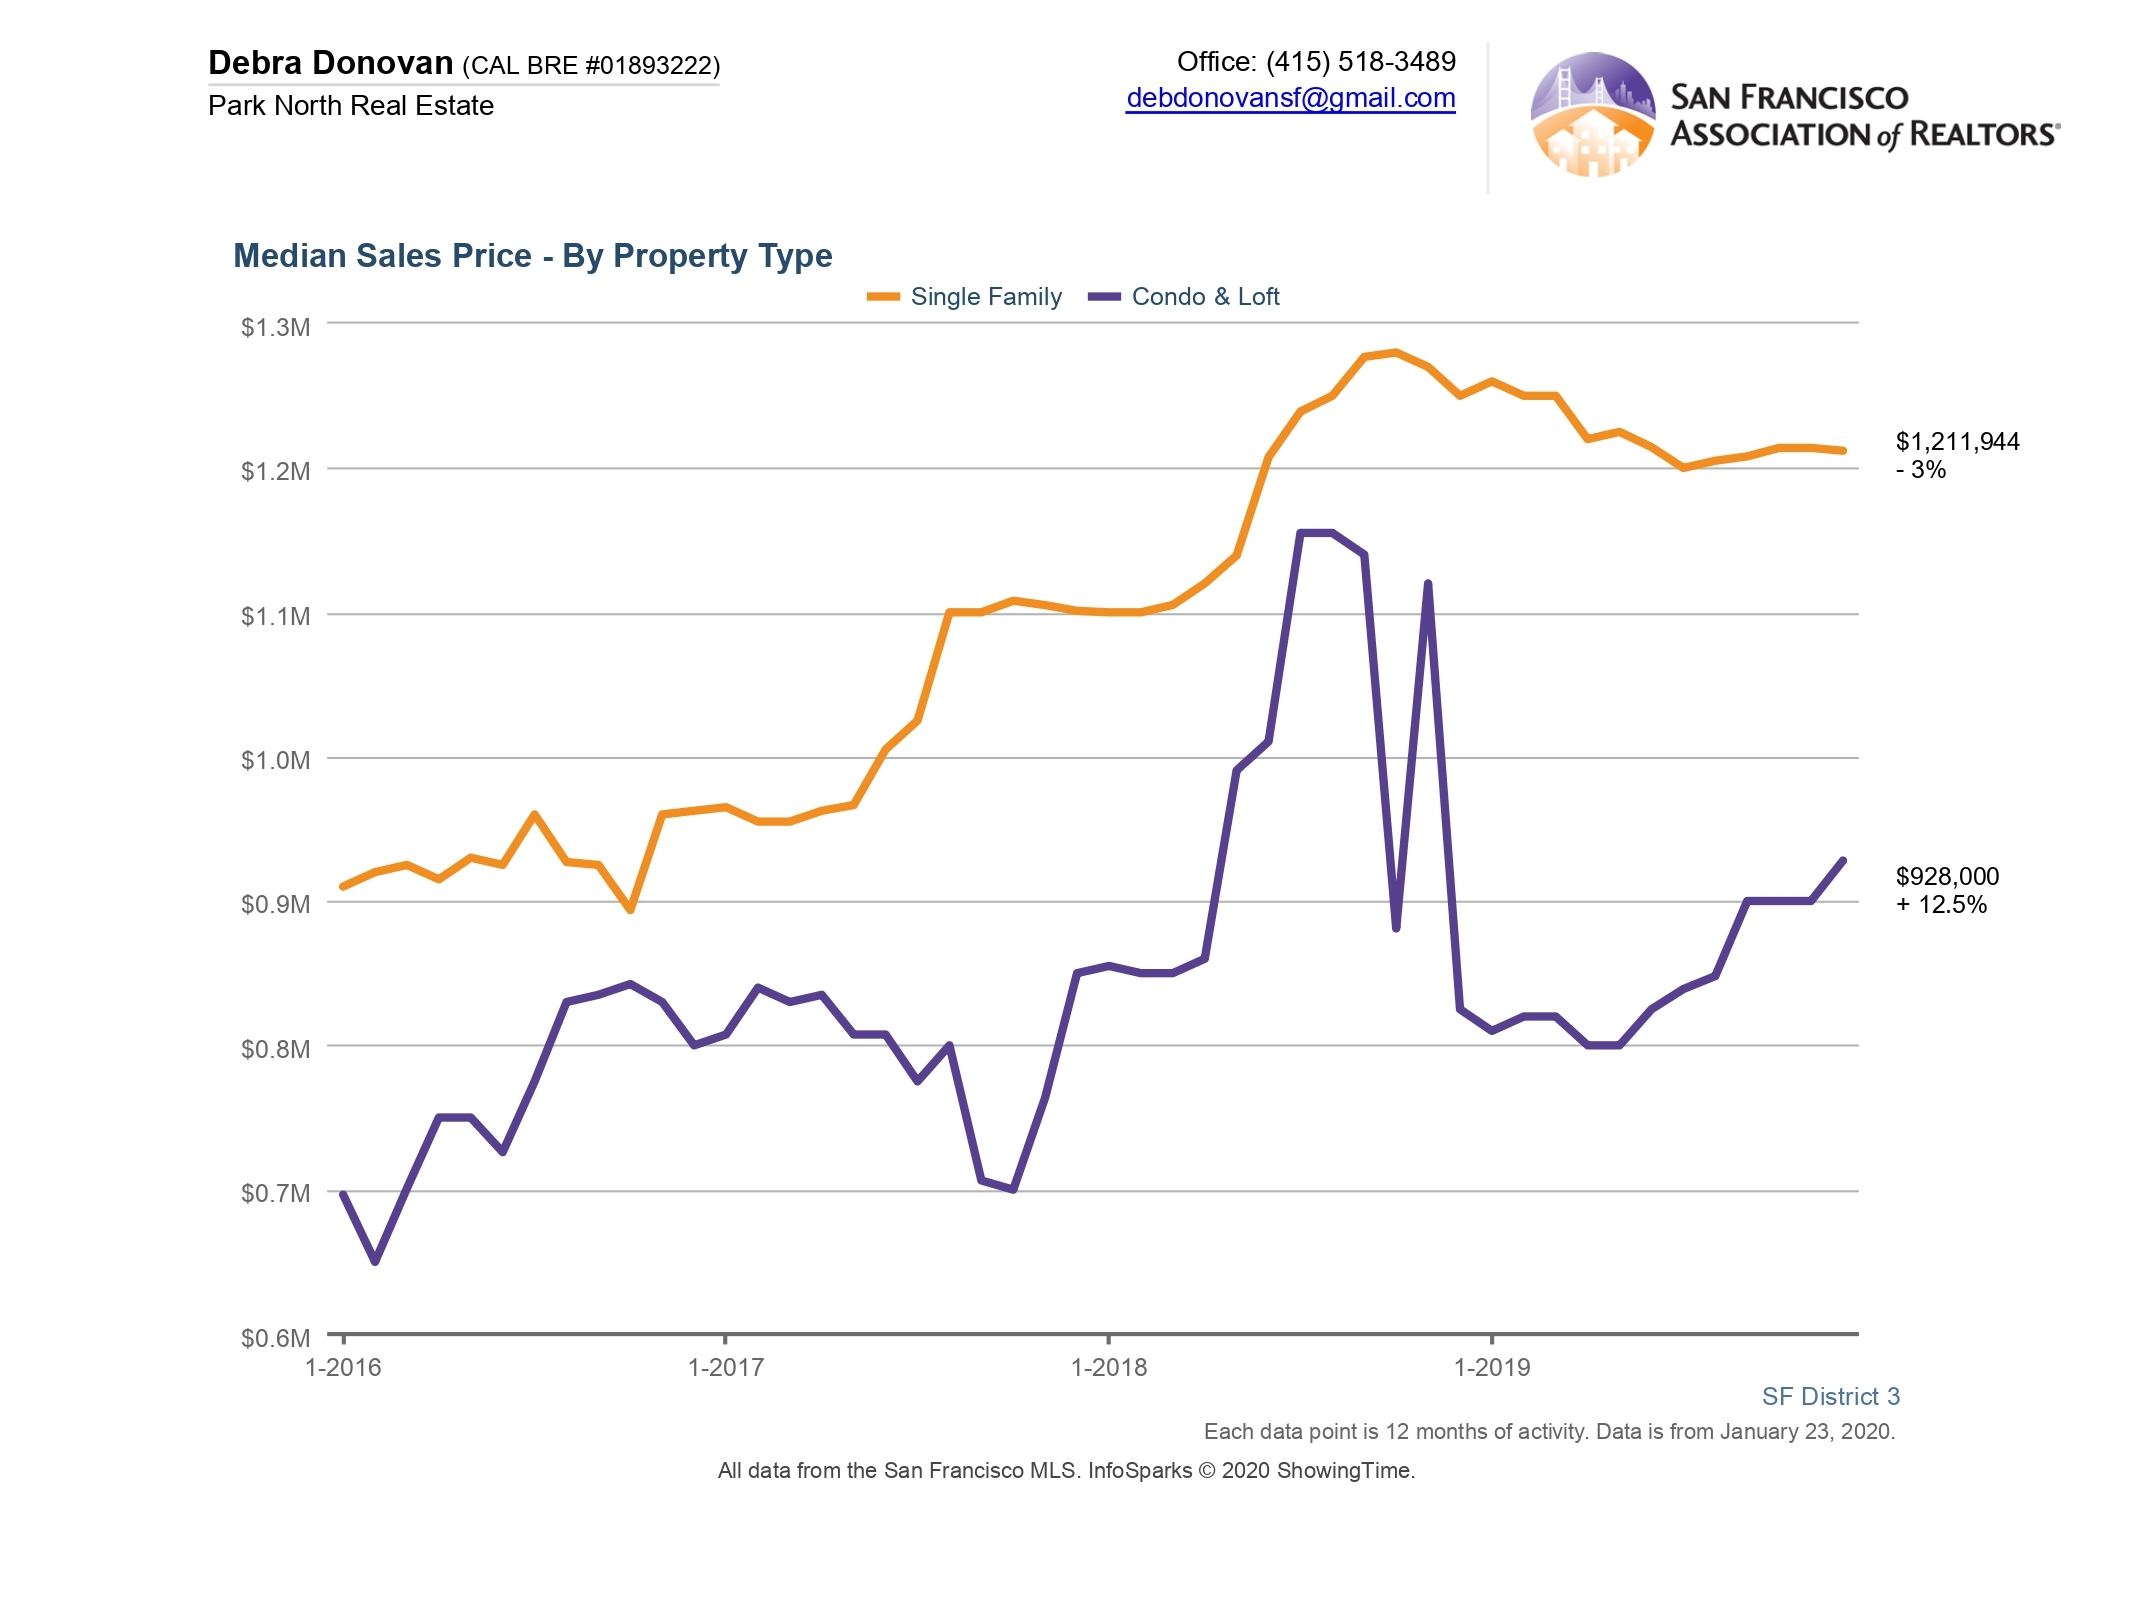
District 3: Southwest. Includes Lake Shore, Merced Heights, Pine Lake Park, Stonestown, Lakeside, Merced Manor, Ingleside Heights, Ingleside, and Oceanview.
Single family homes had a median sales price of $1,211,944 in 2019, a 3% decrease from 2018. Condos and lofts, on the other hand, saw a 12.5% year-over-year increase to $928,000.
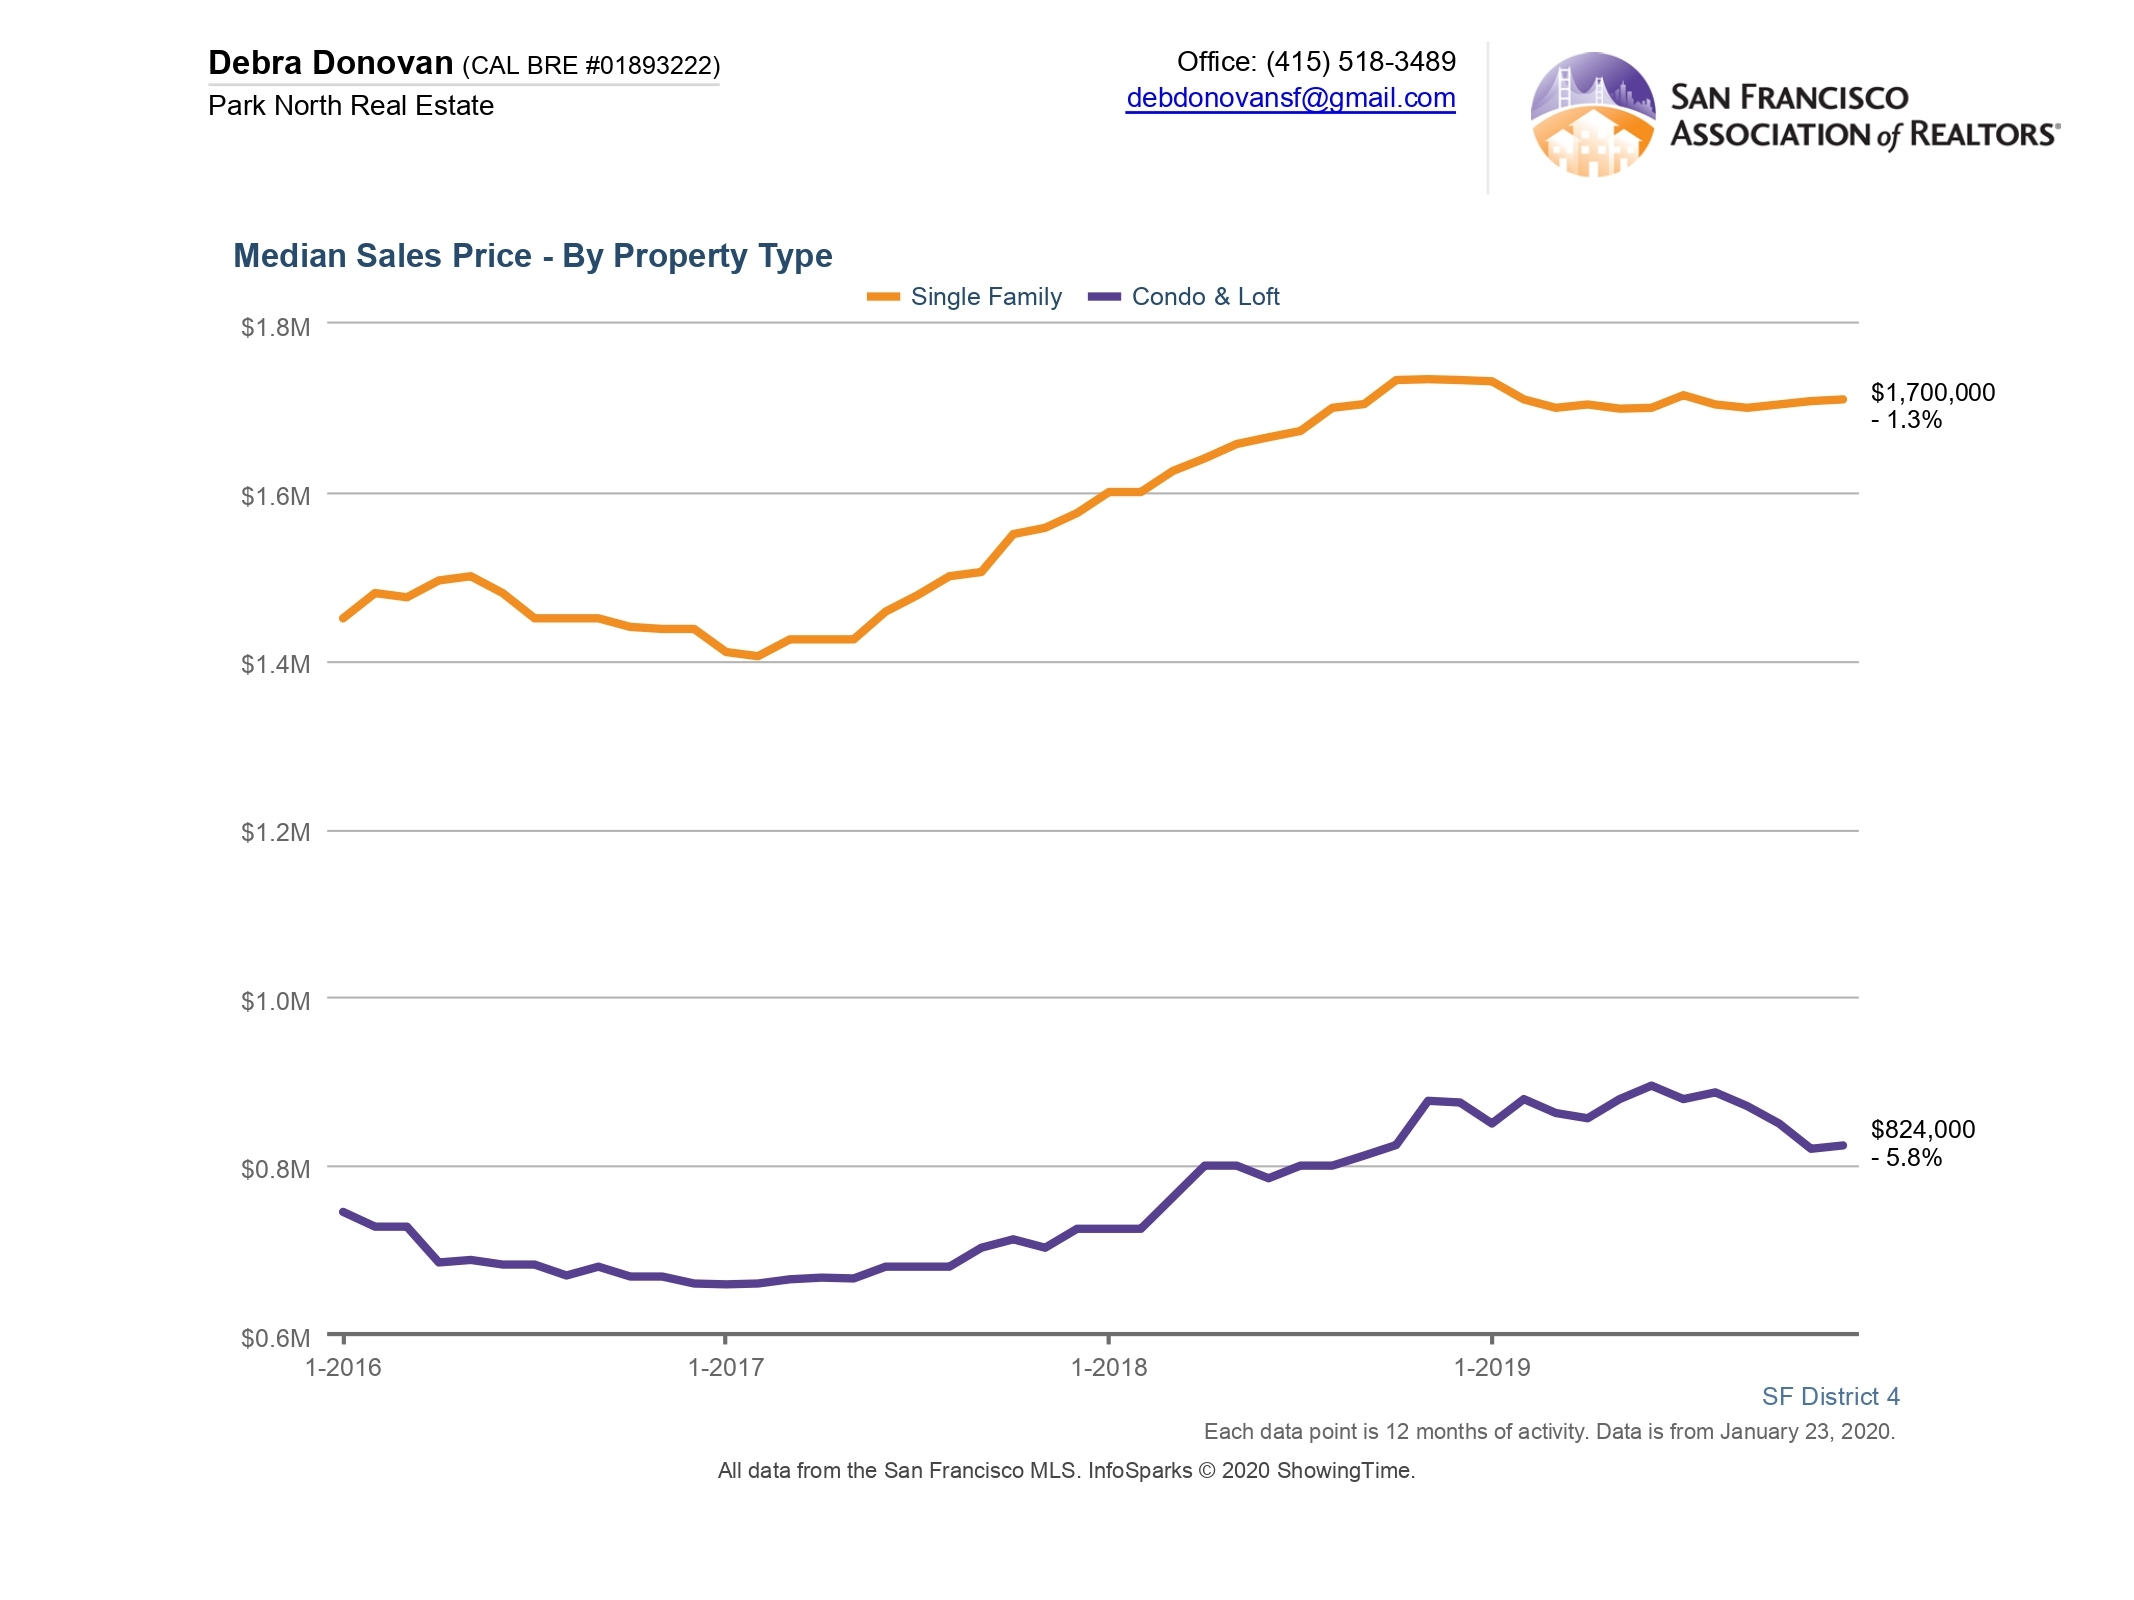
District 4: Twin Peaks West. Includes Balboa Terrace, Diamond Heights, Forest Hill, Forest Knolls, Ingleside Terrace, Midtown Terrace, St. Francis Wood, Miraloma Park, Forest Hill Extension, Sherwood Forest, Monterey Heights, Mount Davidson Manor, Westwood Highlands, Westwood Park, Sunnyside, and West Portal.
The median sales price for a single family home in District 4 was $1,700,000, a 1.3% decrease compared to 2018. Condos and lofts prices saw a 5.8% decrease to a median price of $824,000.
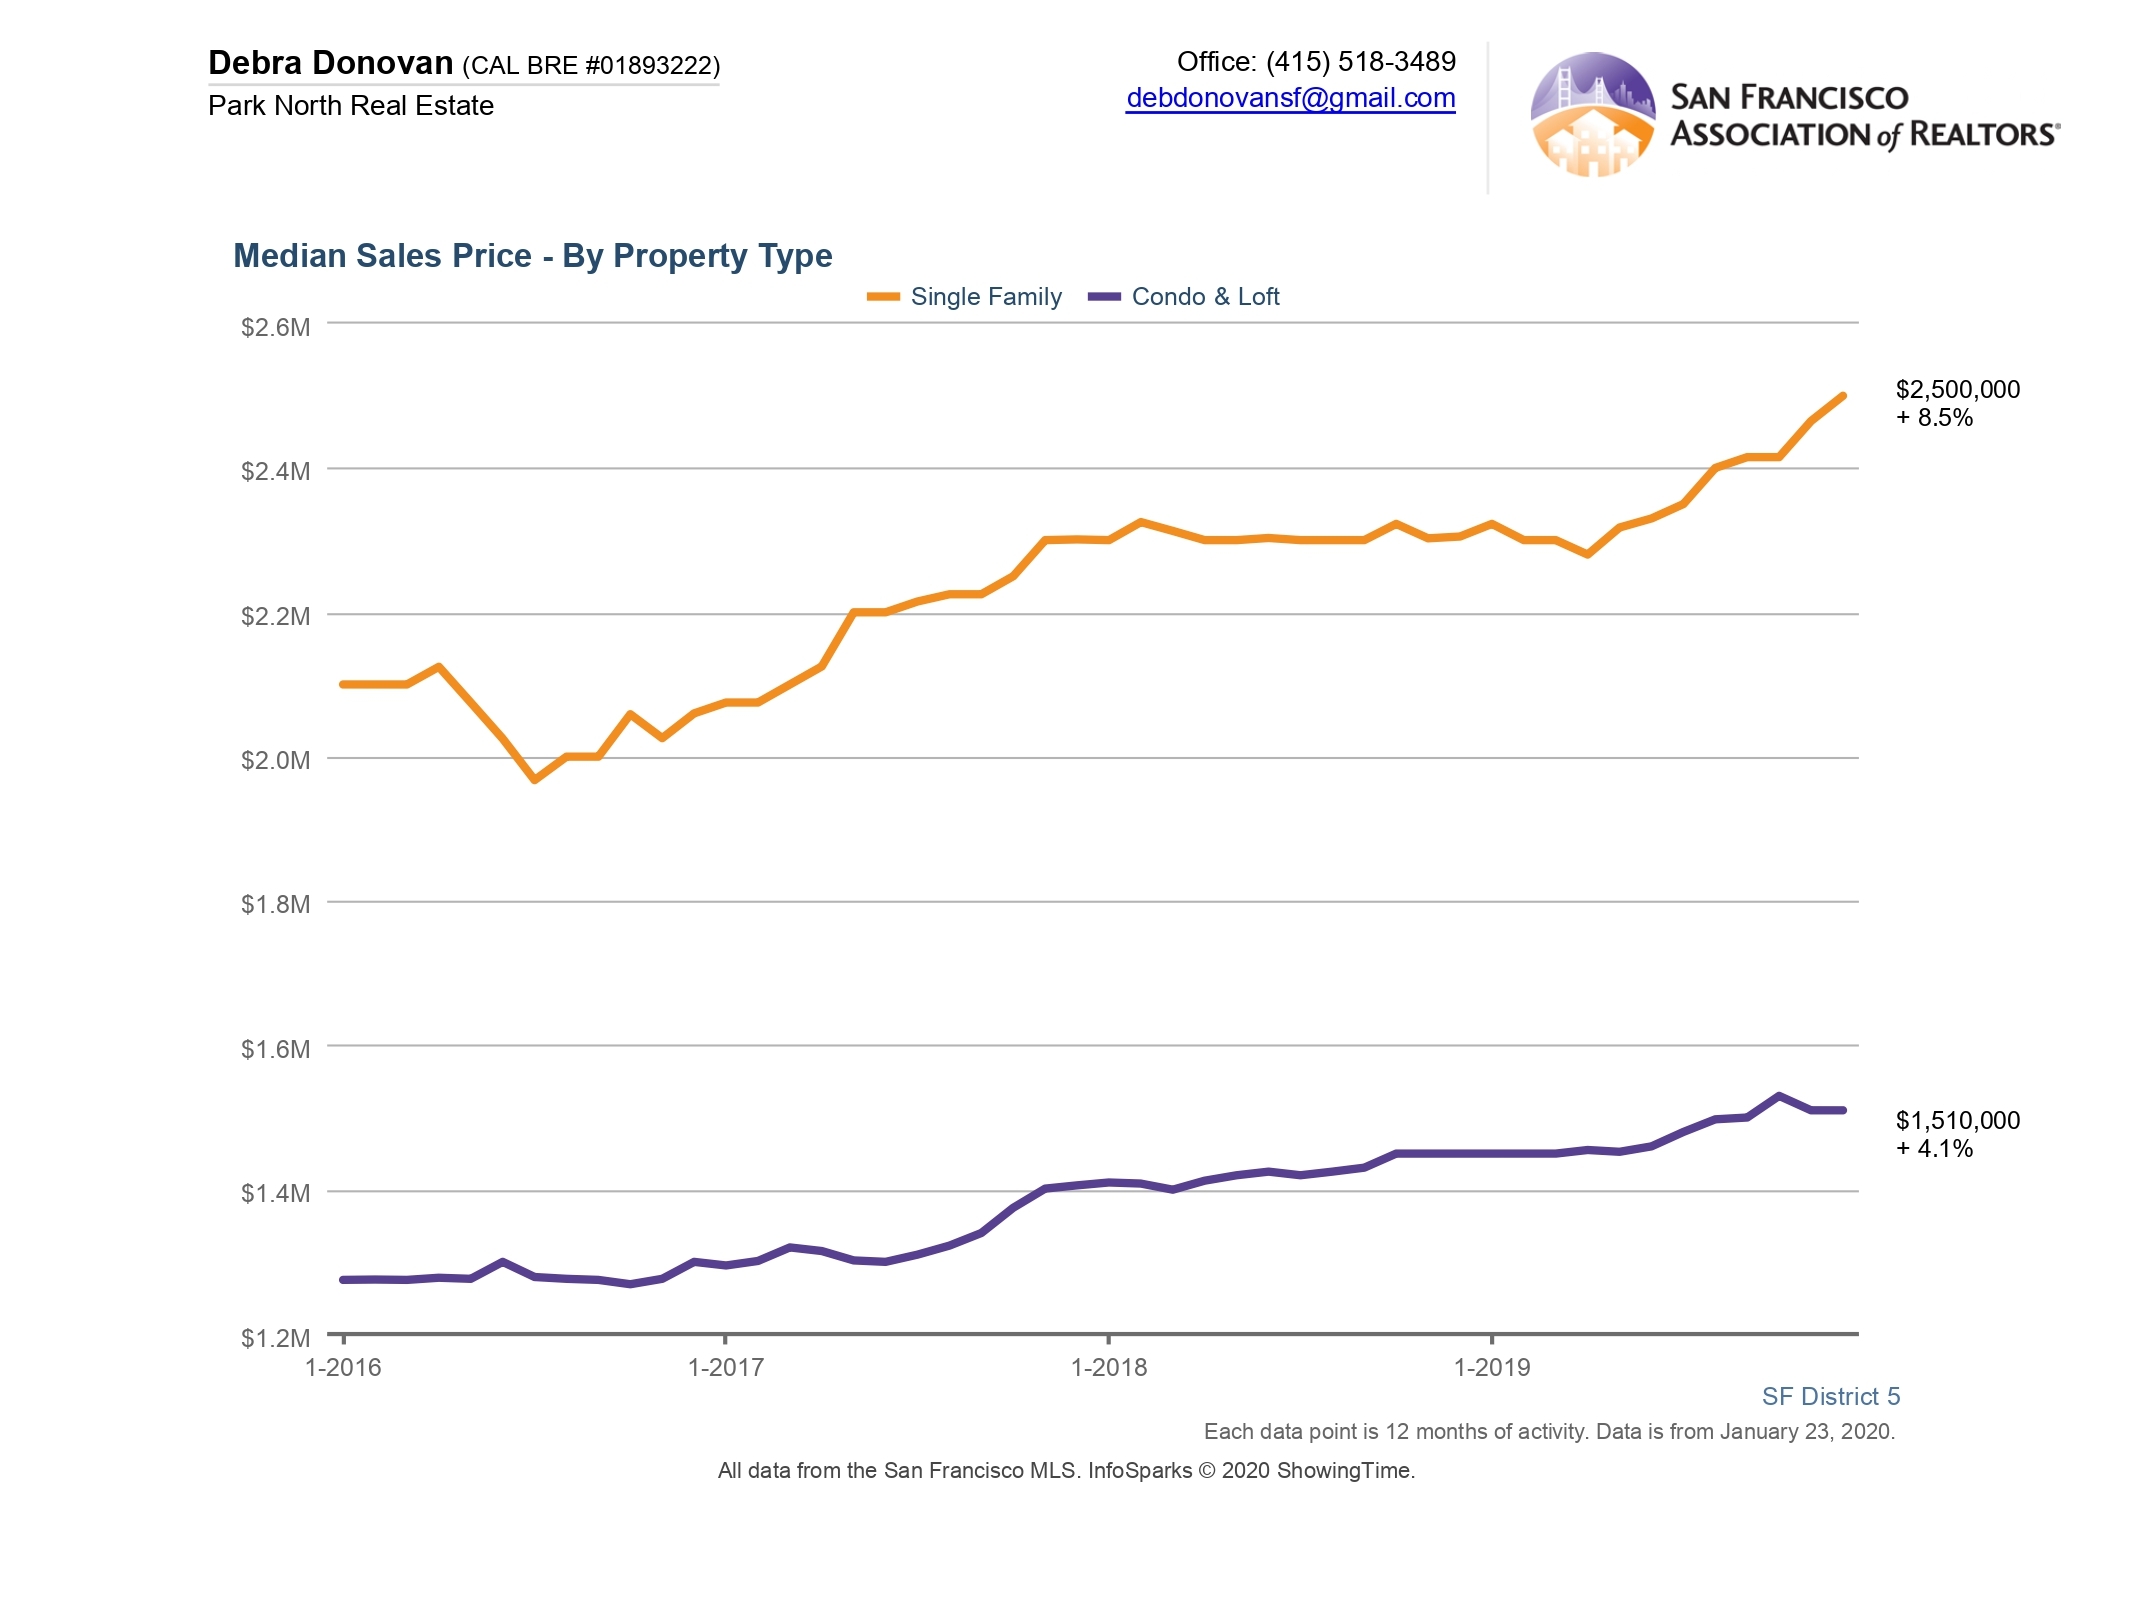
District 5: Upper Market. Glen park, Haight Ashbury, Noe Valley, Twin Peaks, Cole Valley/ Parnassus Heights, Corona Heights, Clarendon Heights, Duboce Triangle, Eureka Valley/ Dolores Heights/ Castro, Mission Dolores.
Single family home prices in District 5 grew 8.5% in 2019 to $2,500,000. Condos and lofts experienced a 4.1% increase to $1,500,000.
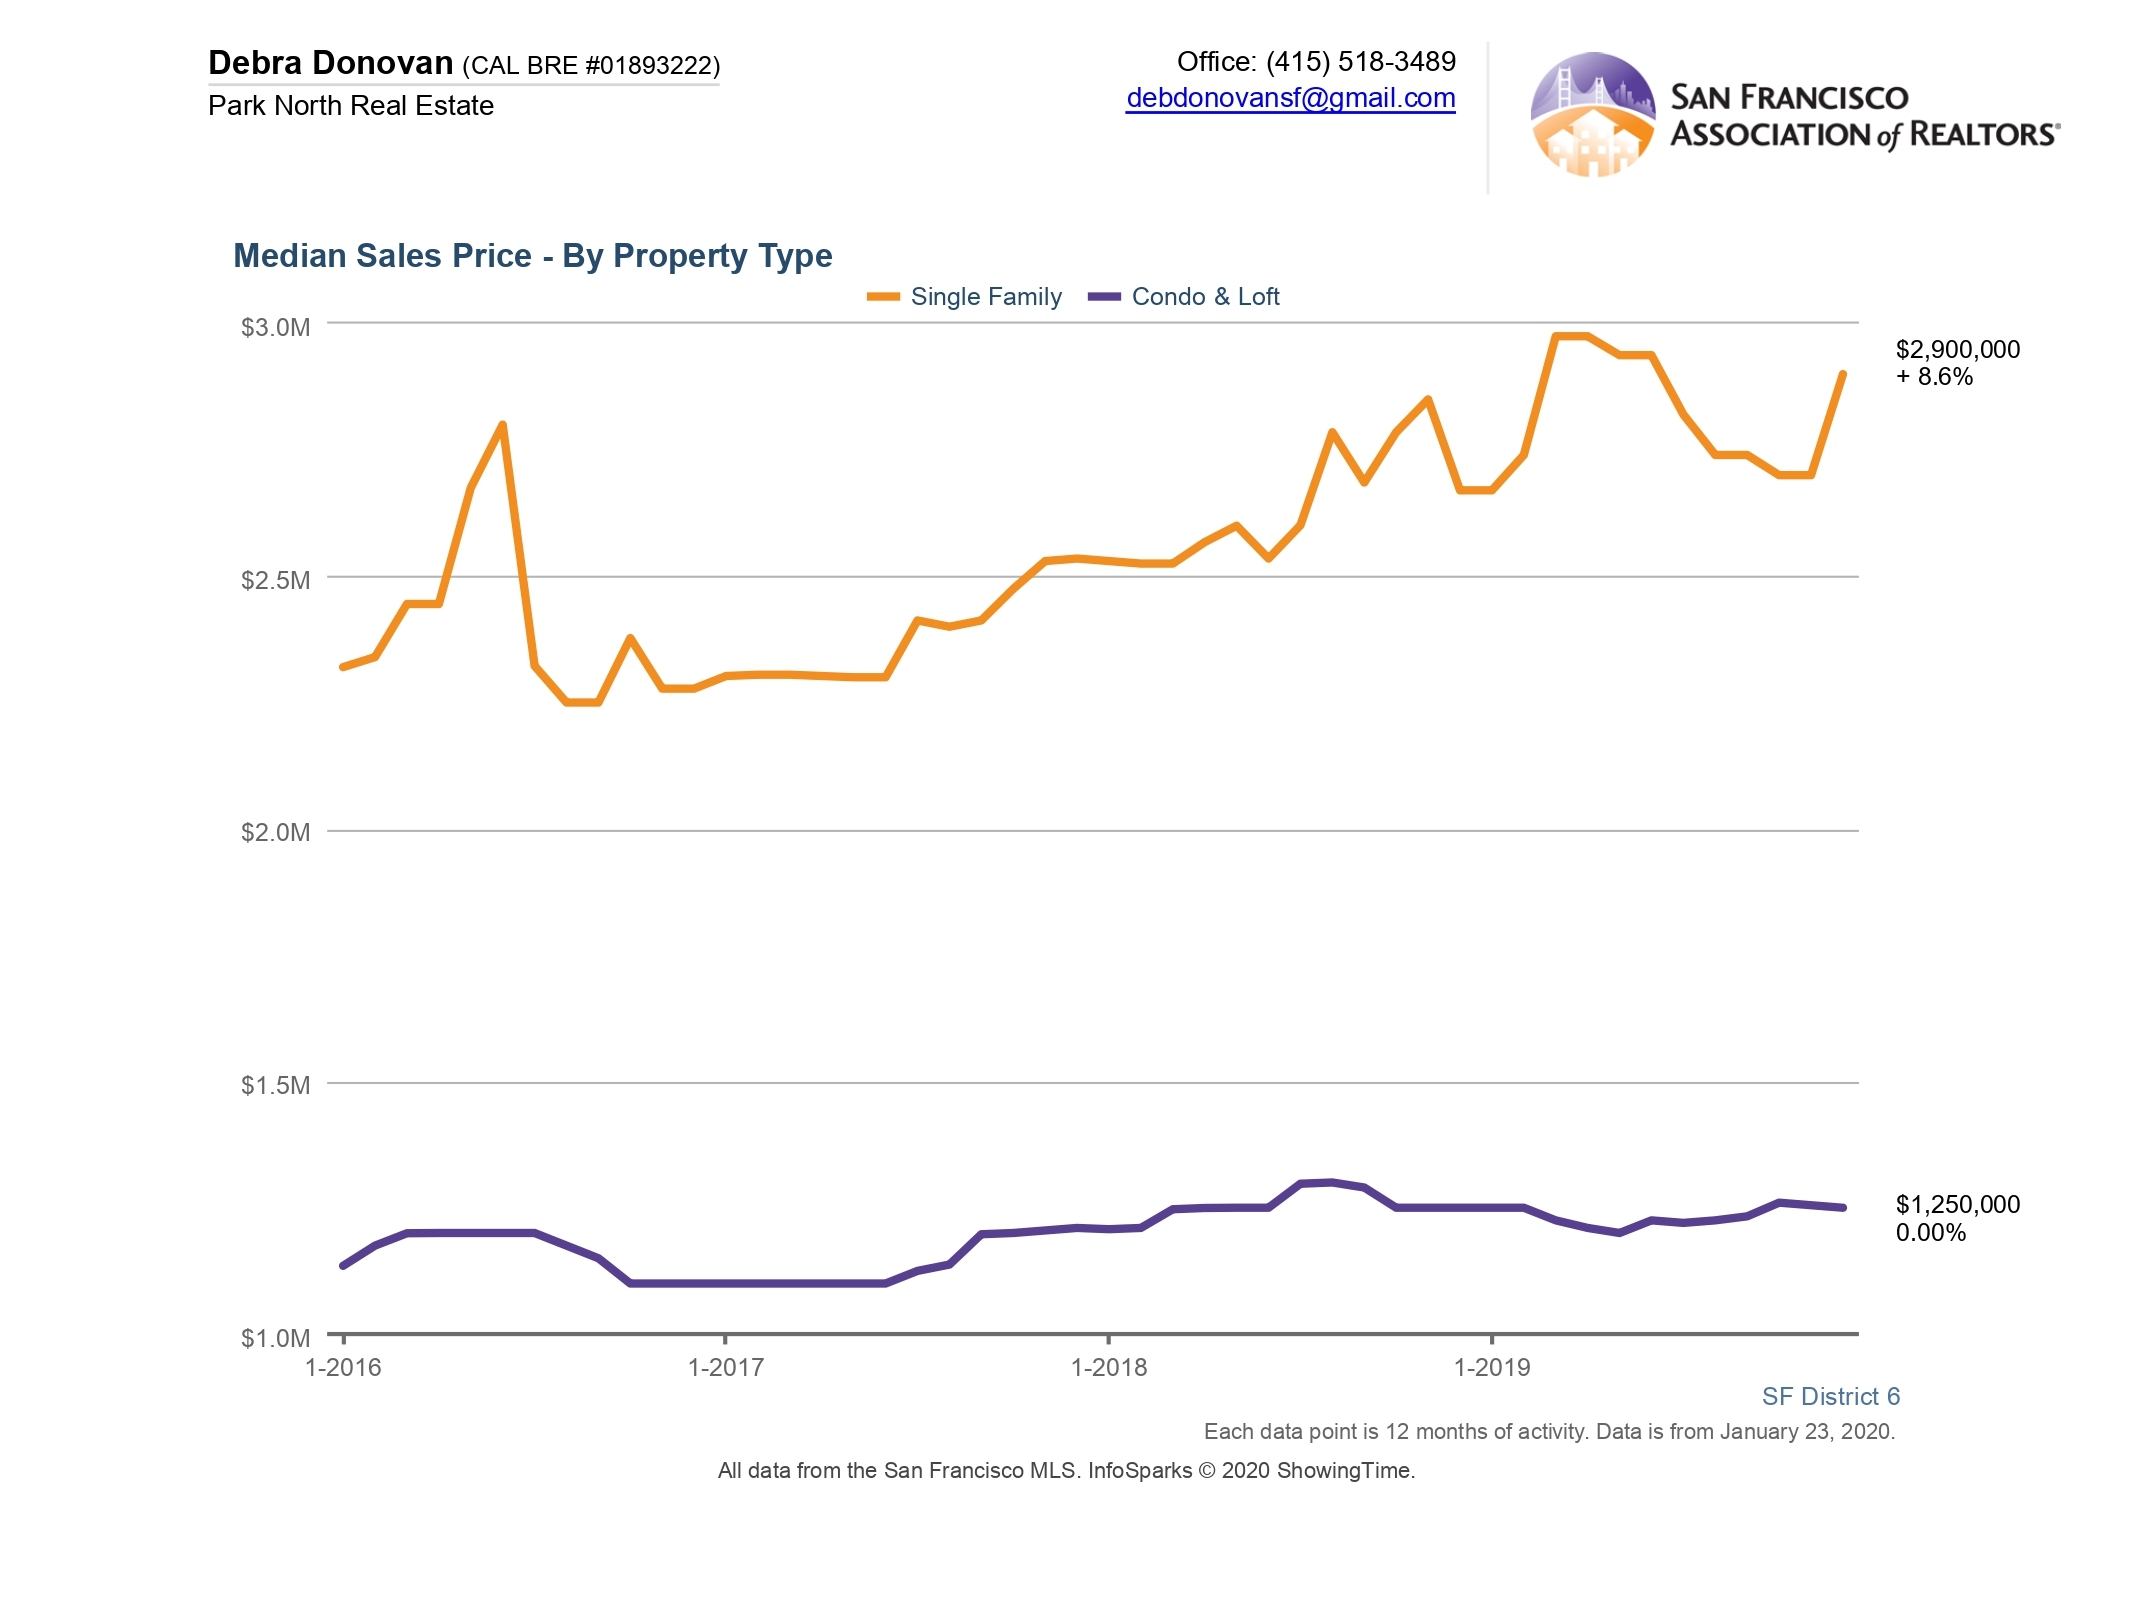
District 6: Central North. Includes Anza Valley, Hayes Valley, Lower Pacific Heights, Western Addition, Alamo Square, North Panhandle.
The median price for single family homes in District 6 reached $2,900,000 in 2019, an 8.6% increase compared to 2018. Condos and lofts remained steady year over year with a median sales price of $1,250,000.
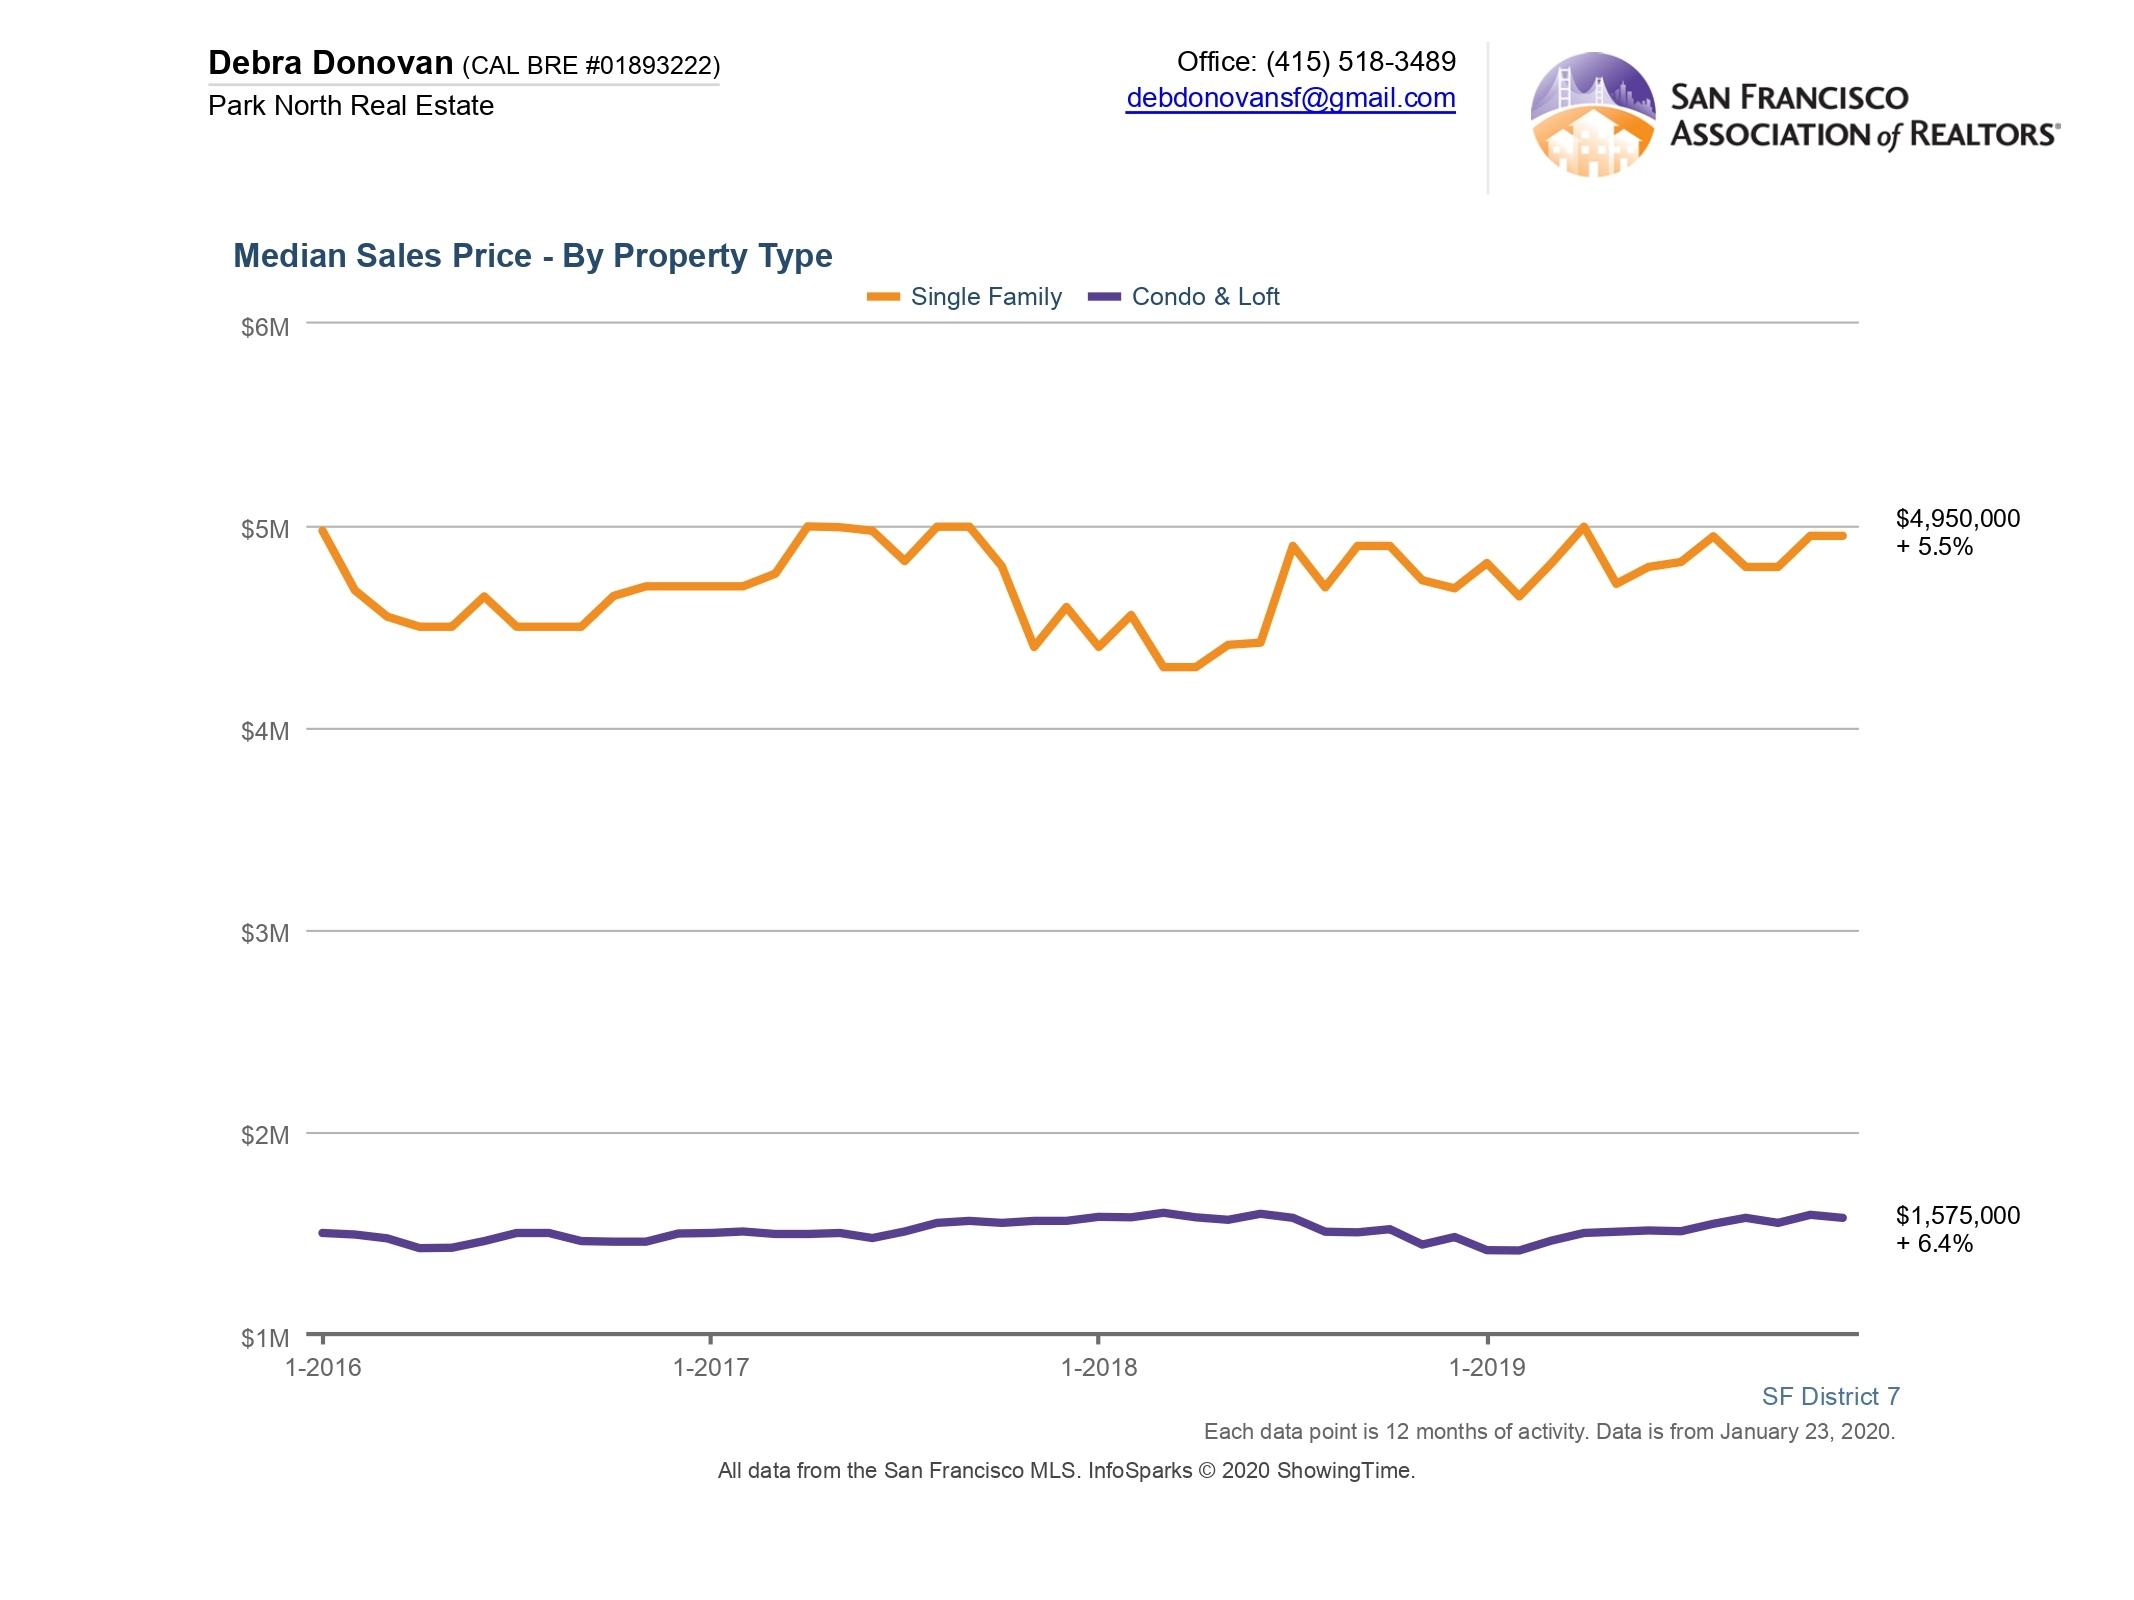
District 7: North. Includes the Marina, Pacific Heights, Presidio Height, Cow Hollow.
The median sales price for a single family home remained lofty in District 7, increasing 5.5% compared to last year to $4,950,000 in 2019. Condo and loft prices rose 6.4% to $1,575,000.
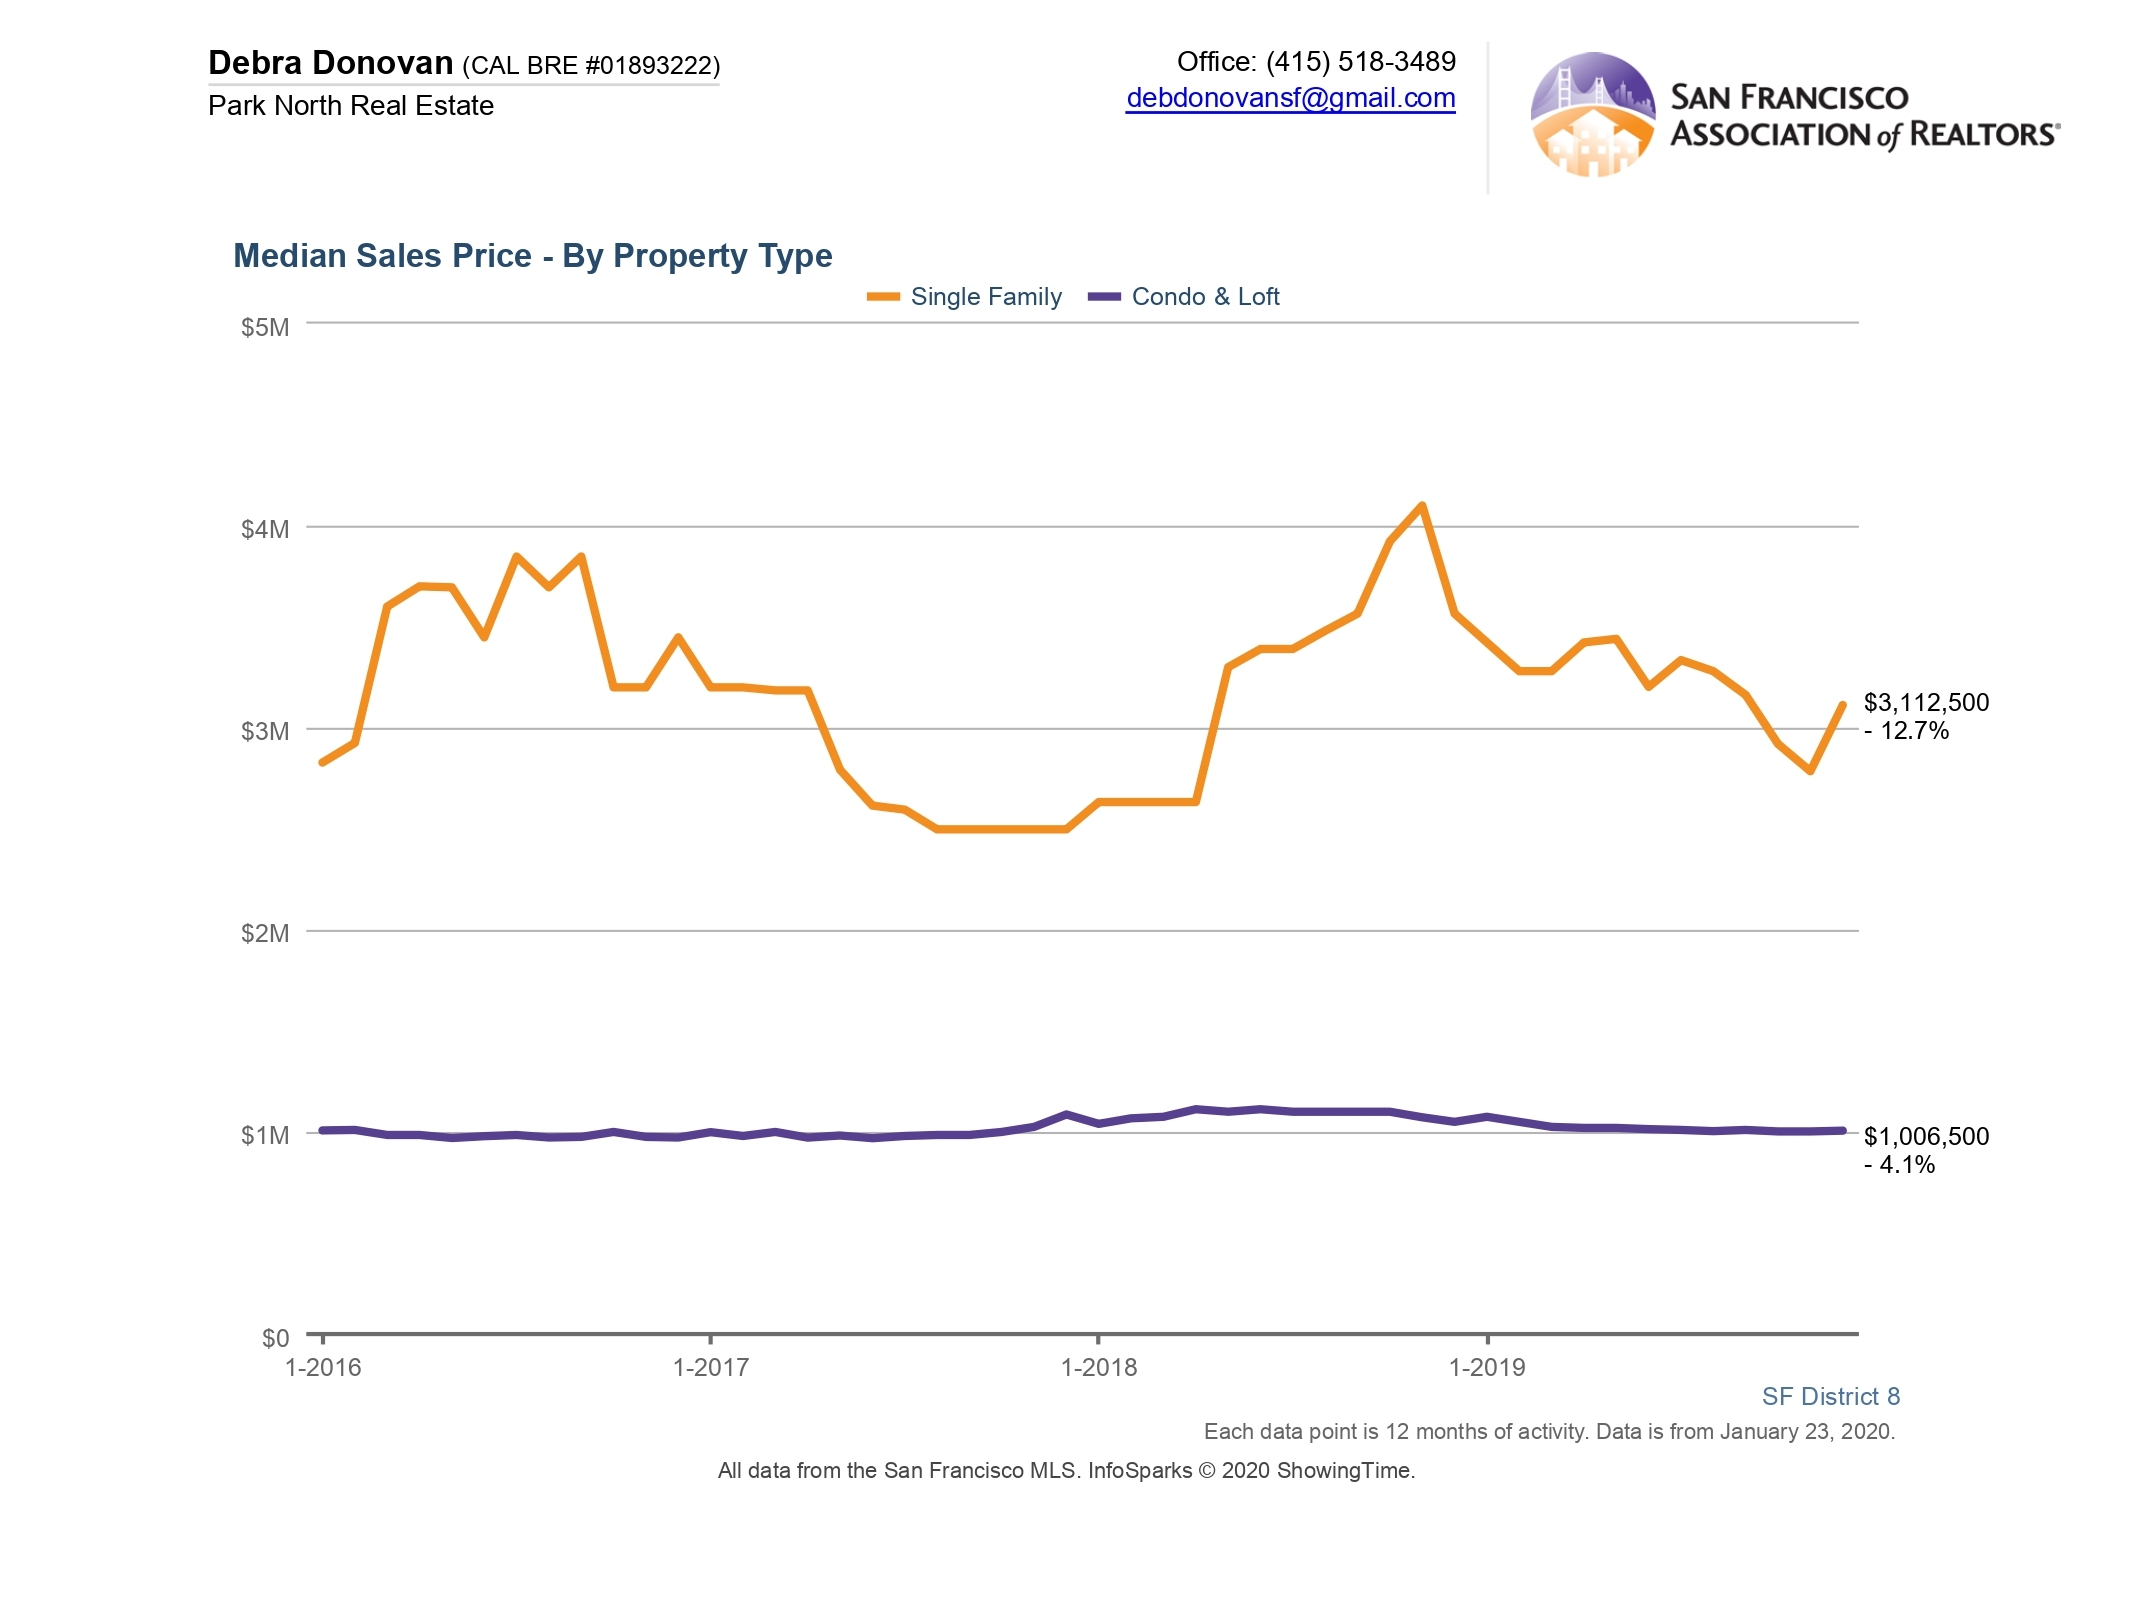
District 8: Northwest. Includes Downtown, Financial District/ Barbary Coast, Nob Hill, North Beach, Russian Hill, Van Ness/ Civic Center, Telegraph Hill, North Waterfront, Tenderloin.
Single family home prices in District 8 decreased 12.7% to $3,112,500. Condo and loft prices also decreased 4.1% compared to last year, ending at $1,006,500 in 2019.
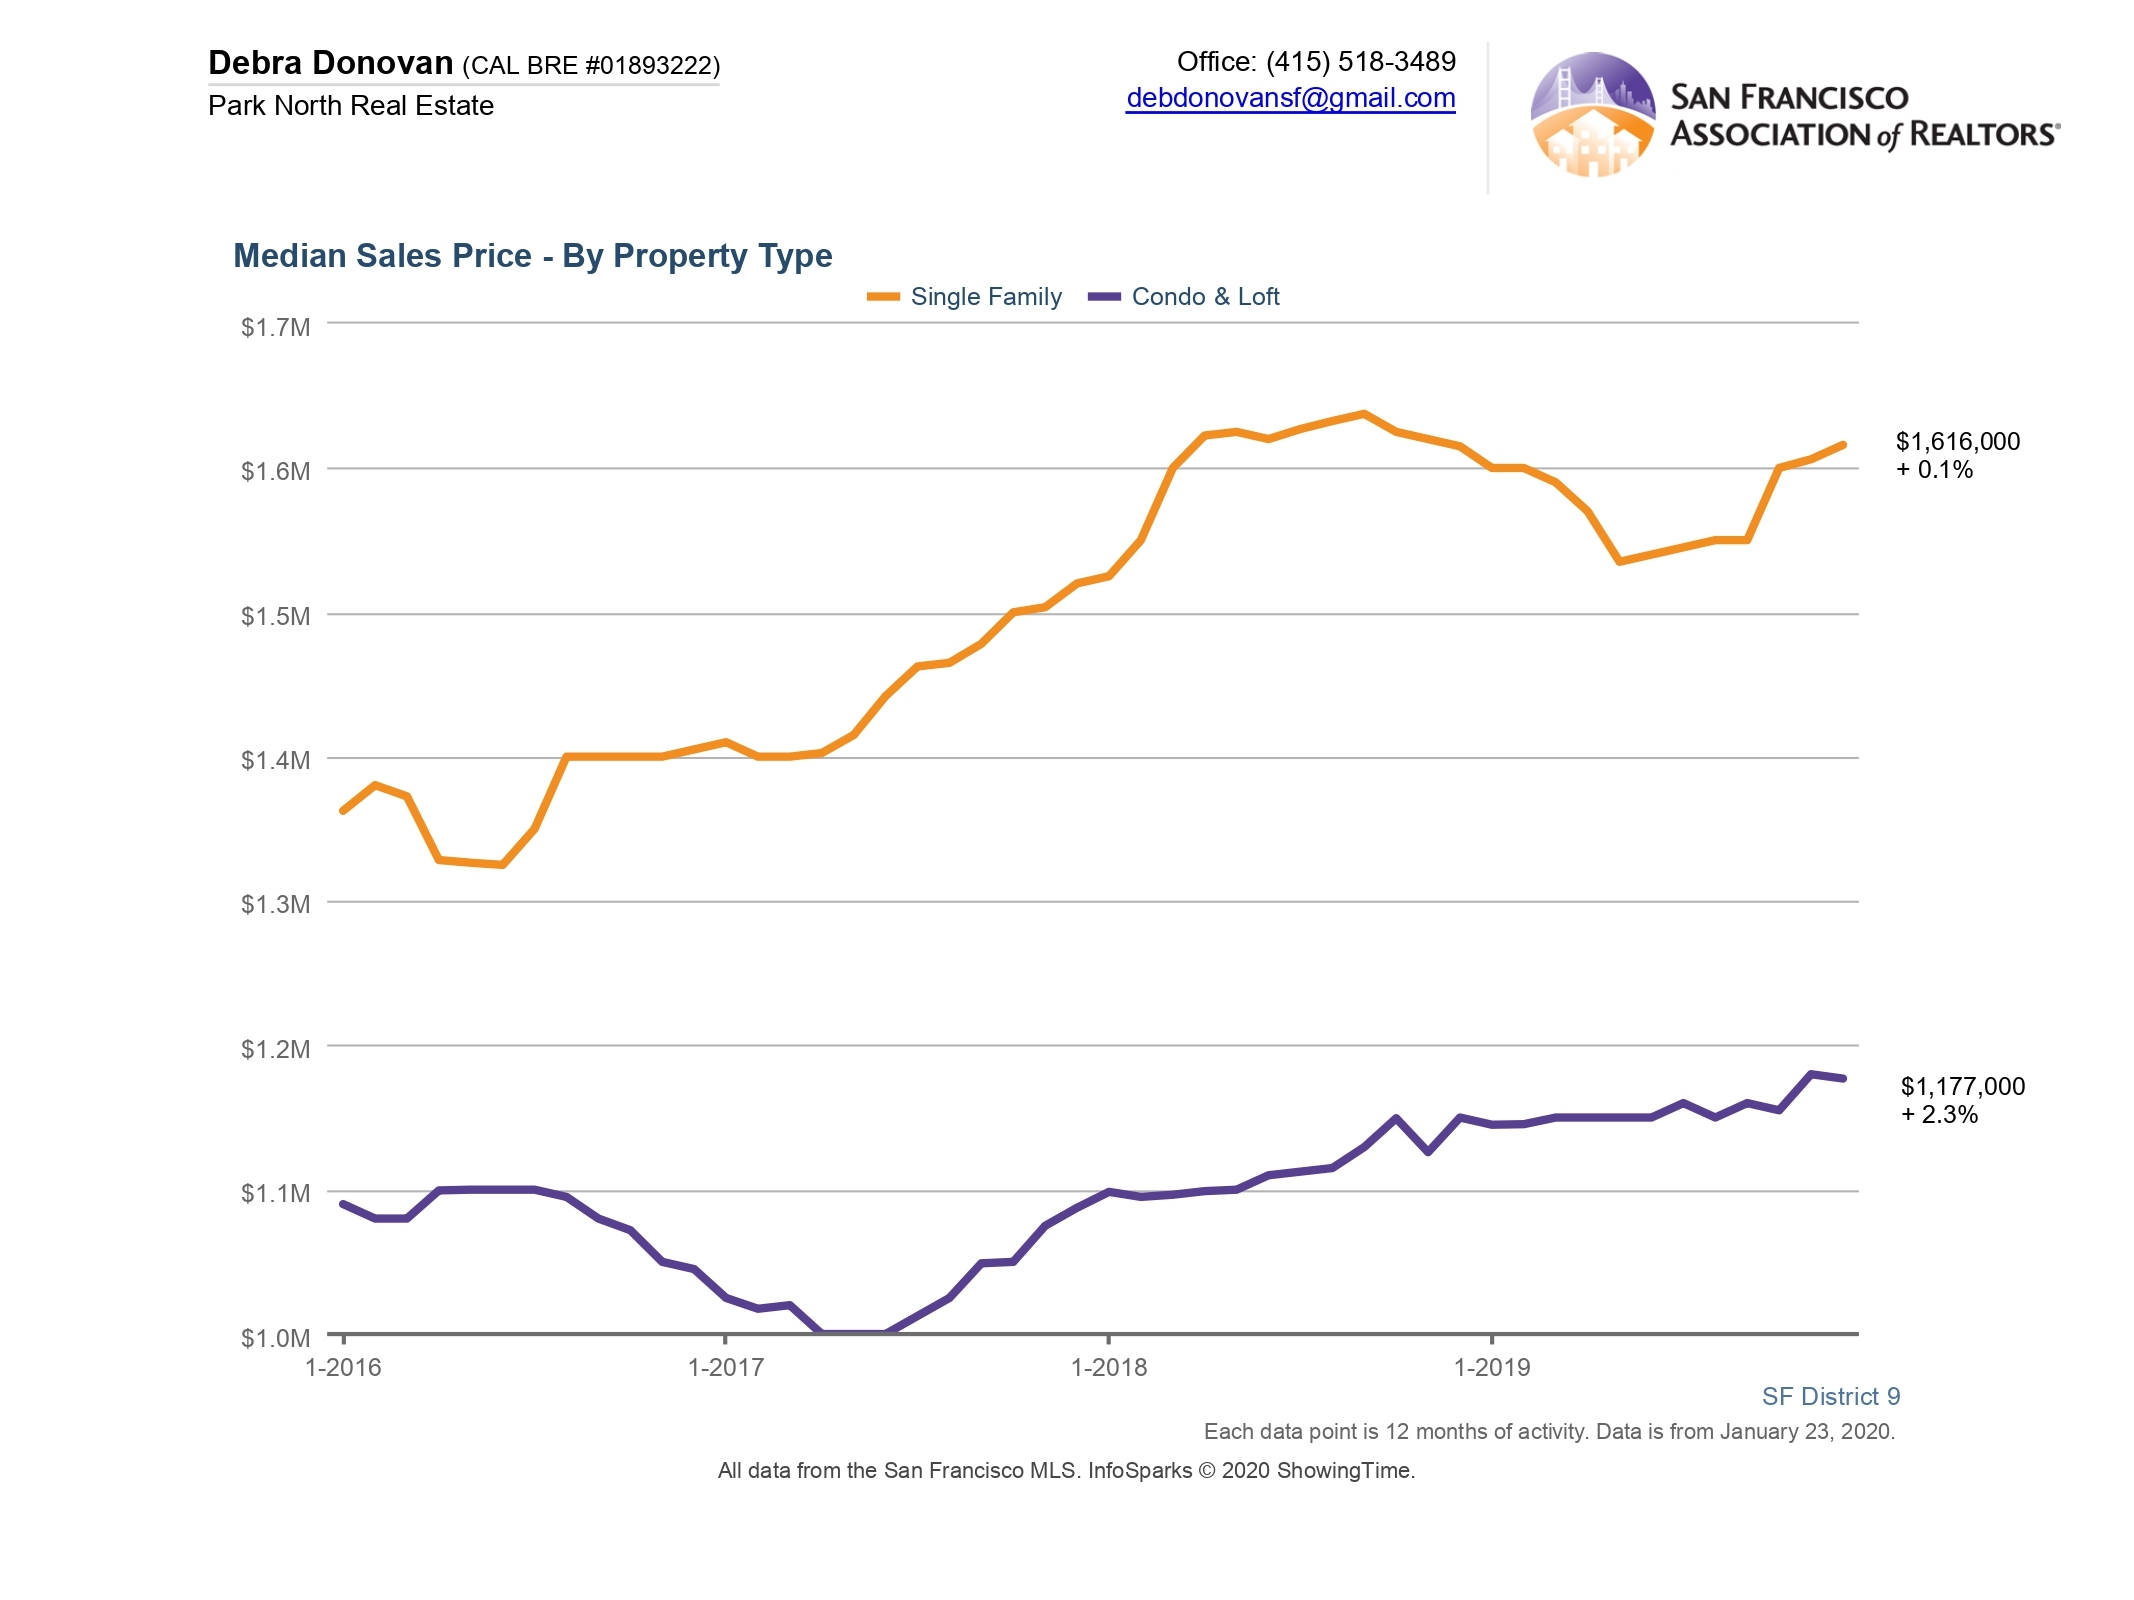
District 9: Central East. Includes Bernal Heights, Inner Mission, Mission Bay, Potrero Hill, South of Market, Yerba Buena, South Beach, Central Waterfront/ Dogpatch.
The median price for a single family homes in District 9 inched up just a smidge, 0.1%, to $1,616,000. Condo and loft prices increased 2.3% to $1,177,000.
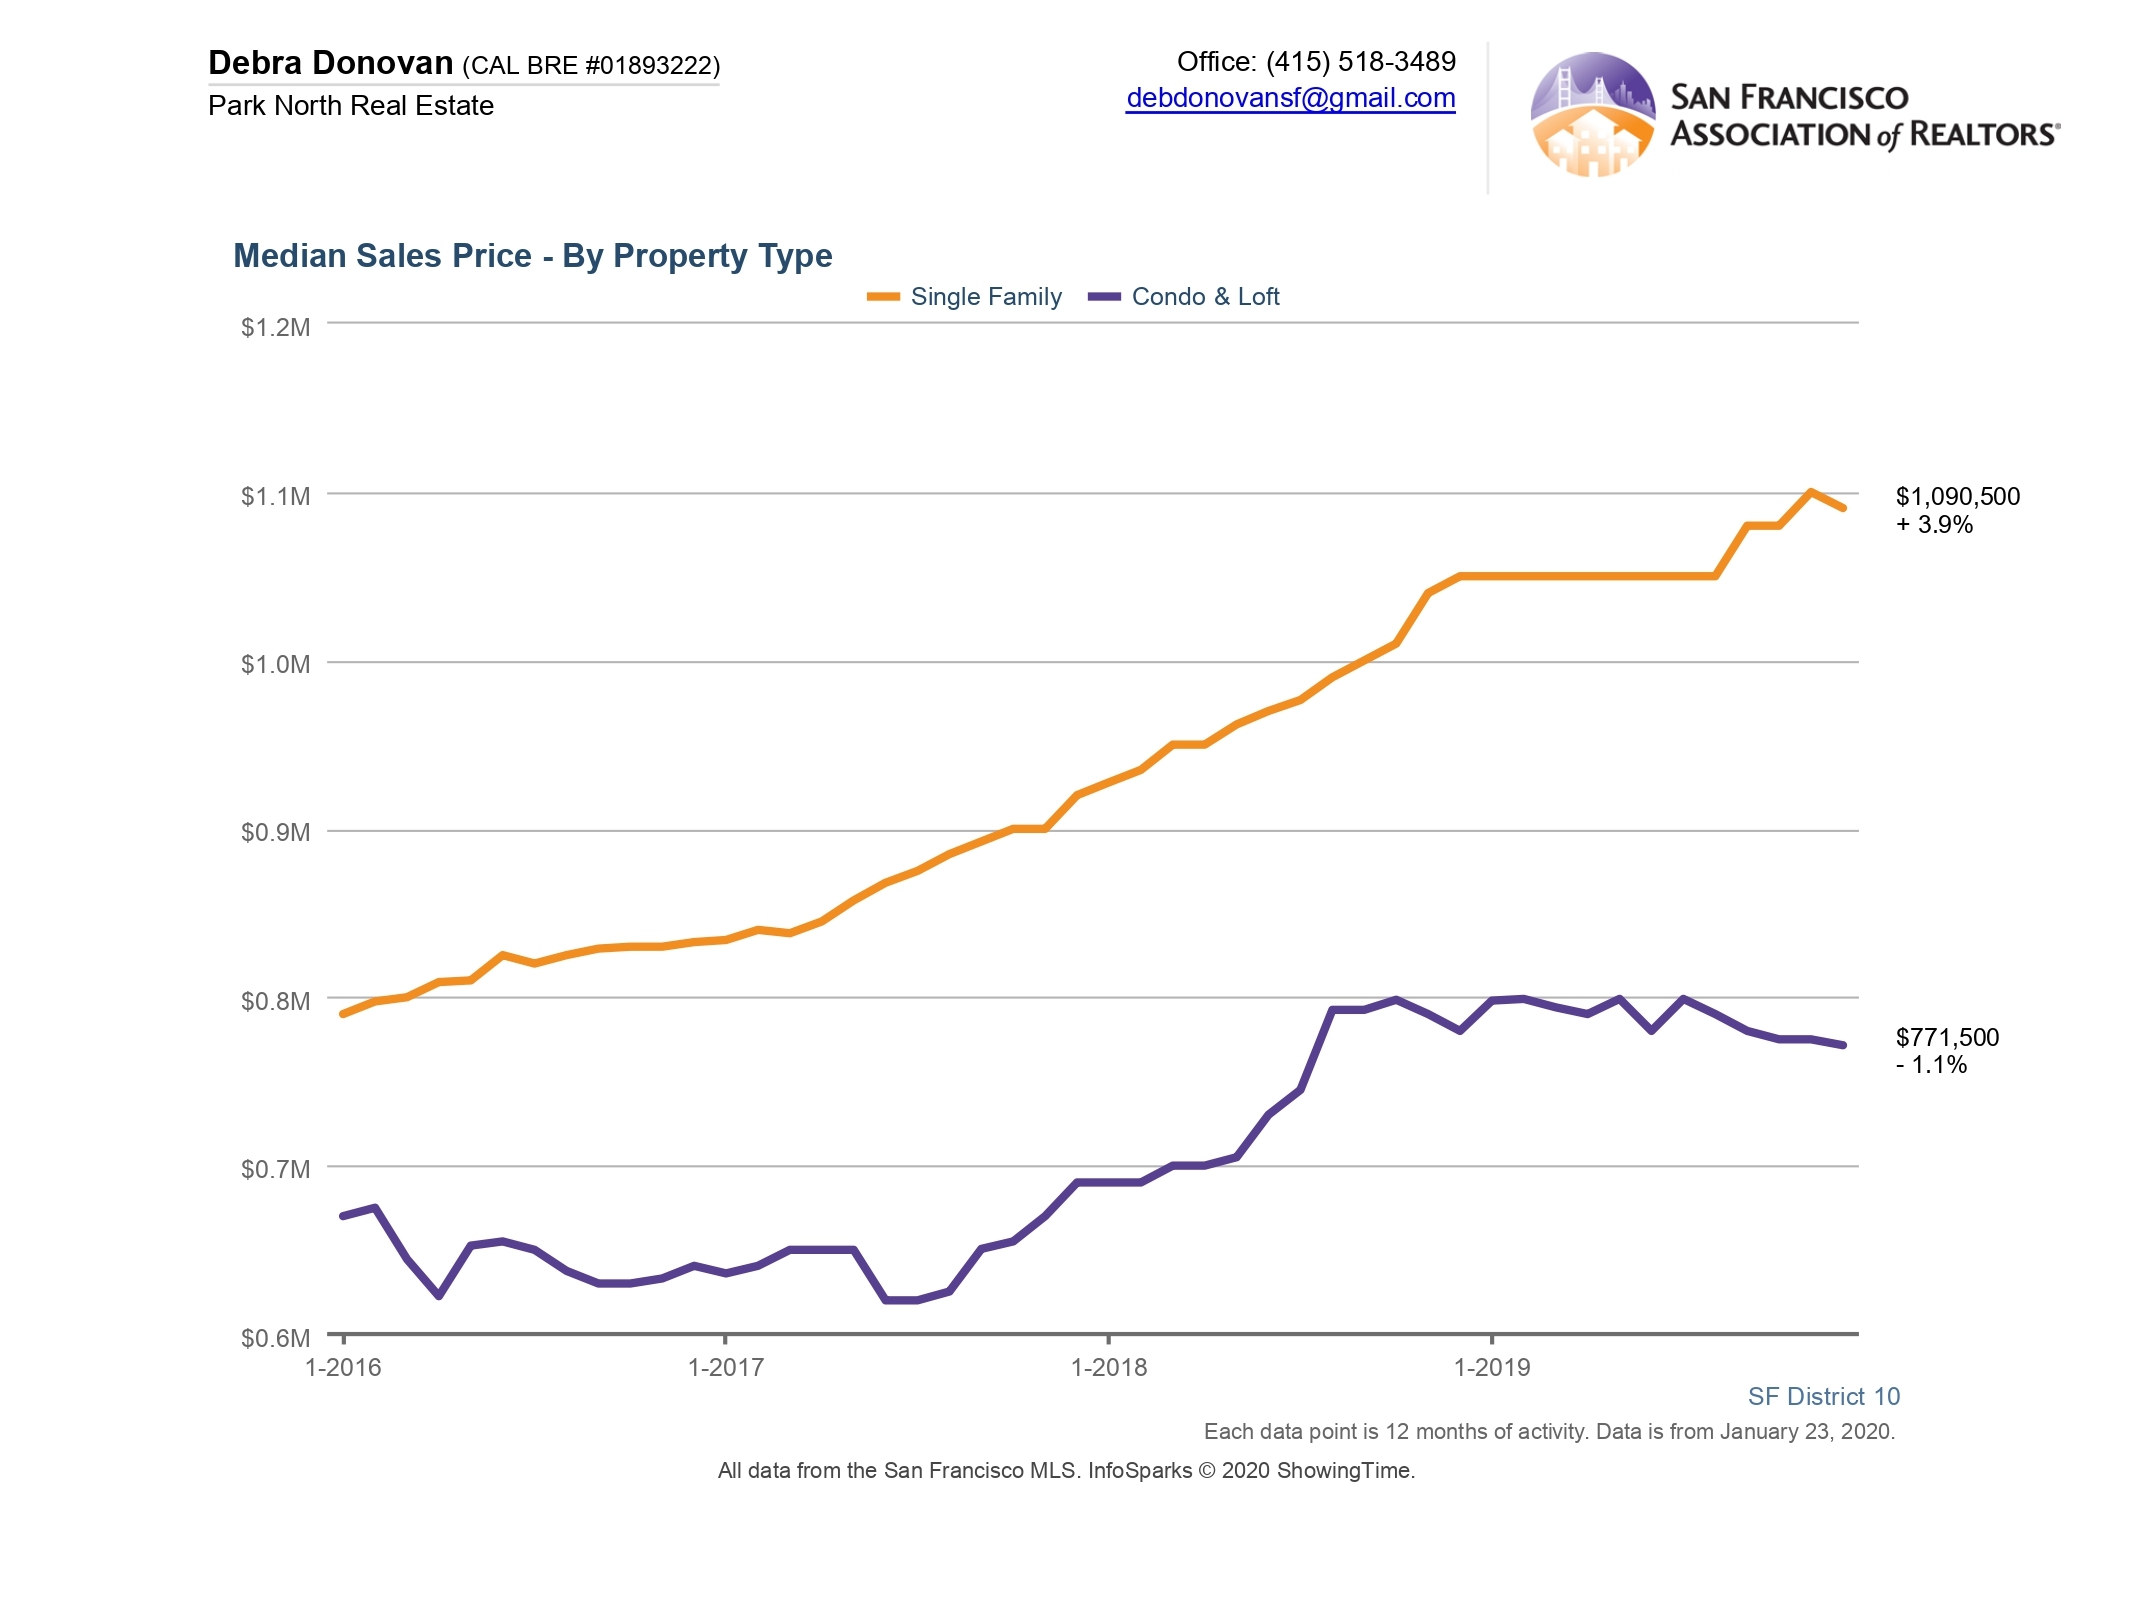
District 10: Southeast. Includes Bayview, Crocker Amazon, Excelsior, Outer Mission, Visitation Valley, Portola, Silver Terrace, Mission Terrace, Hunters Point, Bayview Heights, Candlestick Point, Little Hollywood.
Single family homes in District 10 increased 3.9% in median sales price in 2019 to $1,090,500. Condo and loft prices, on the other hand, decreased 1.1% to $771,500.
The fine print: All information deemed reliable but not guaranteed or warranted. Data comes from MLS so does not include off-market and most new construction condo sales. The San Francisco real estate market is dynamic so statistics can change on a daily basis. These statistics are meant to be a snapshot of the day and time they were pulled.