Inventory continued to be strong in October although some…but not all…homes were stitting on the market longer than in months past. The majority of homes are still selling for over their list price, though the percentage over that price is less than we’ve seen previously. This is particularly true for single family homes, which for many months have seen great comeptition. In October the months supply of inventory for single family homes reached 2 1/2 months, which was lower than the previous month but still up double digits compared to the same month last year.
This may be the result of continually rising interest rates, a mercerial stock market, or anxiety before the November midterm elections. Still, the economy remains strong and it’s still a seller’s market. See below for the October statistics.
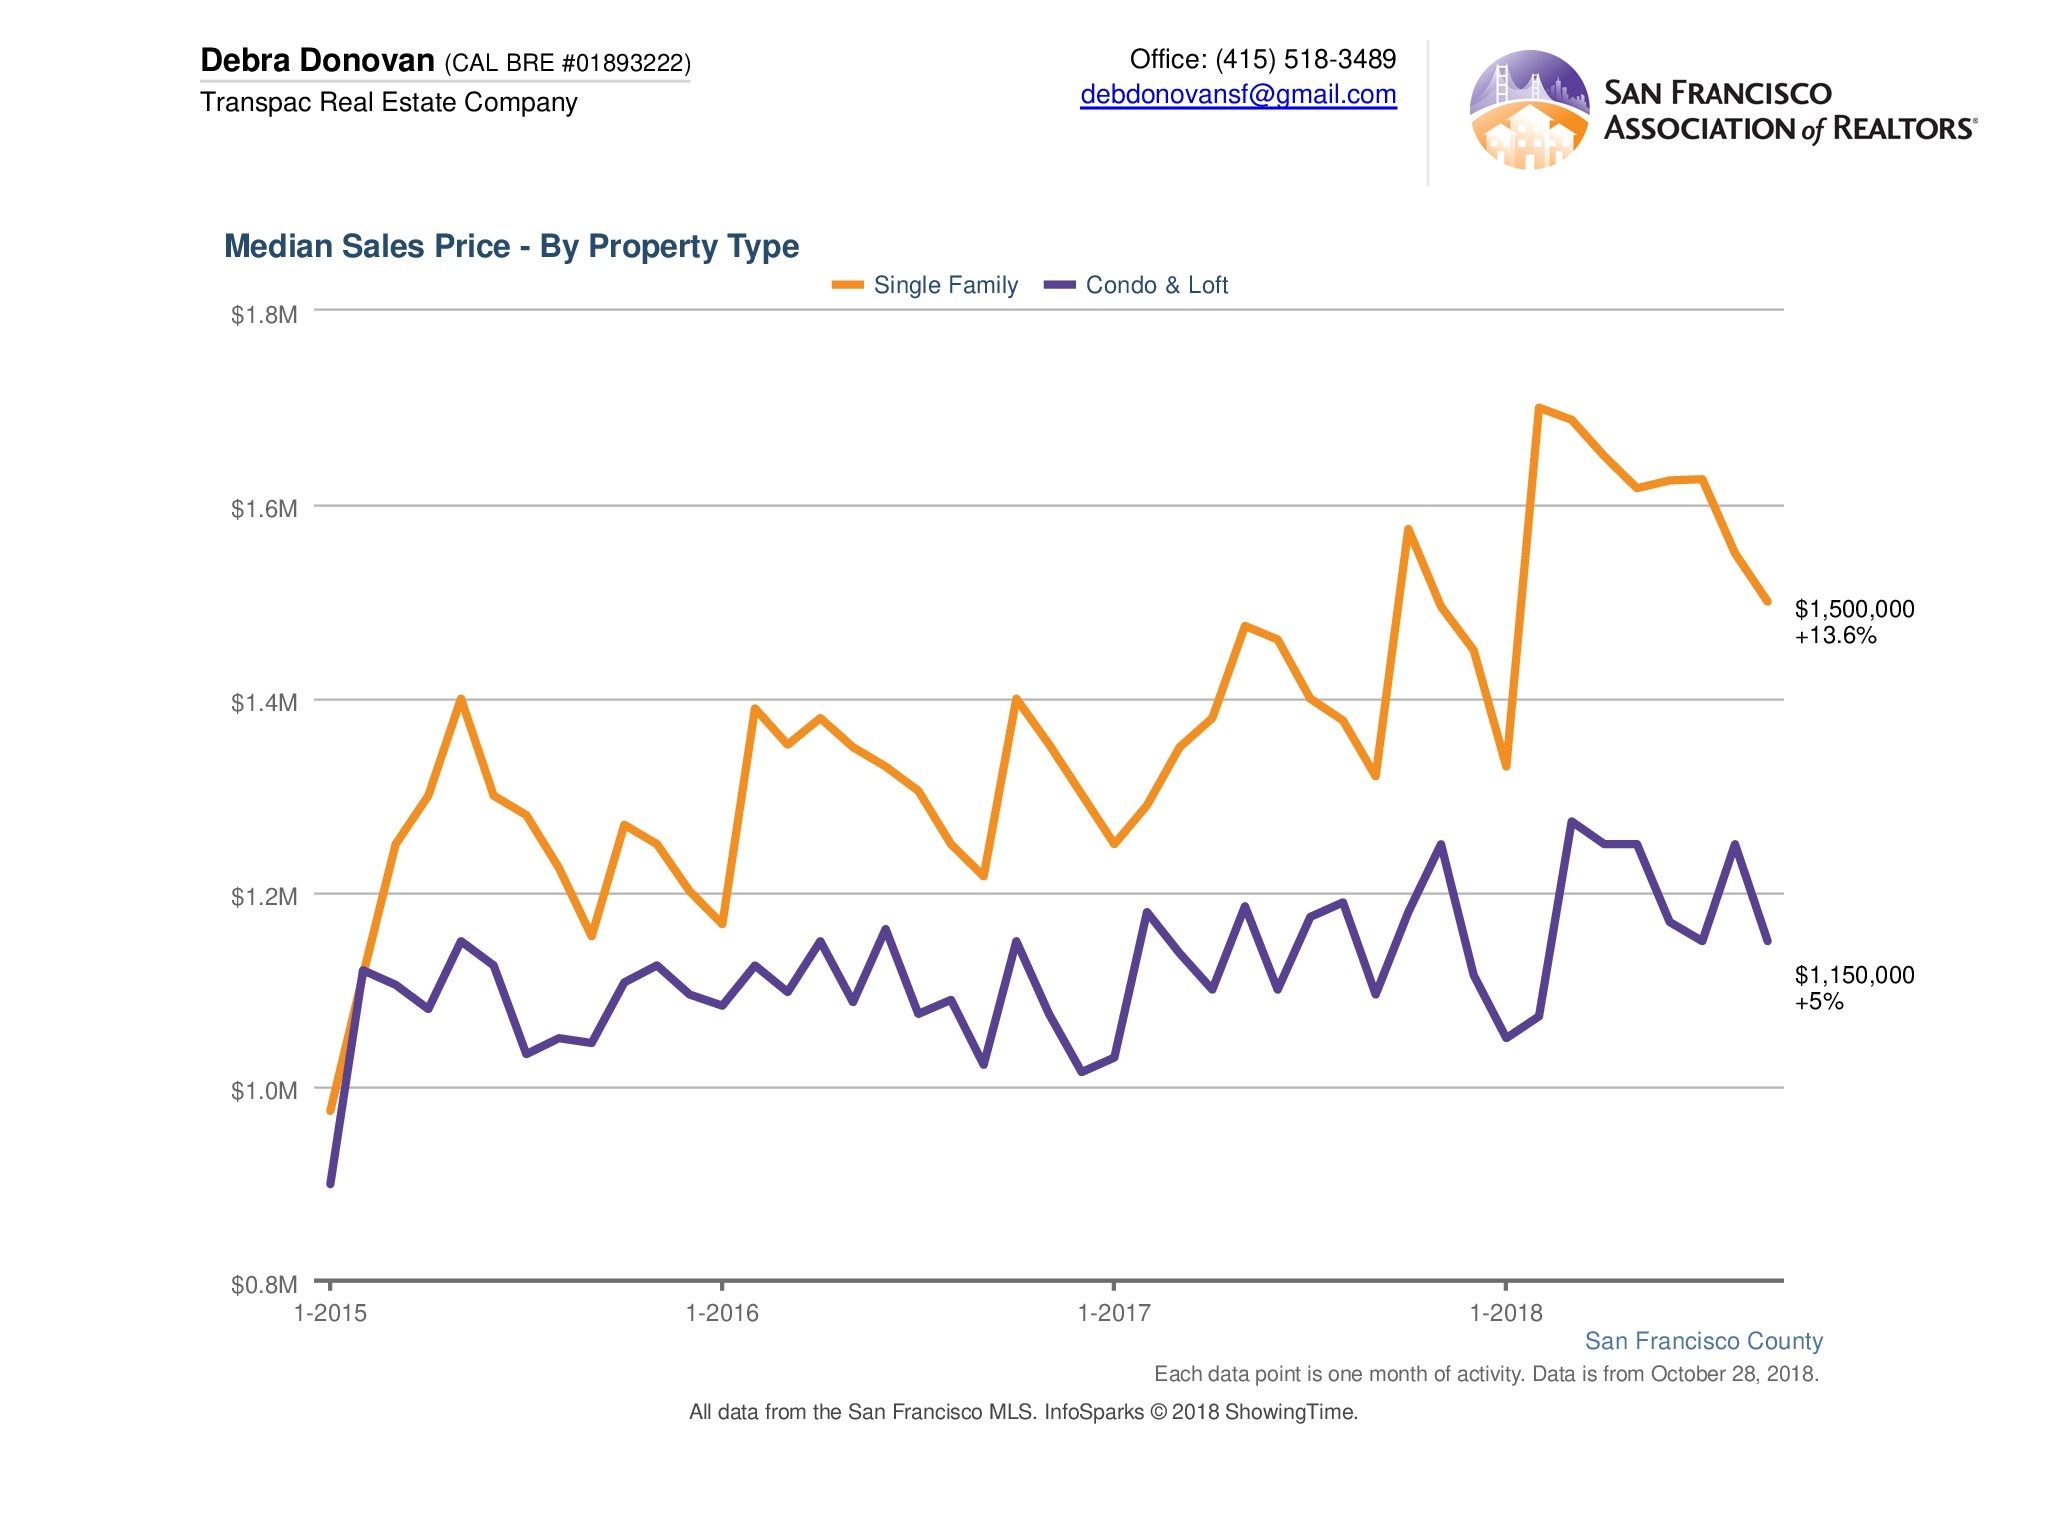
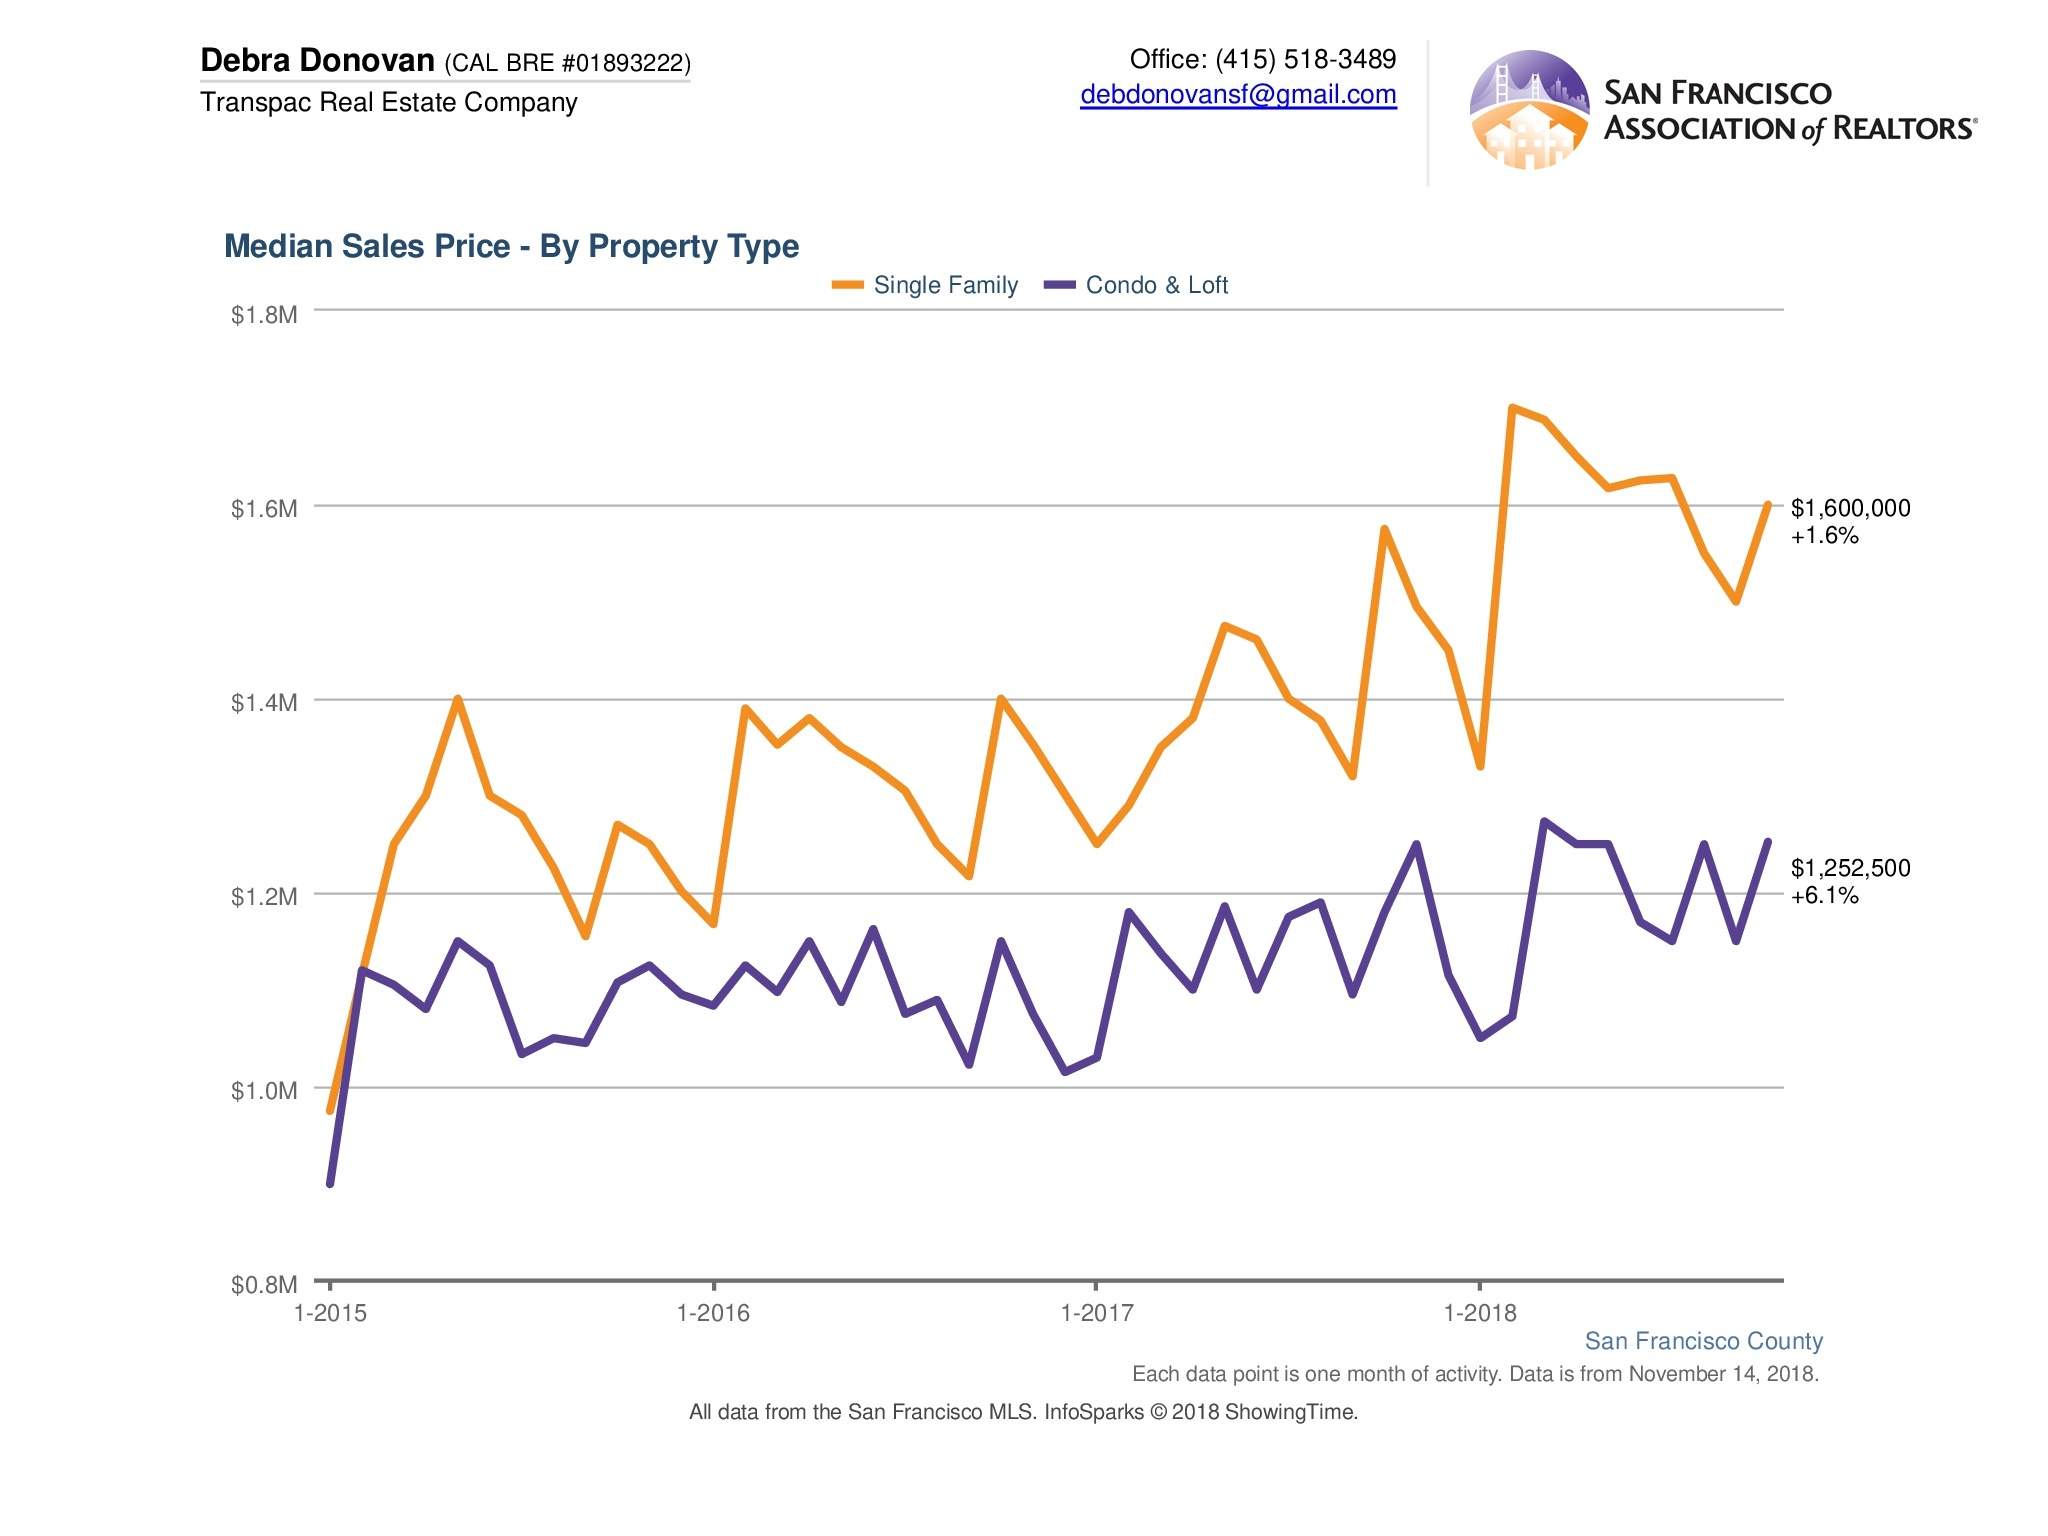
Median Sales Price:
Median sales prices for single family homes remained lofty at $1.6 million in October. However, as we’ve seen, the rate at which prices have been increasing is slowing. Compared to October 2017, the median price increased only 1.6%. Condos and lofts saw a greater increase of 6.1% compared to the same month last year with a median price of $1,252.500.
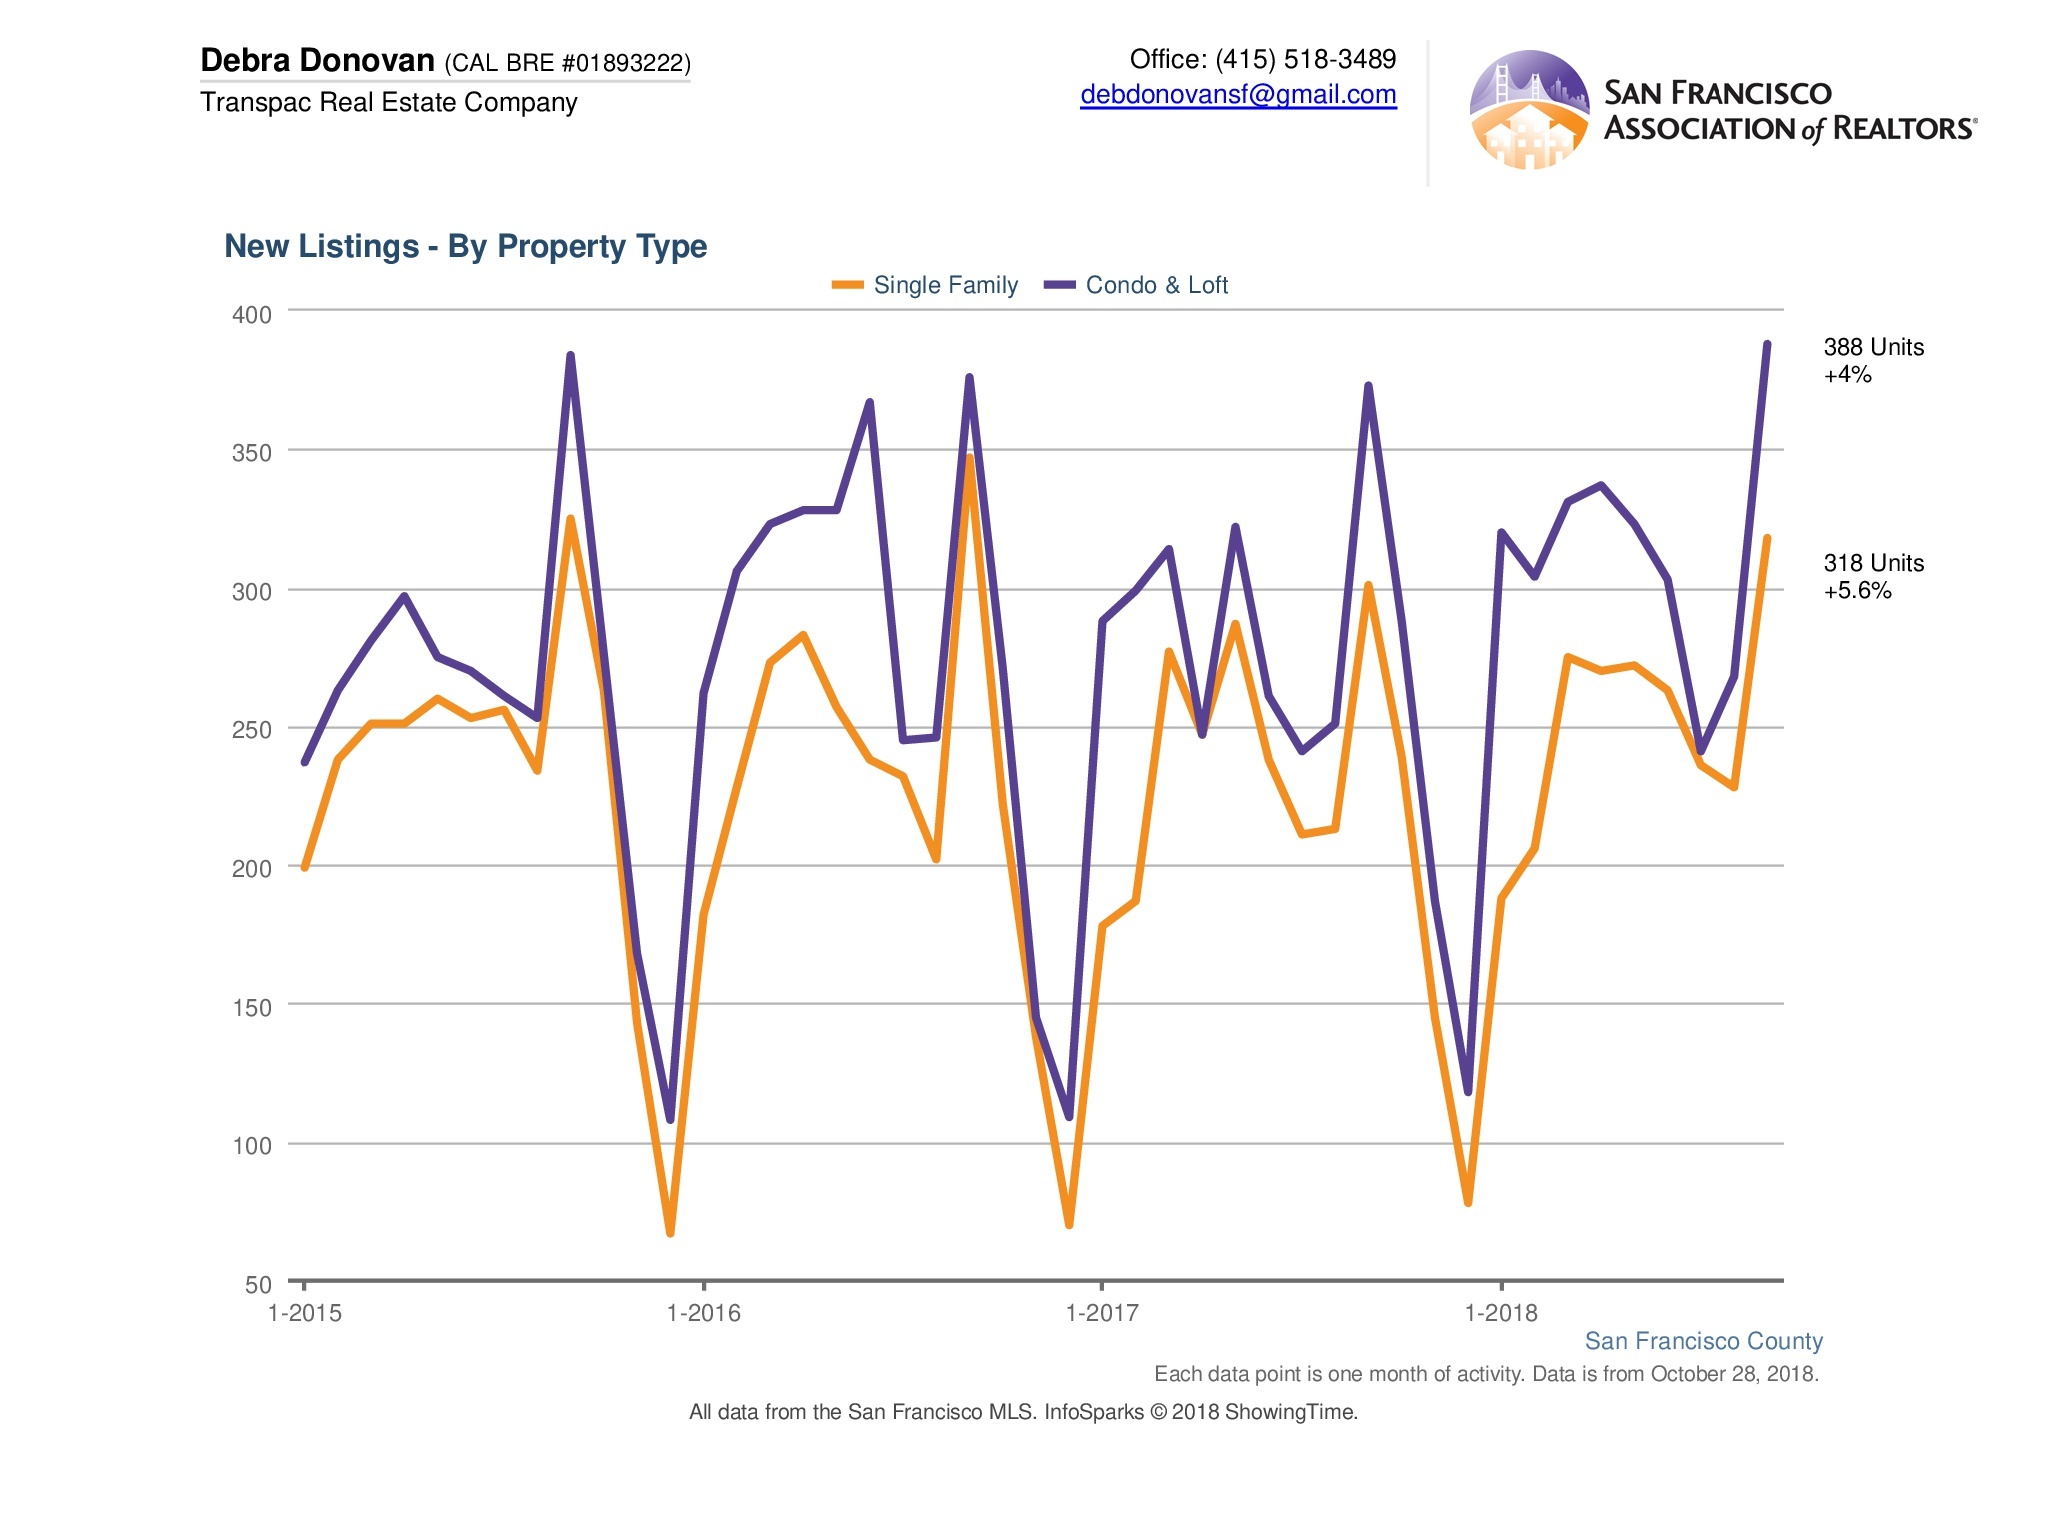
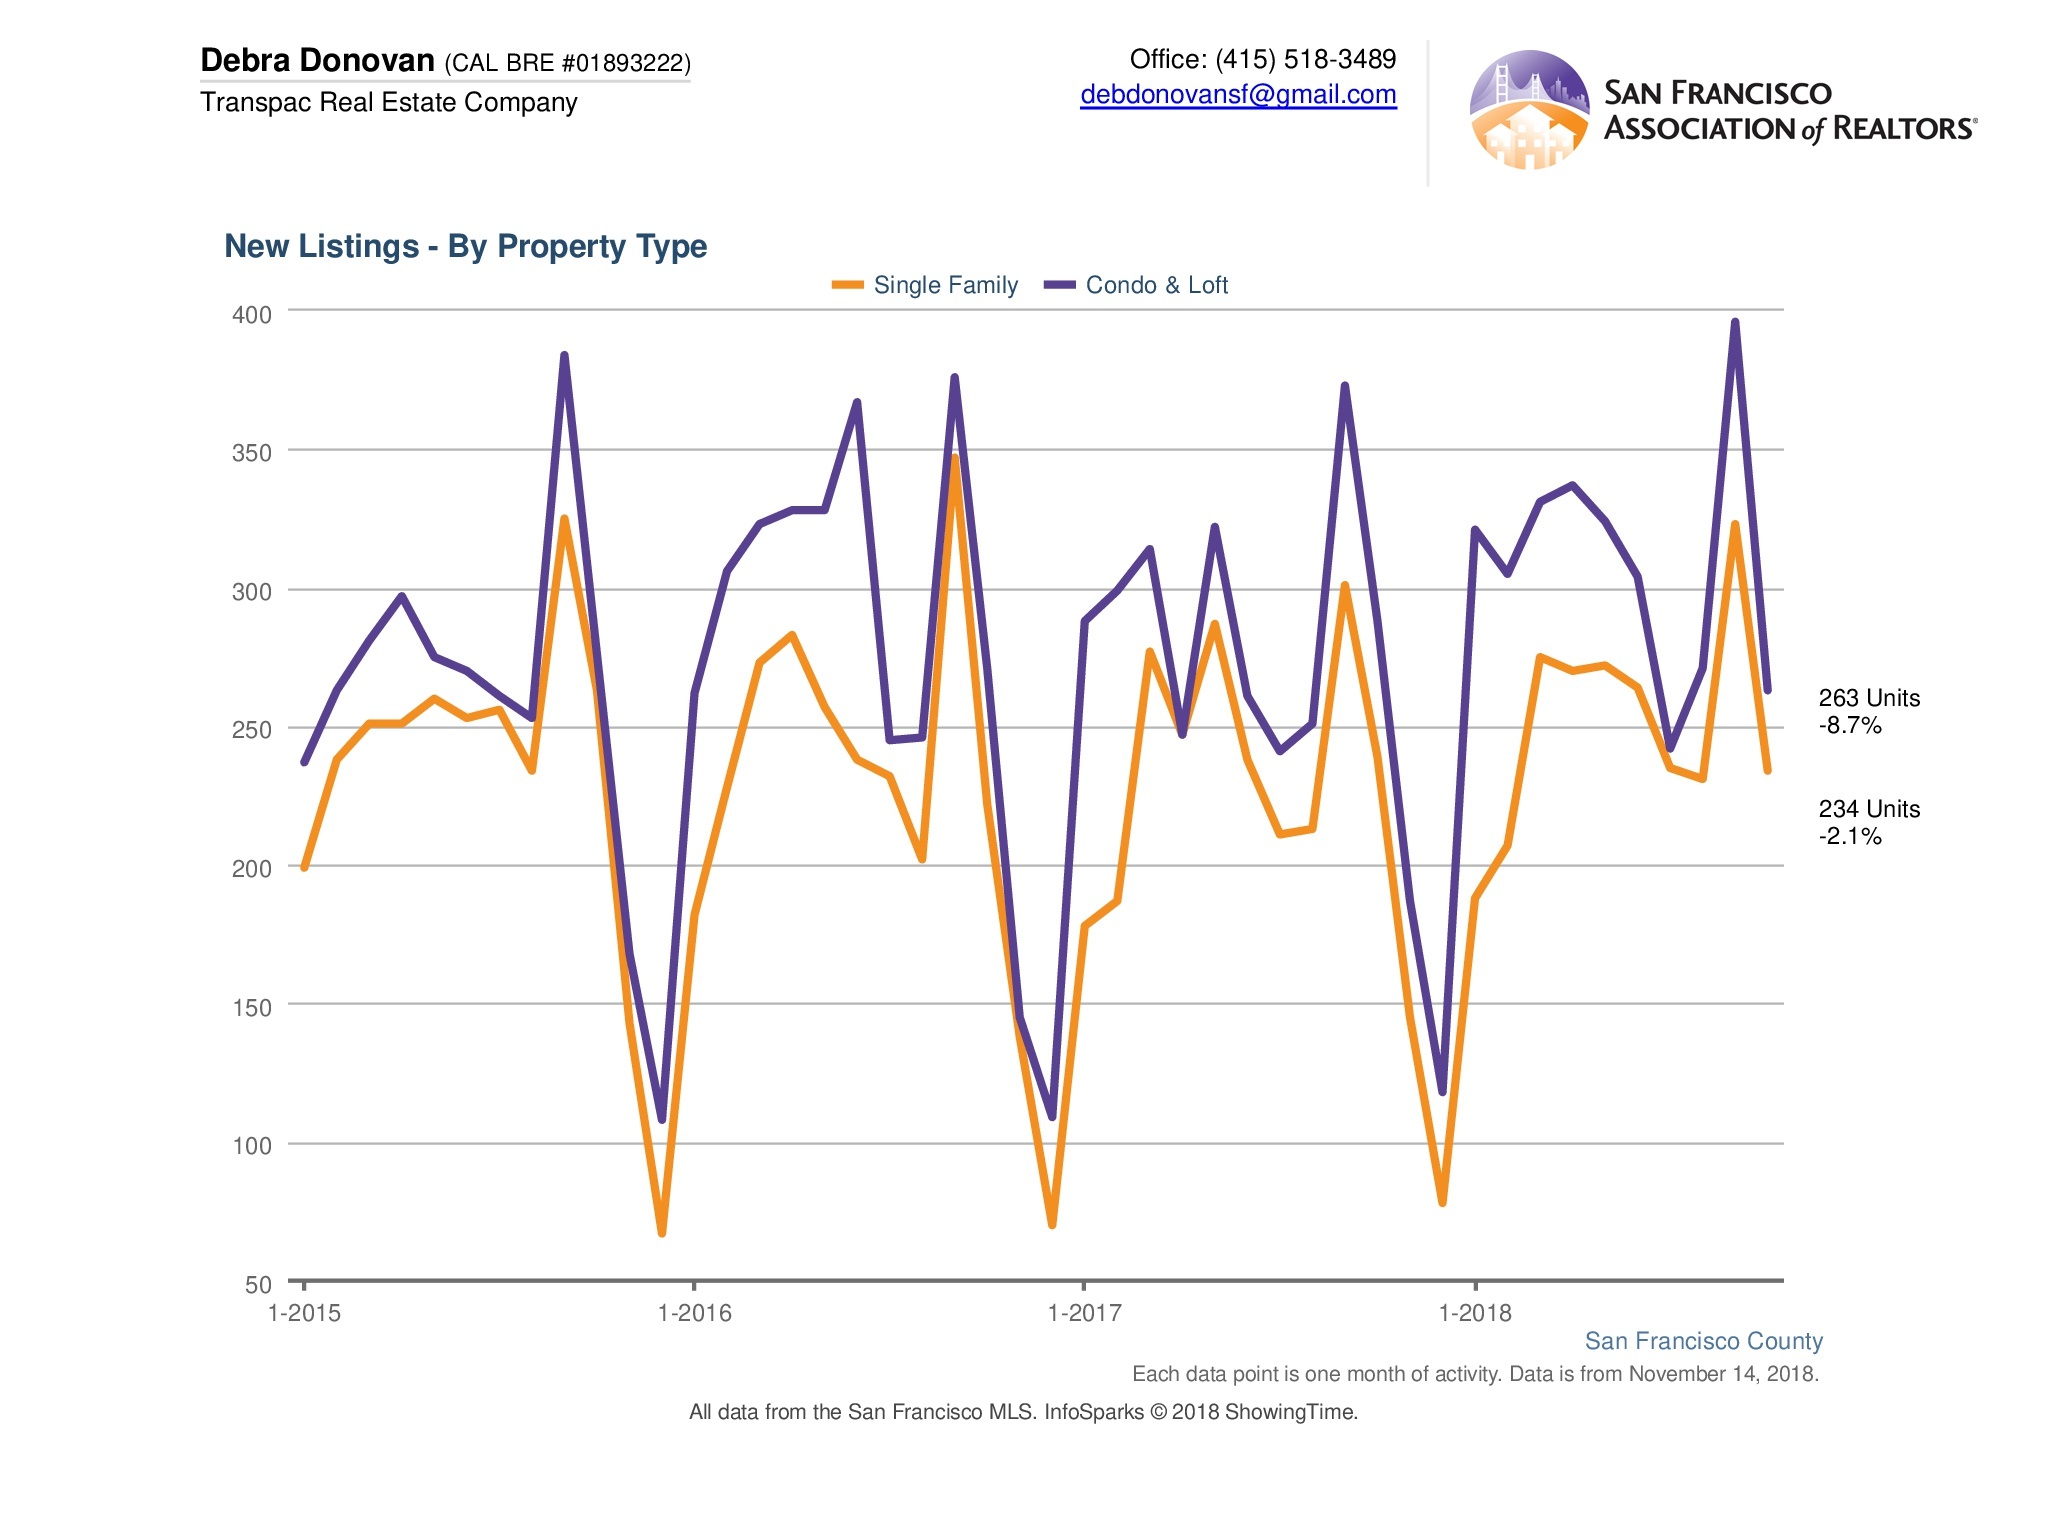
New Listings:
Fewer new listings came on the market compared to last month and October last year. New listings for single family homes were down just over 2% while new condo and loft listings were down 8.7% compared to this time last year.
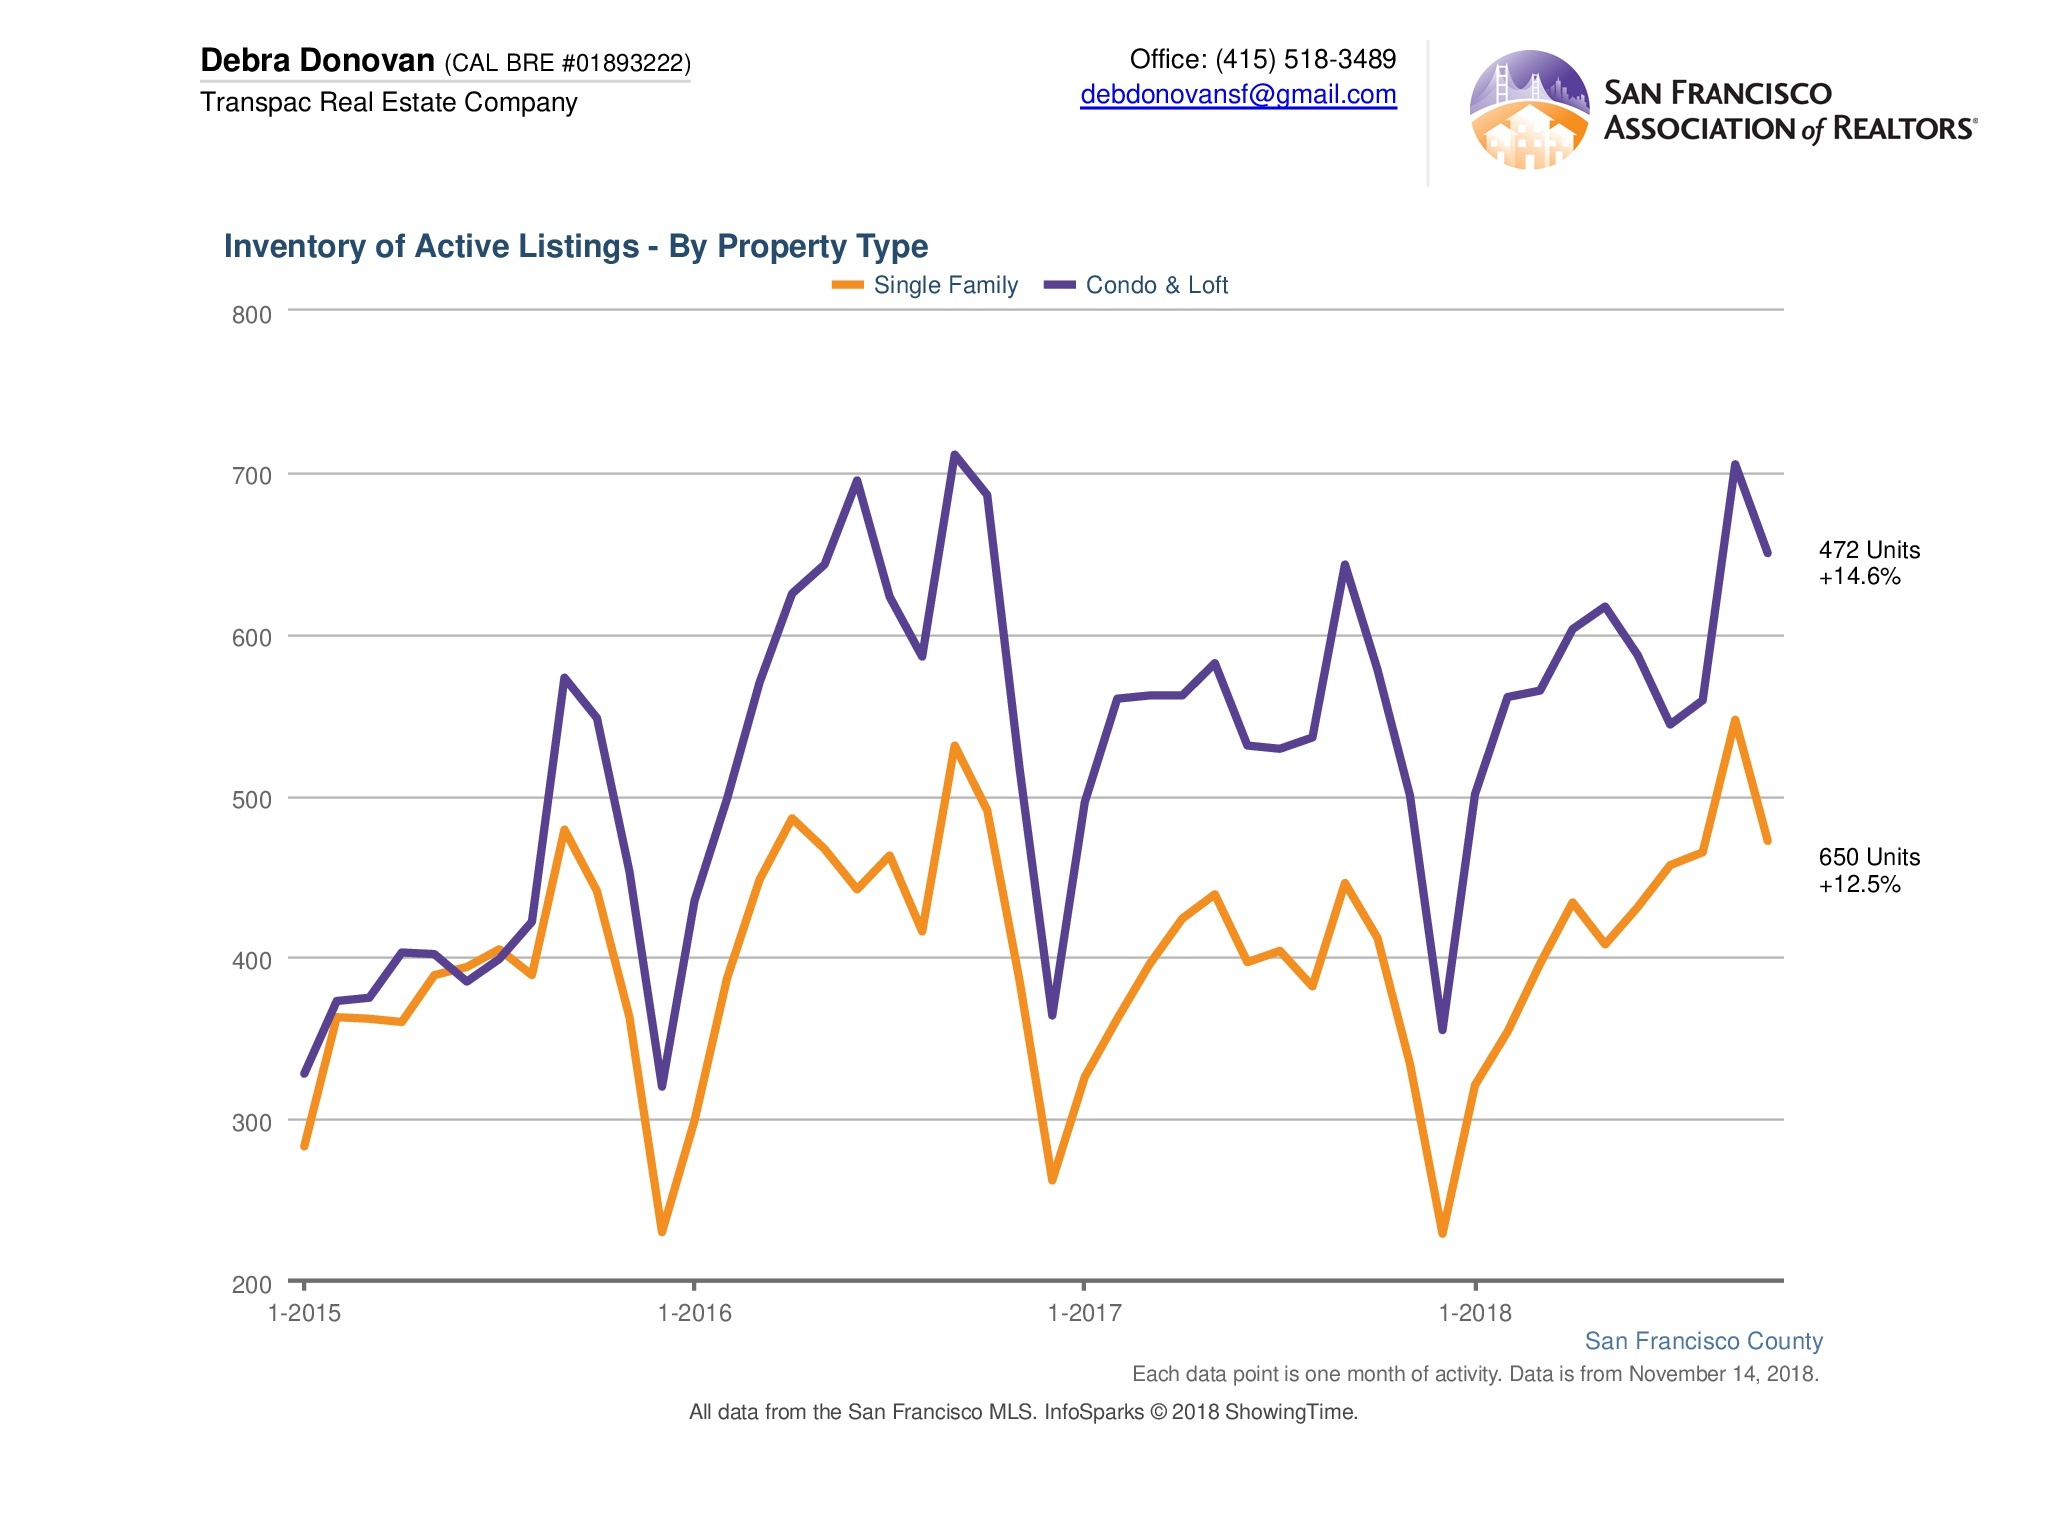
Active Listings:
Active listings were up in October, meaning homes are spending more time on the market and there’s more inventory still available at the end of the month. Single family home active listings were up 14.6% compared to the same month last year, and condo’s and lofts were up 12.5%.
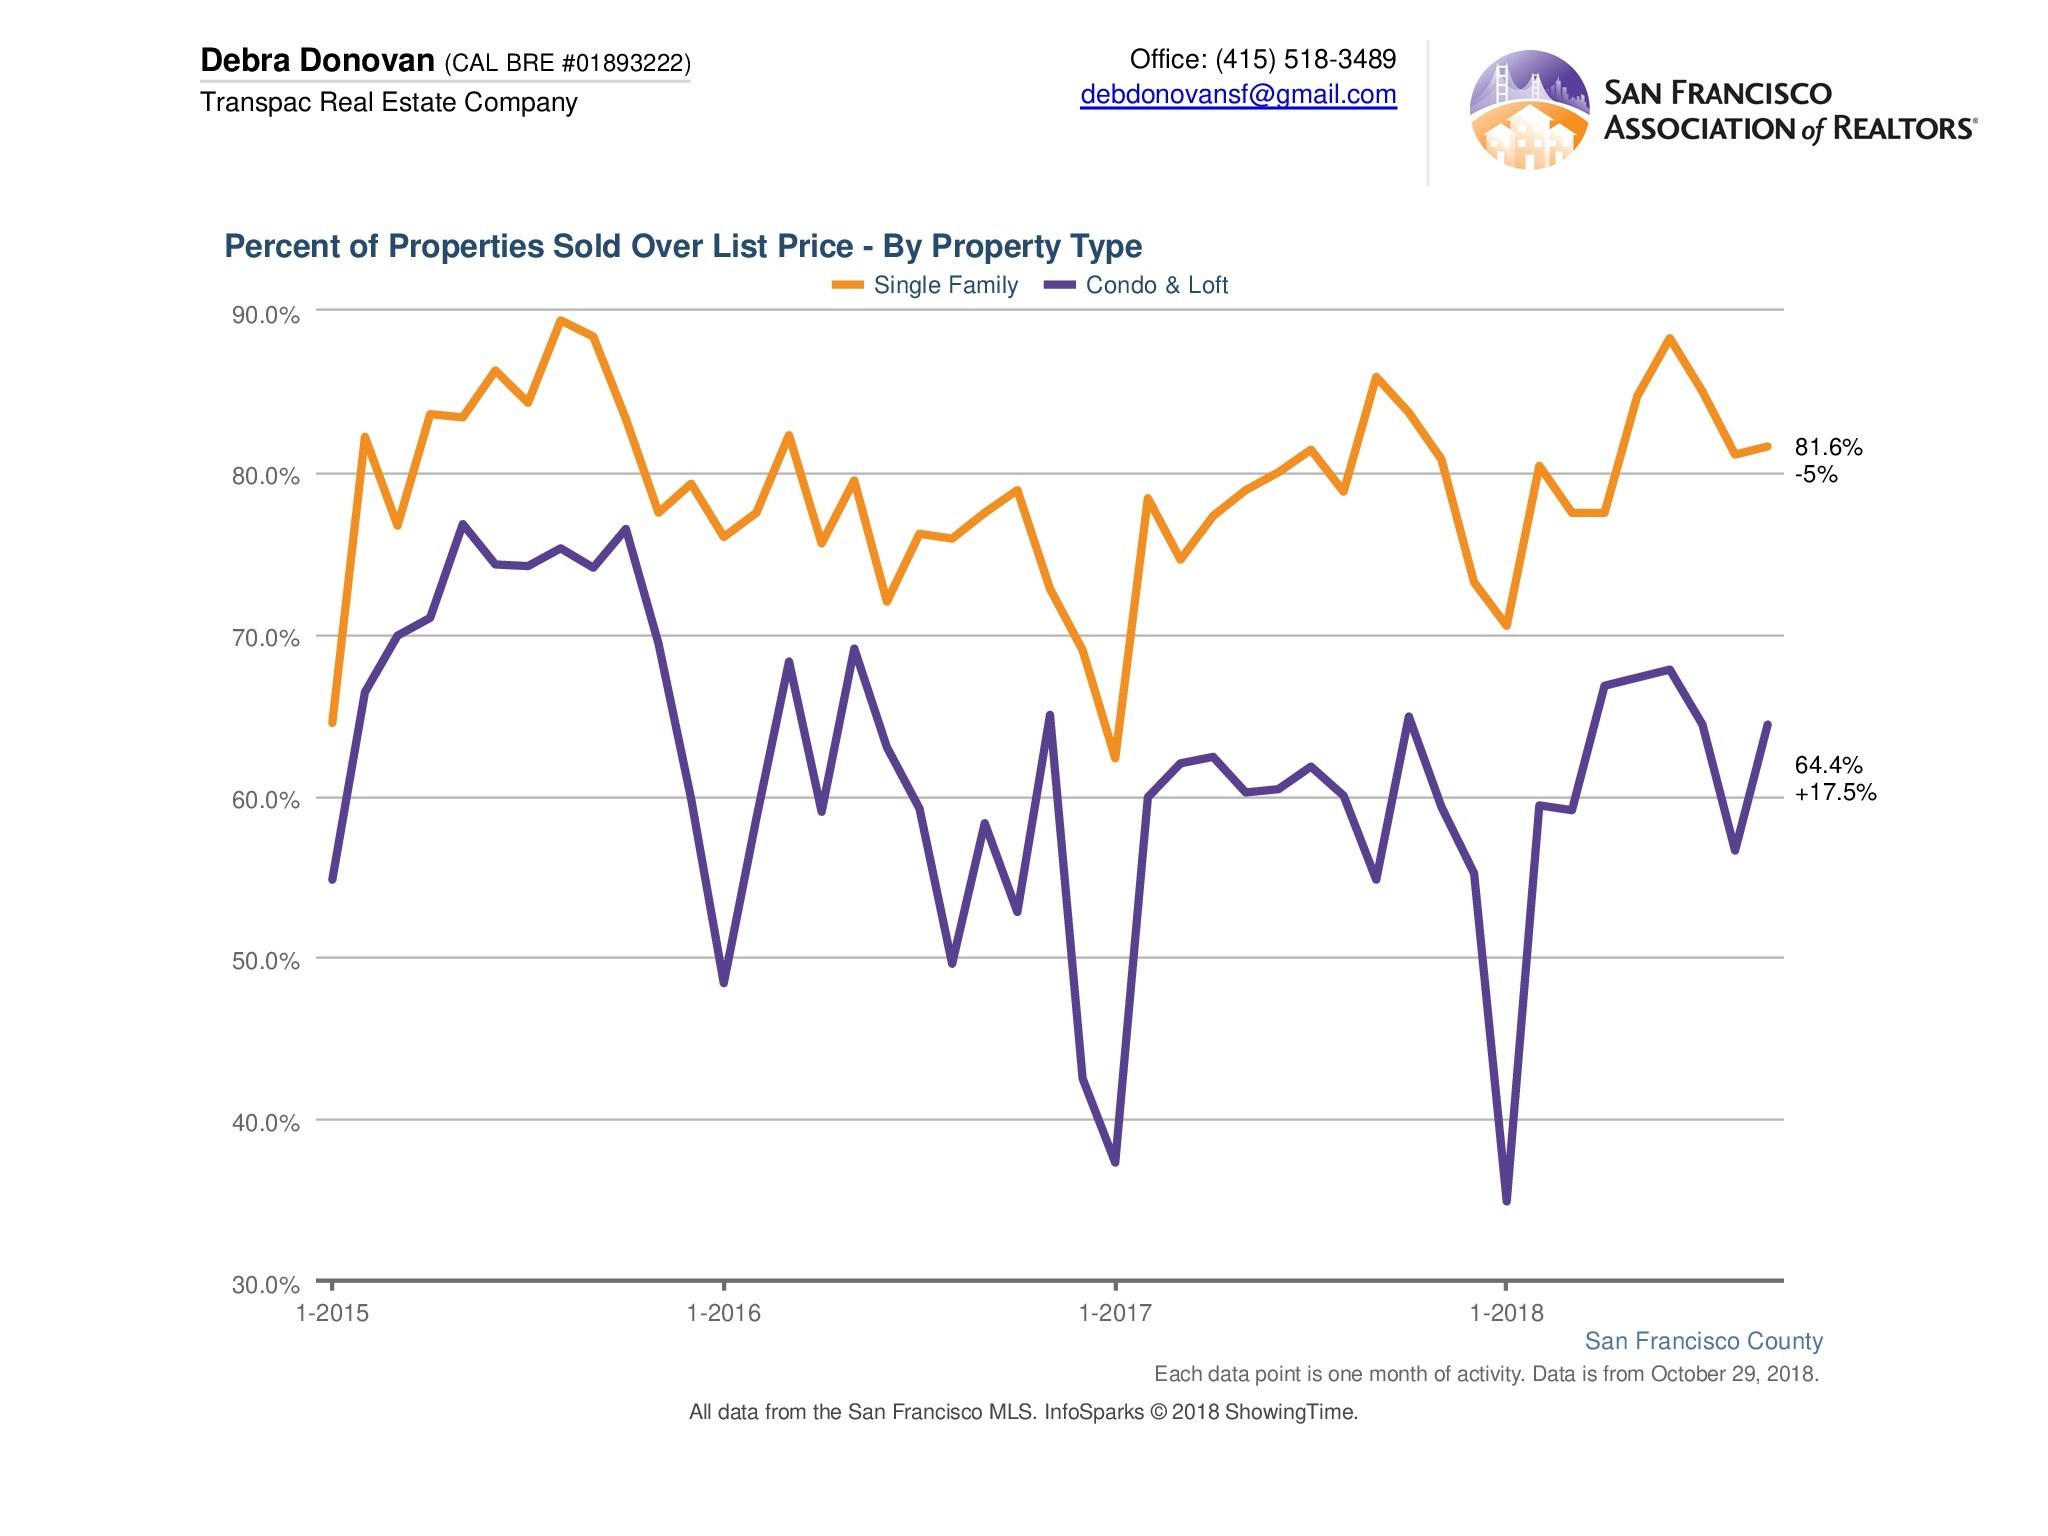
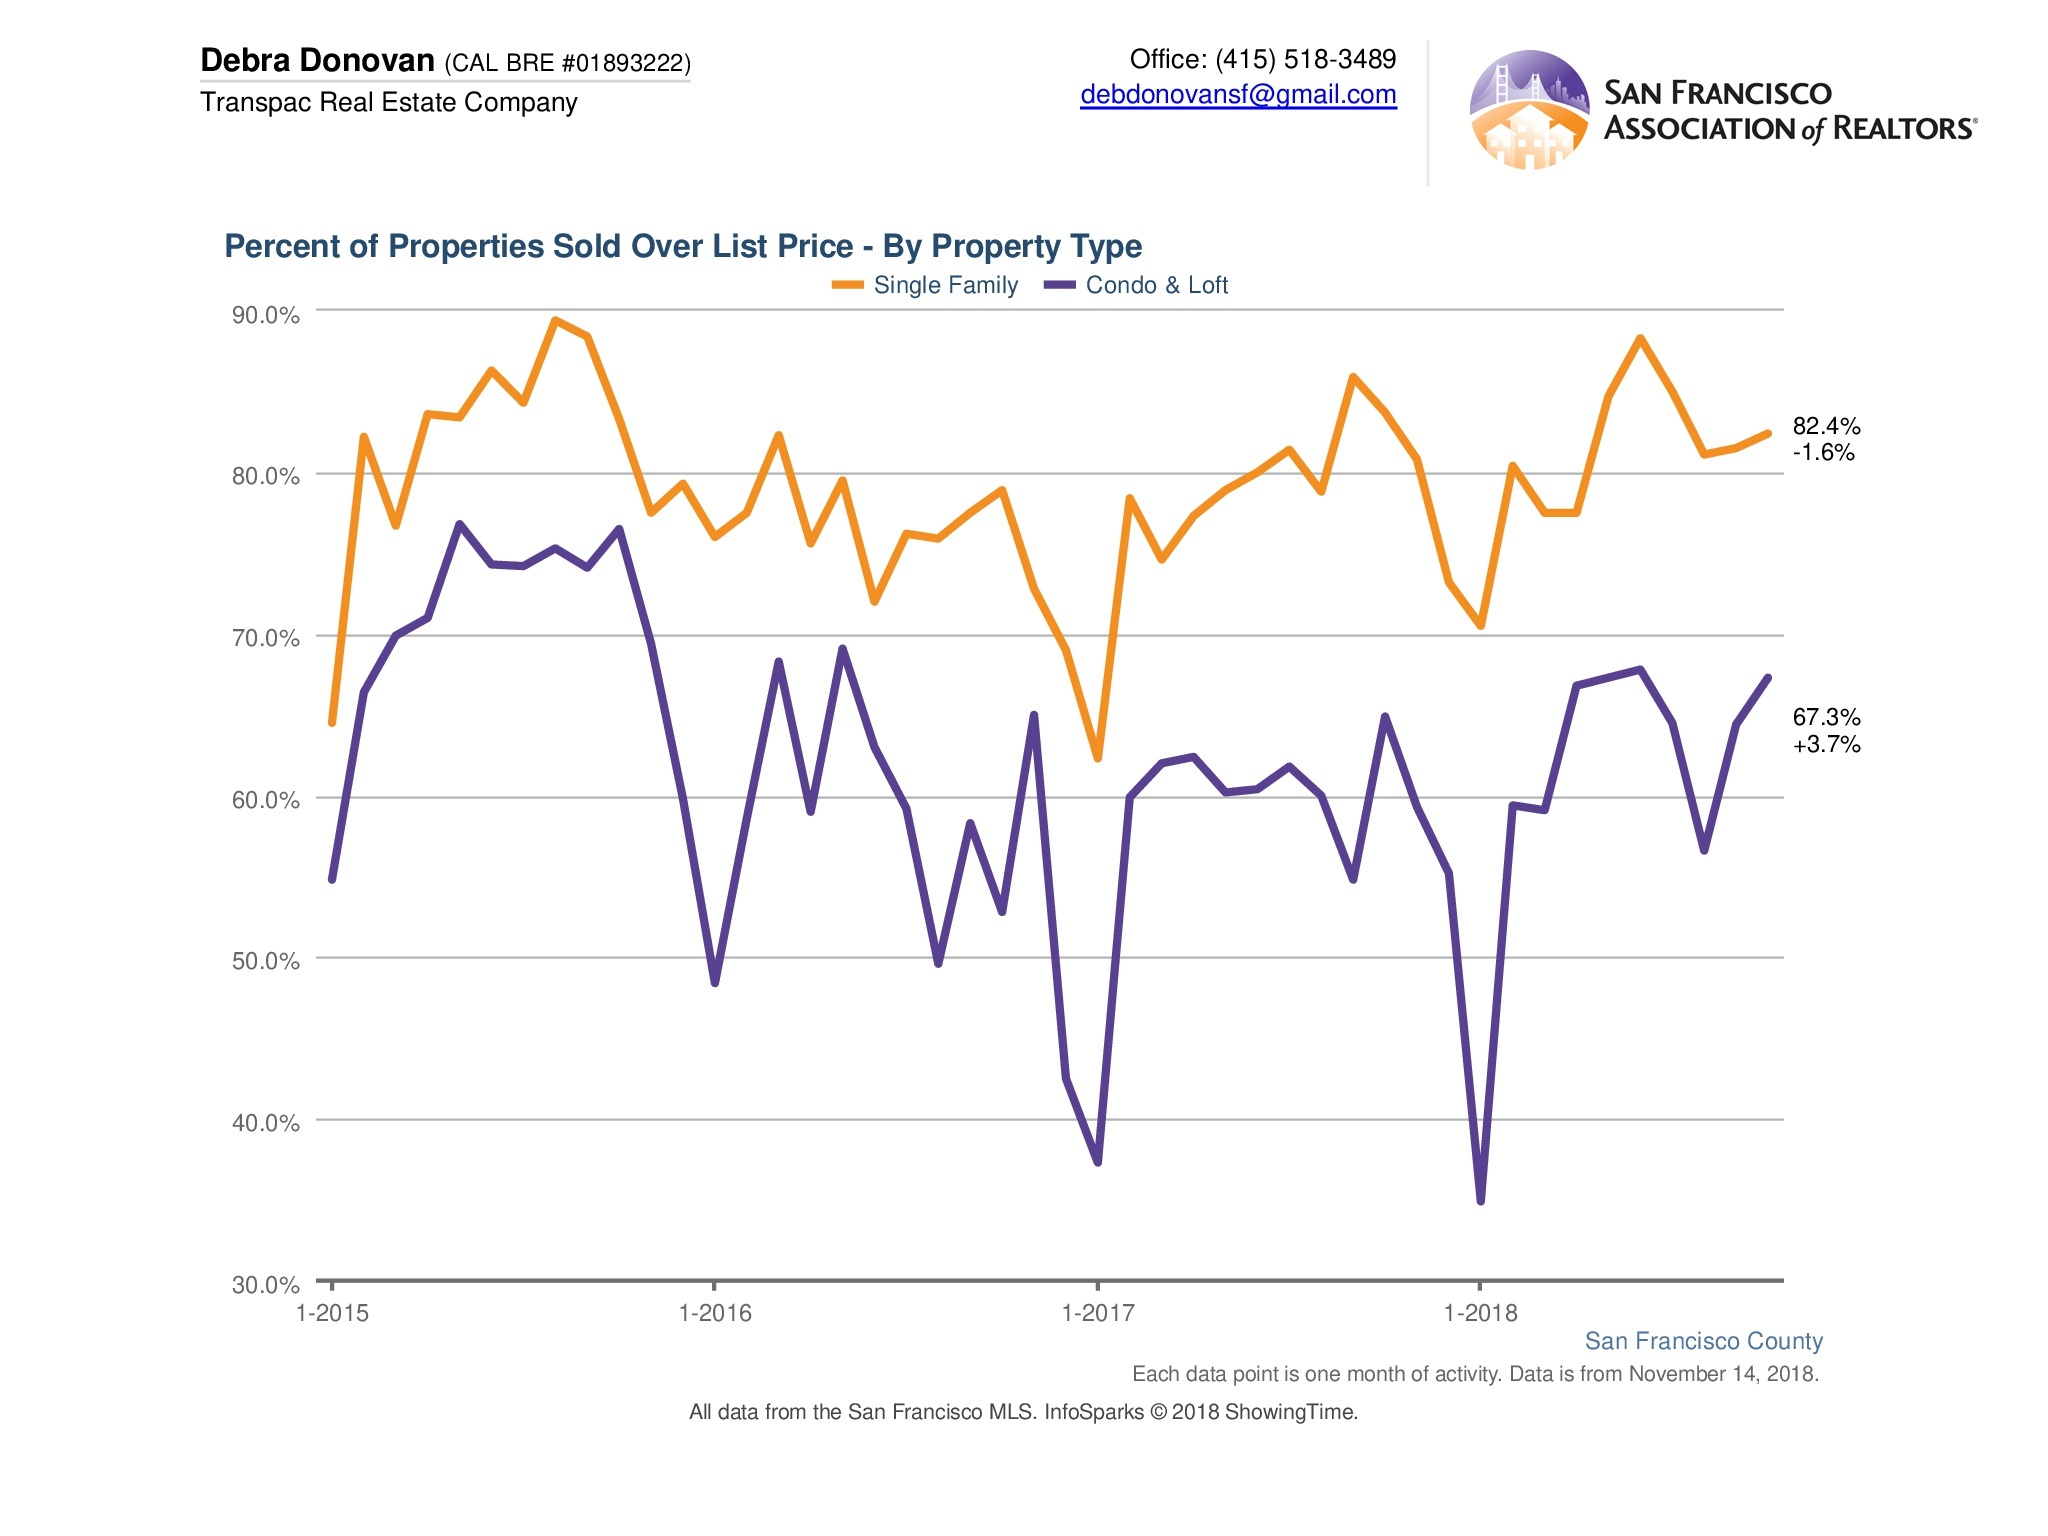
Percentage Sold Over List Price:
The vast majority of single family homes continue to sell for over their list price, though that percentage is slowly decreasing. In October, over 82% of single family homes sold for over their list price which is a 1.6% decrease compared to the same month last year. Two-thirds of condos and lofts sold for over their asking price, which was a 3.7% increase compared to the same month last year.
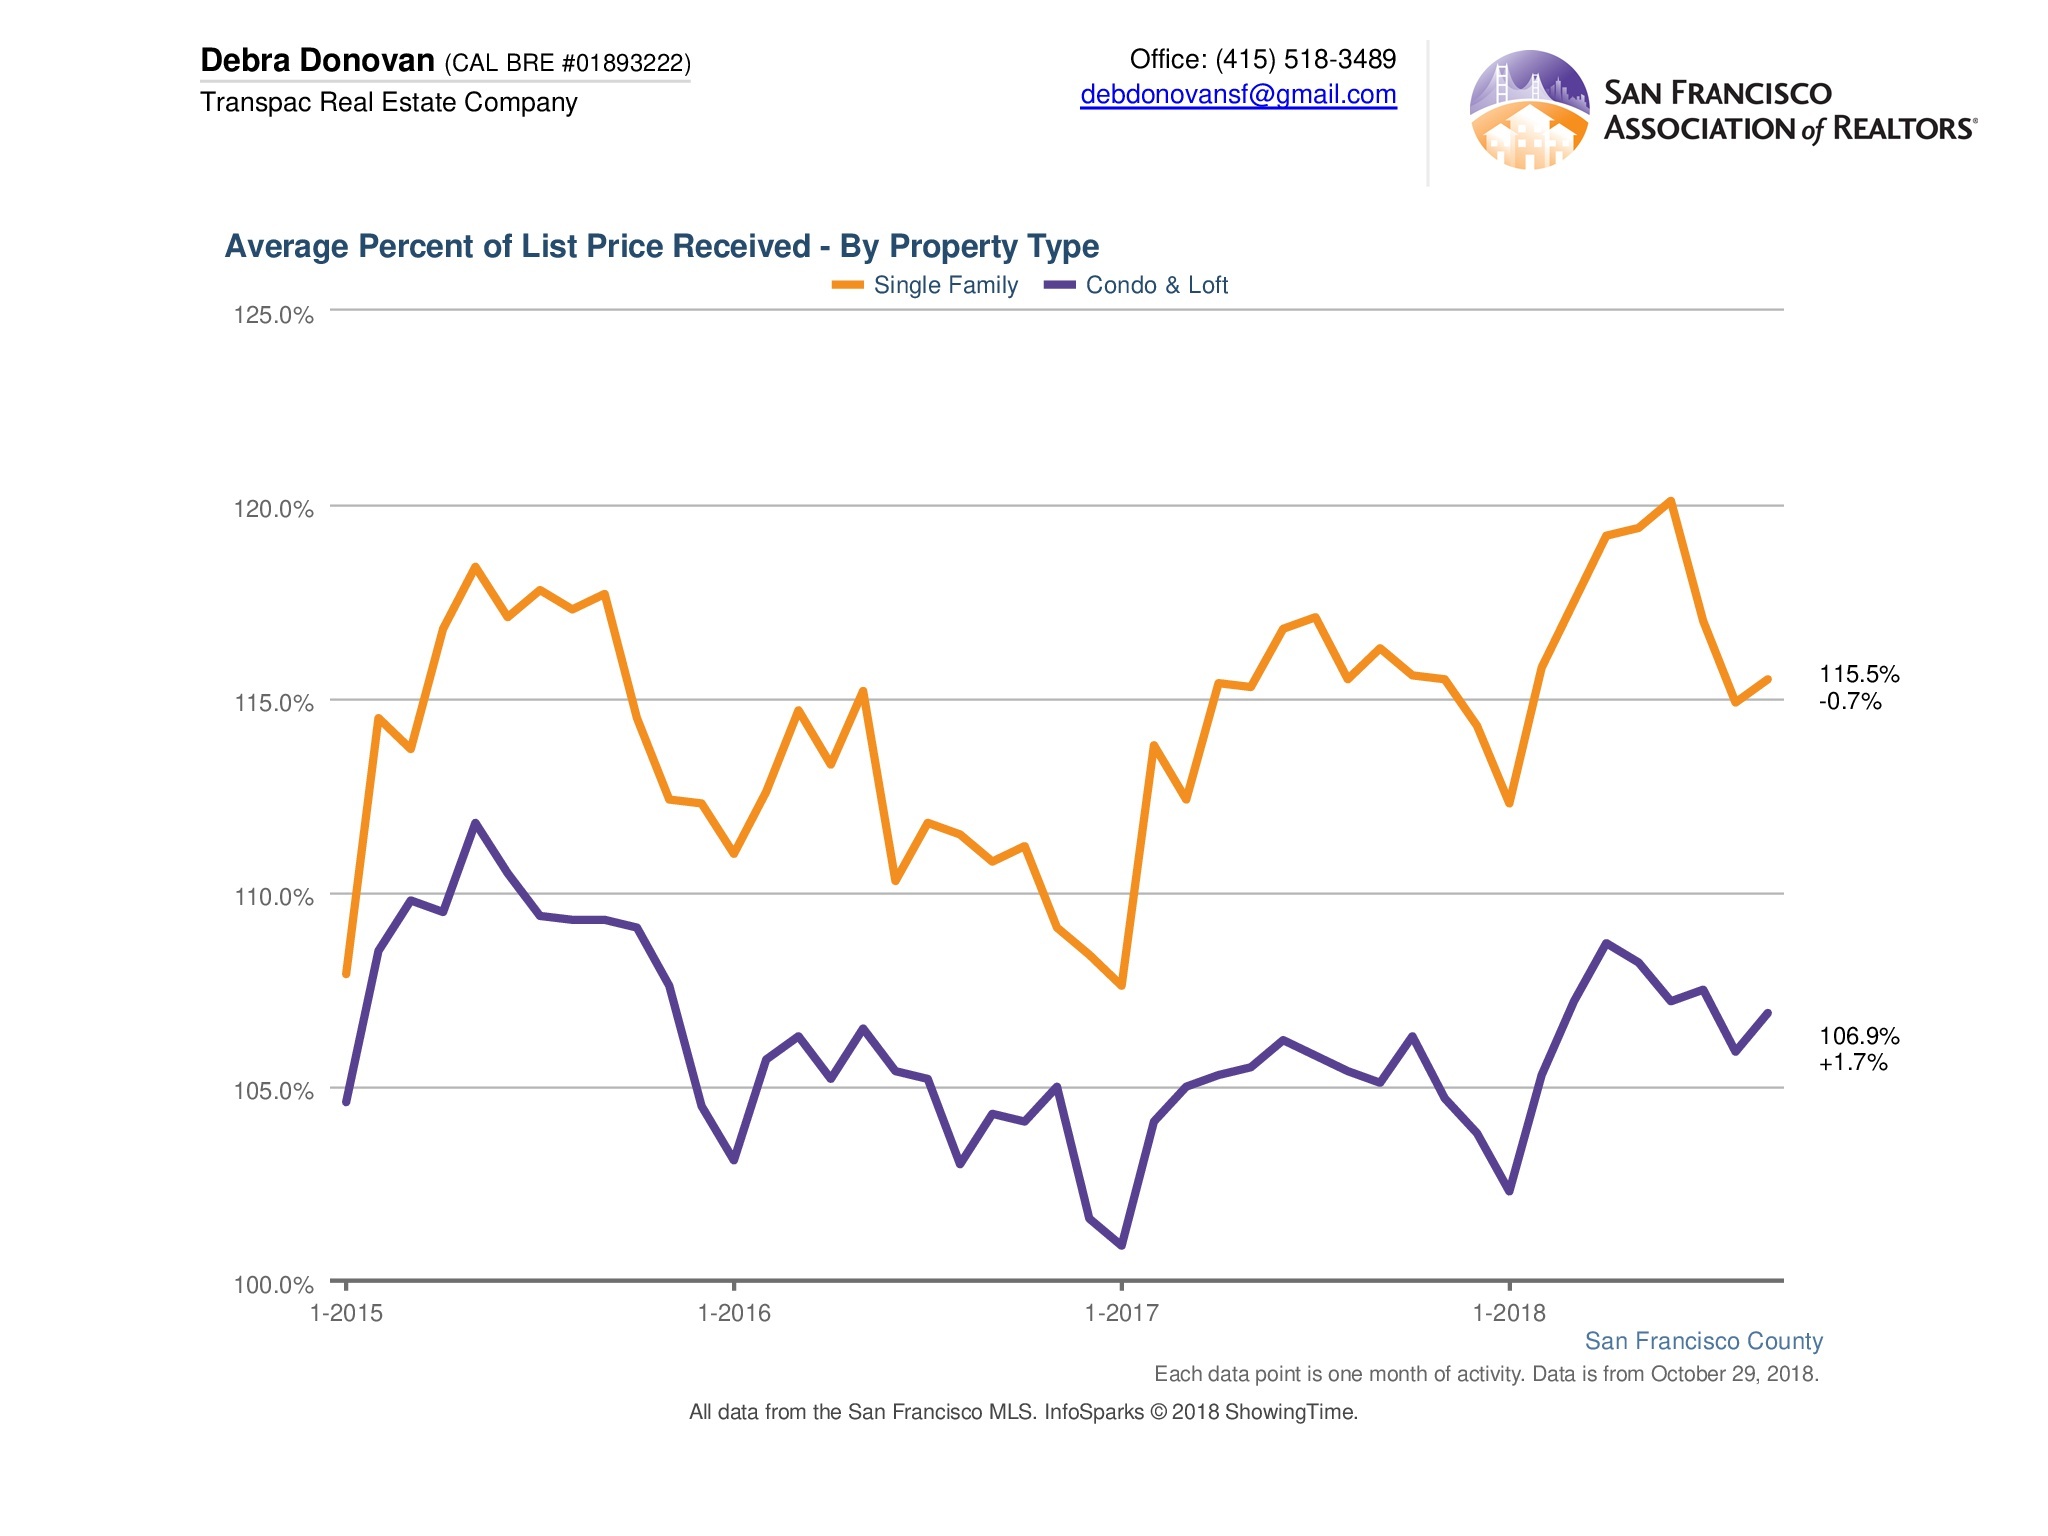
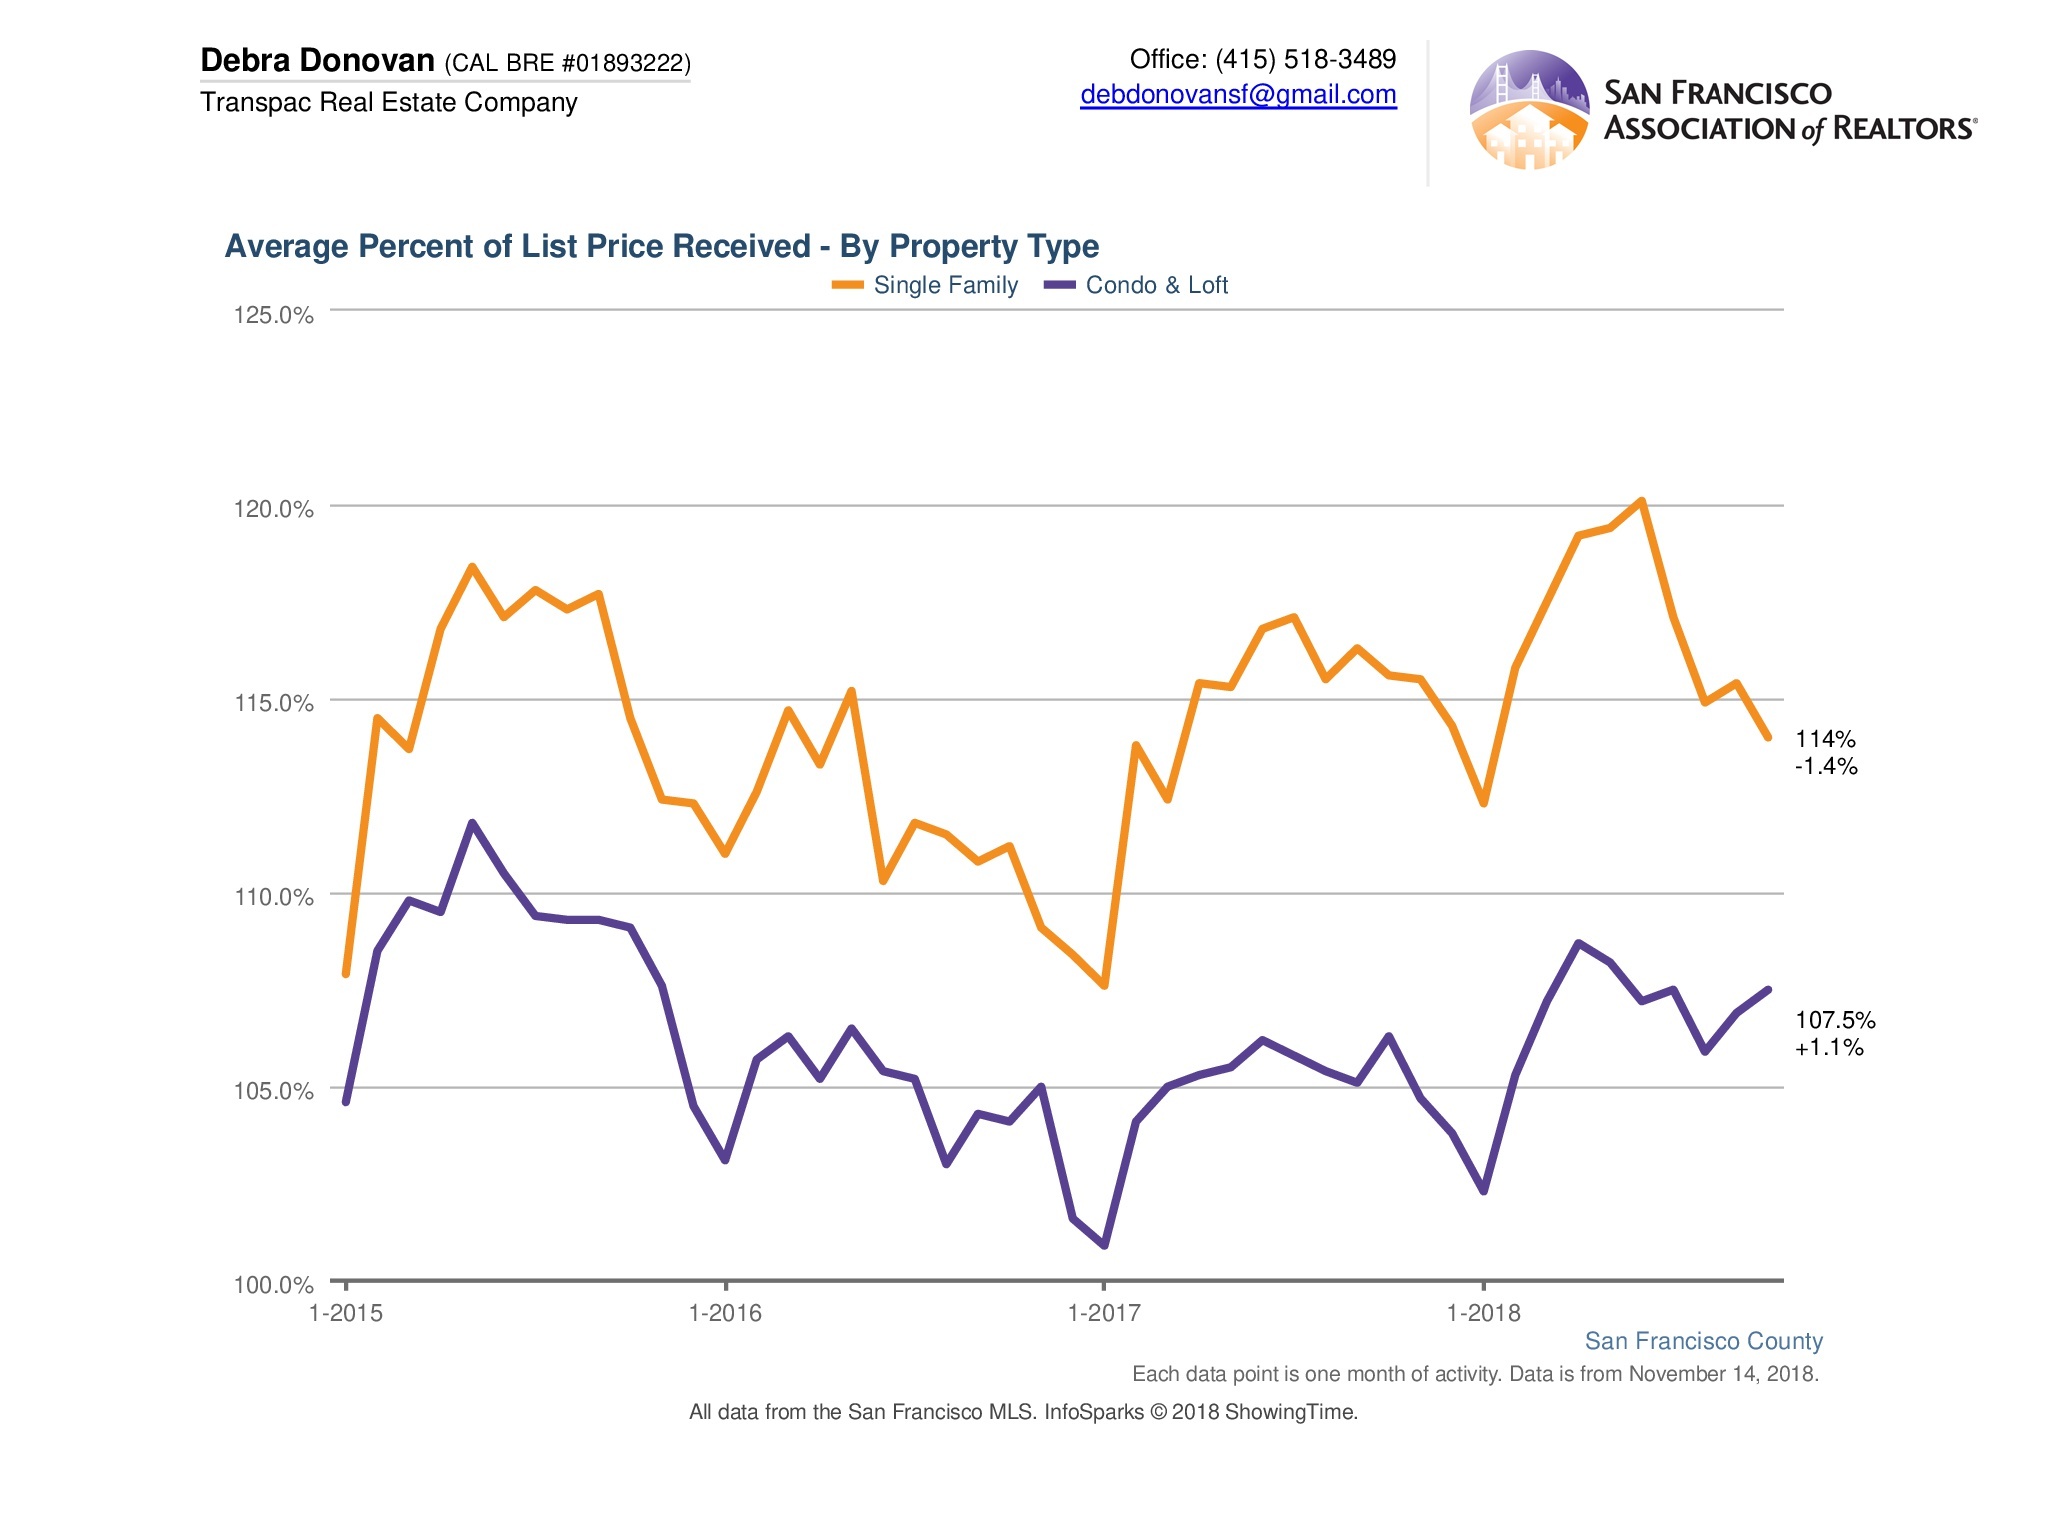
Average Percent of List Price Received:
The average percentage of list price received for single family homes has also remained steady over the past few months, but slightly lower than it has been in previous months. On average, single family homes received 114% of their purchase price, down 1.4% compared to October of last year. Condos and lofts, while also remaining steady recently, sold a bit up compared to last year at an average sales price of 107.5%.
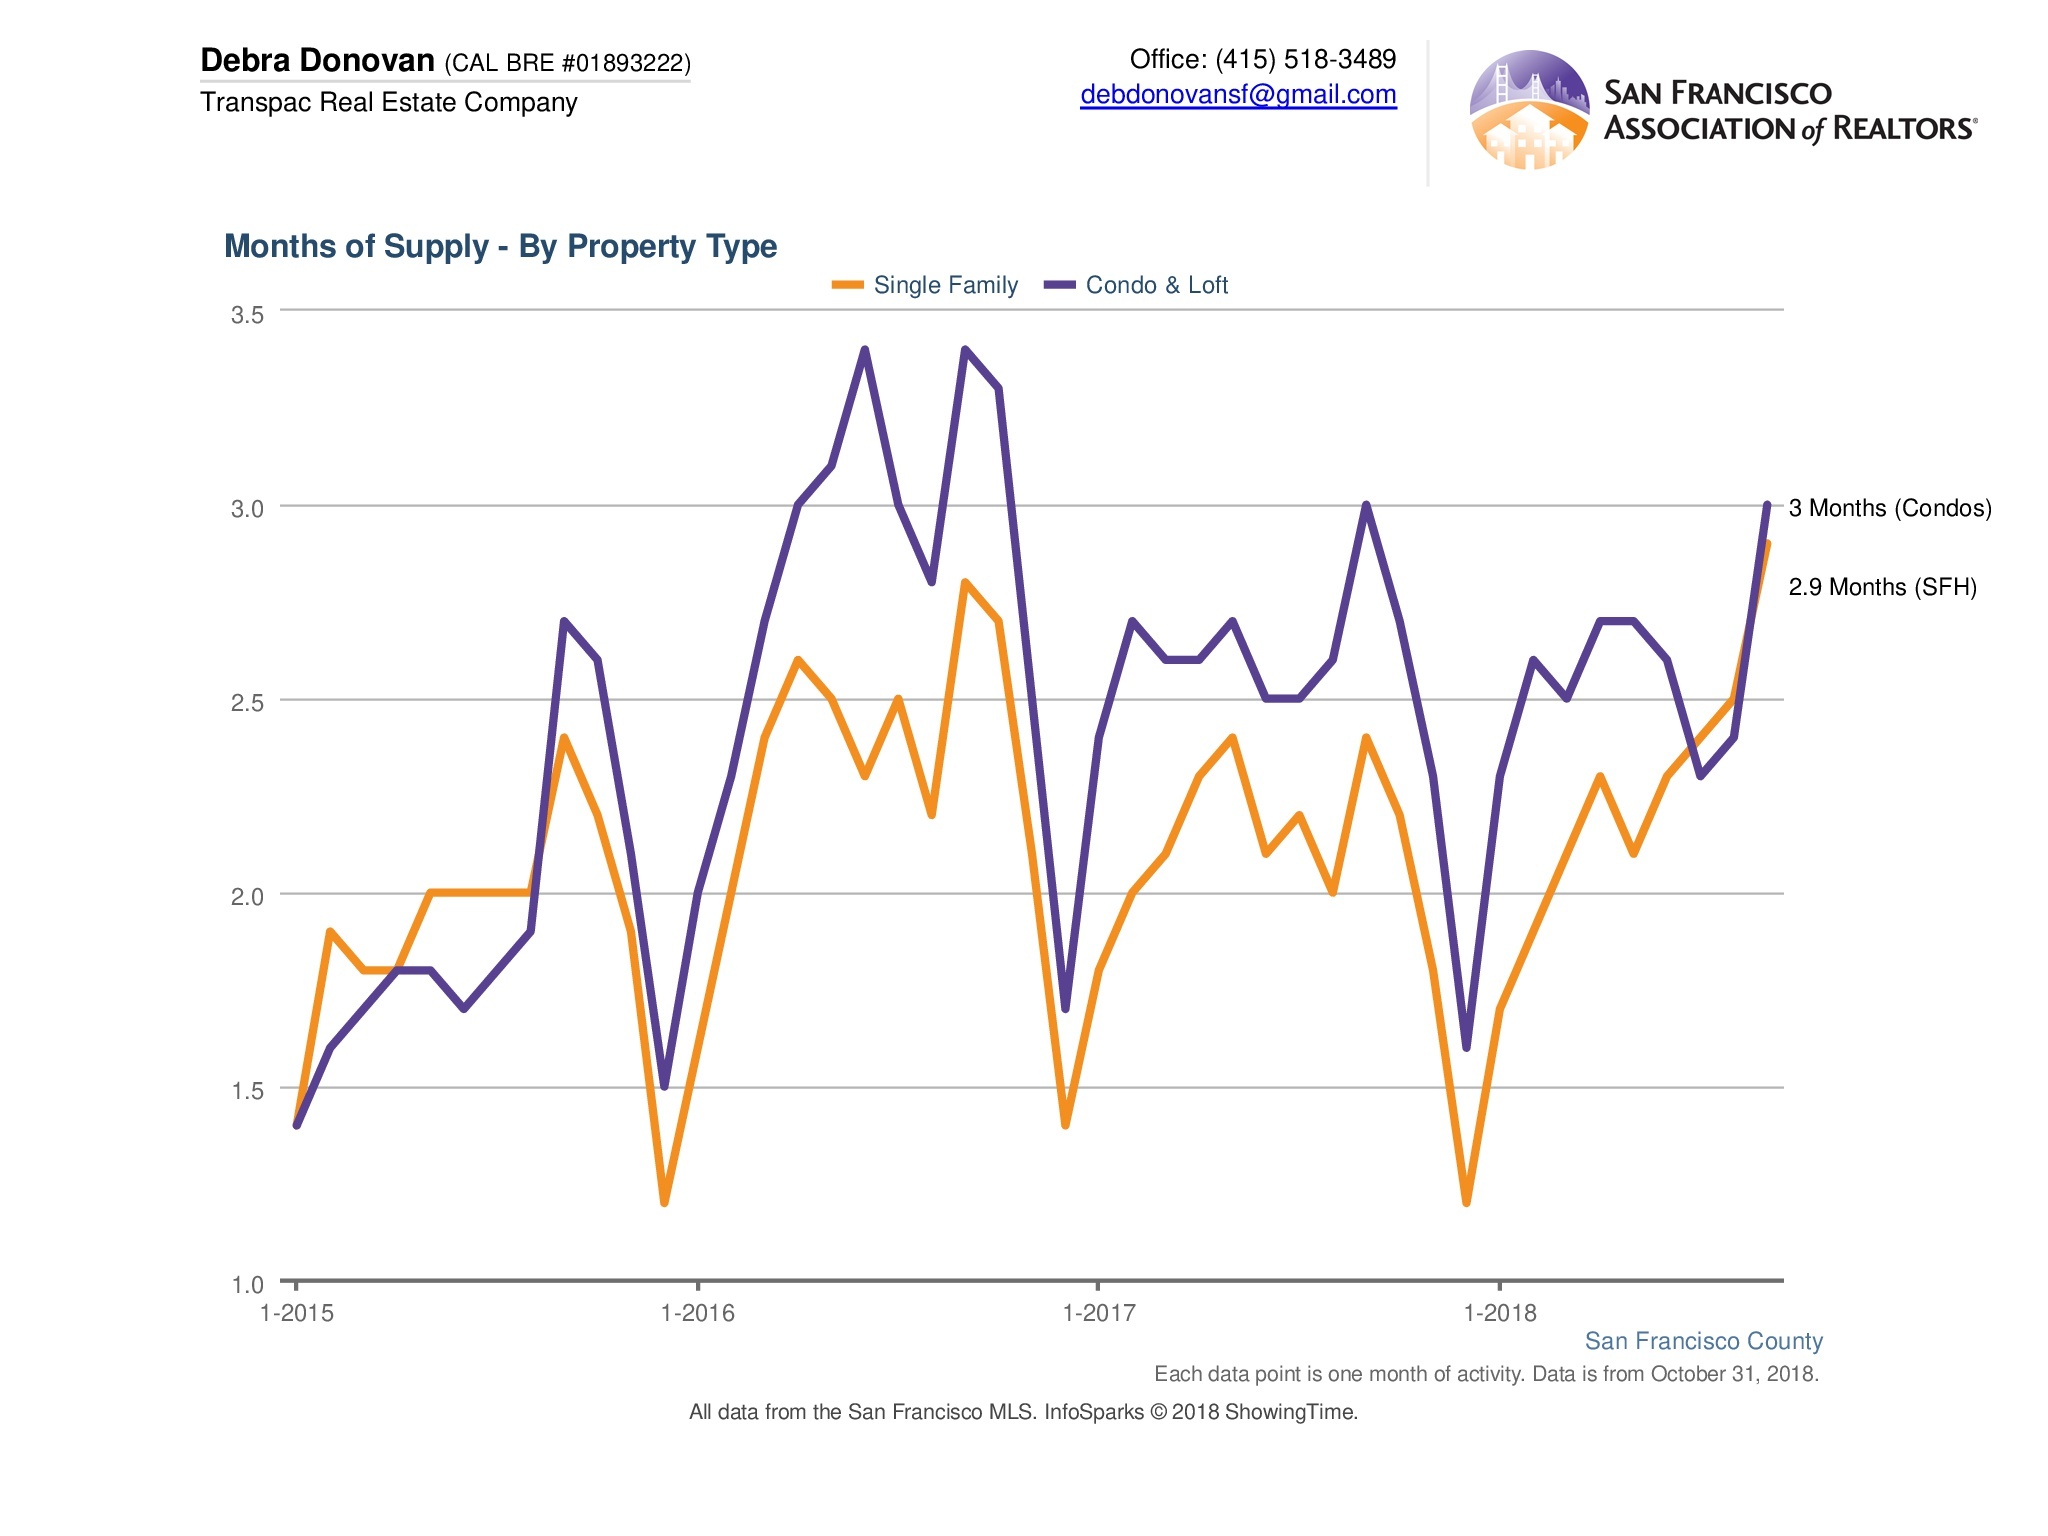
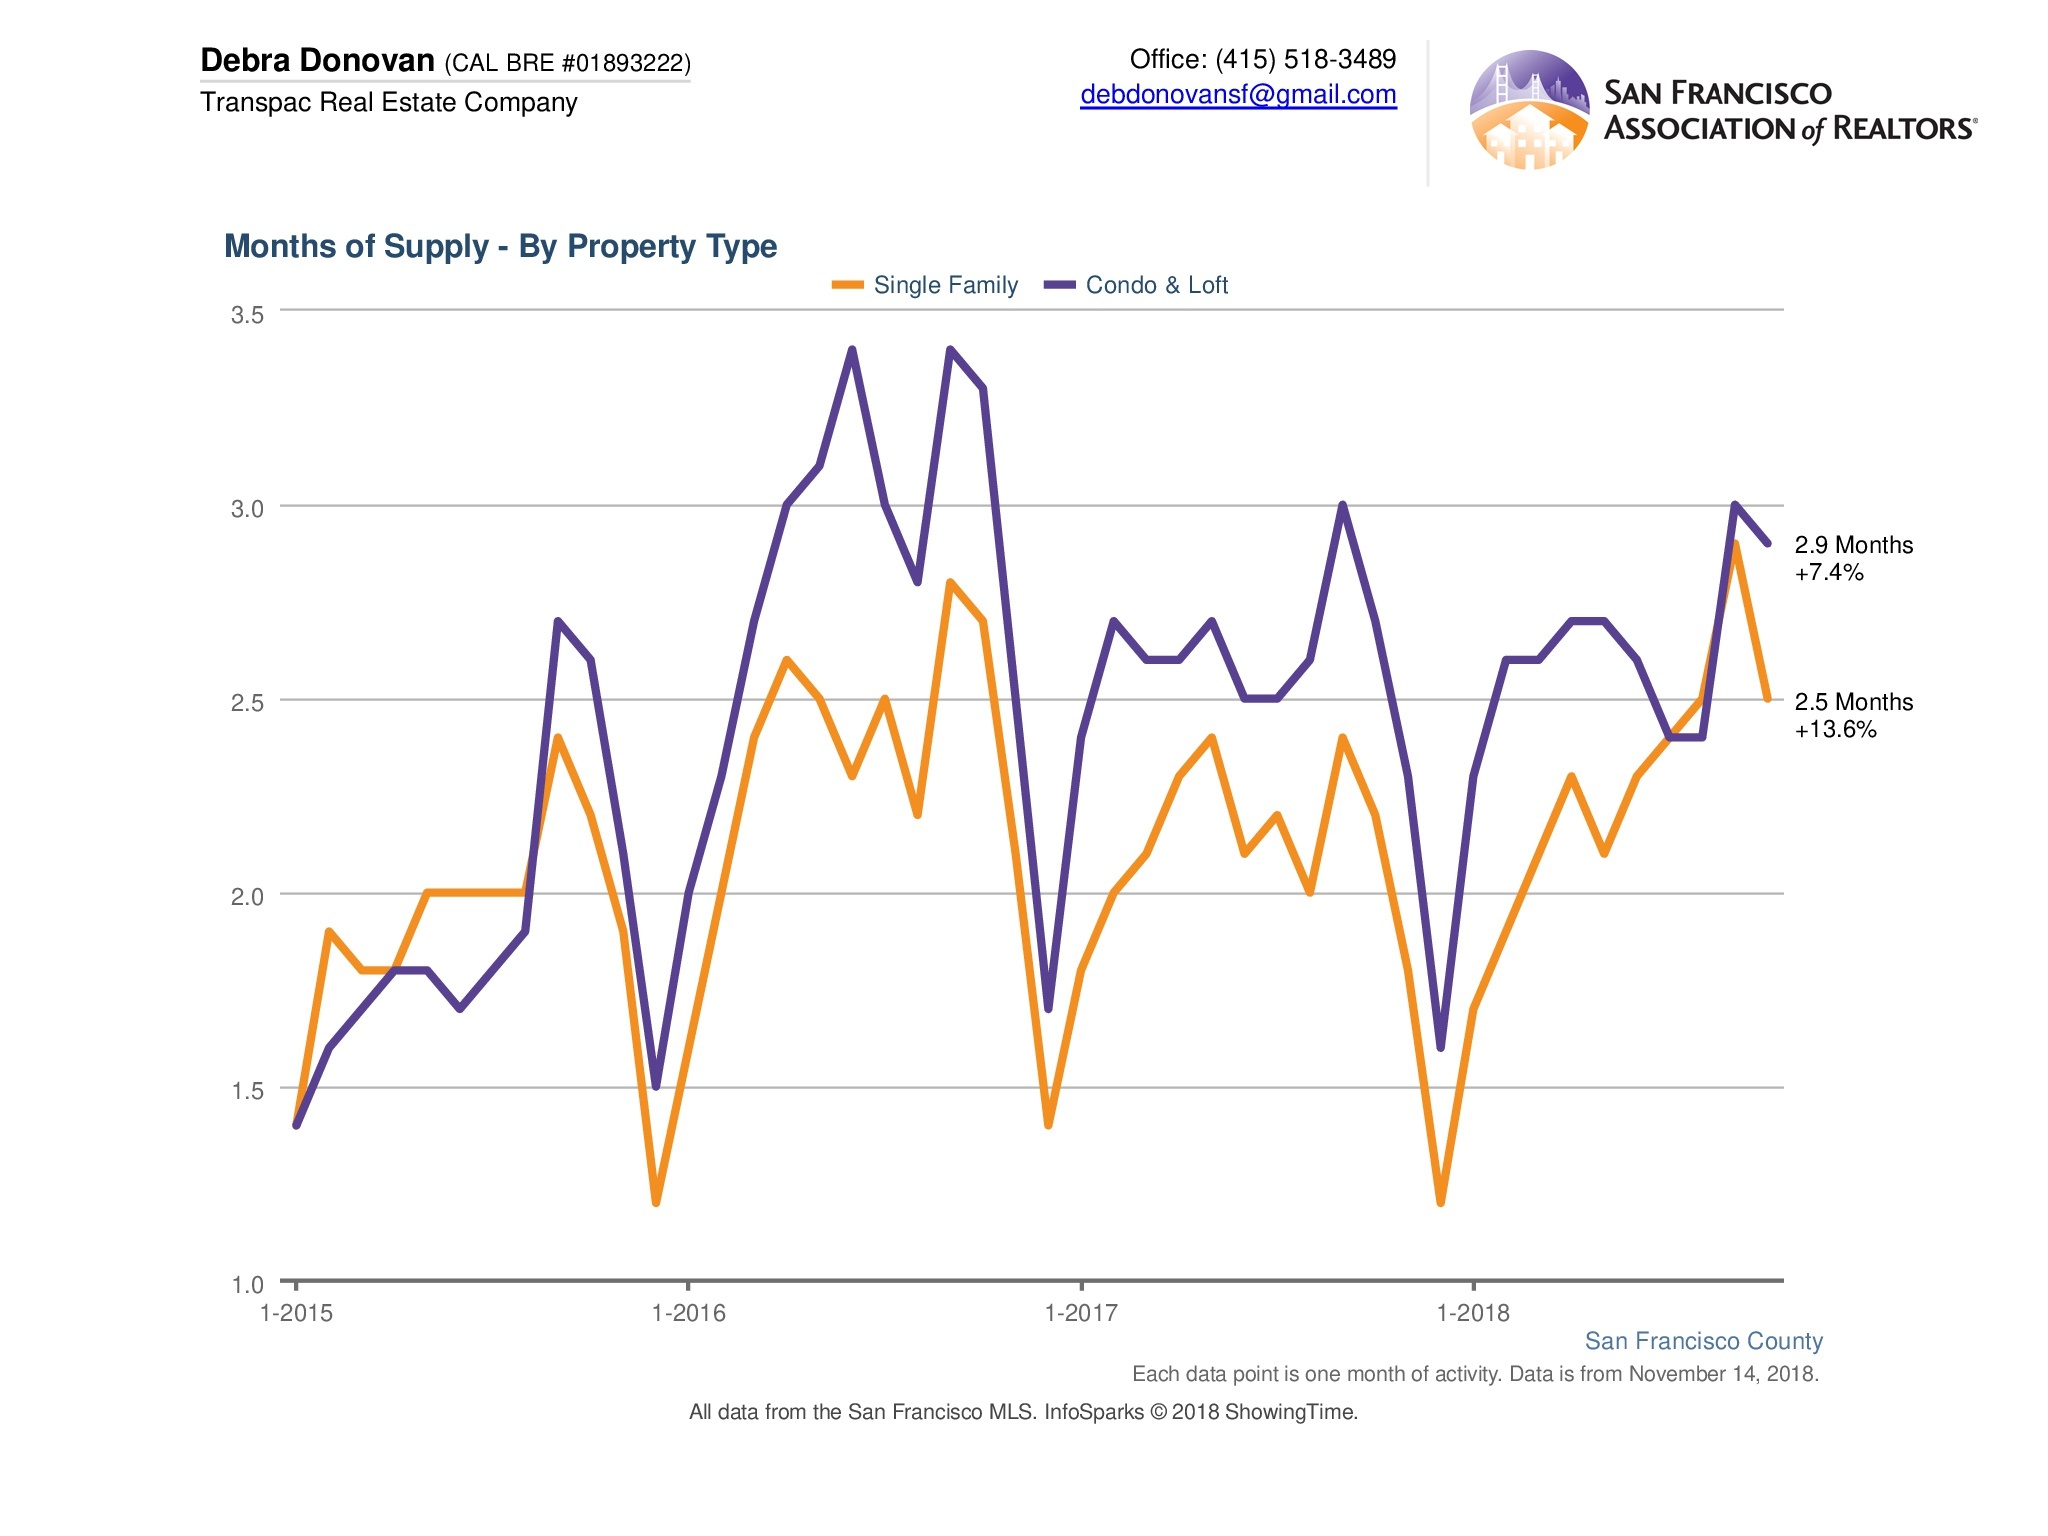
Months Supply of Inventory:
As mentioned above, single family homes have been staying on the market a bit longer than they have in the past. Last month, there was 2.5 months of inventory for single family homes, up 13.6% compared to October last year. Prior to March of this year, MSI for single family homes was under 2 months. This is an indication that the market is starting to come into balance. Condos and lofts have almost 3 months of inventory, up 7.4% compared to the same time last year.
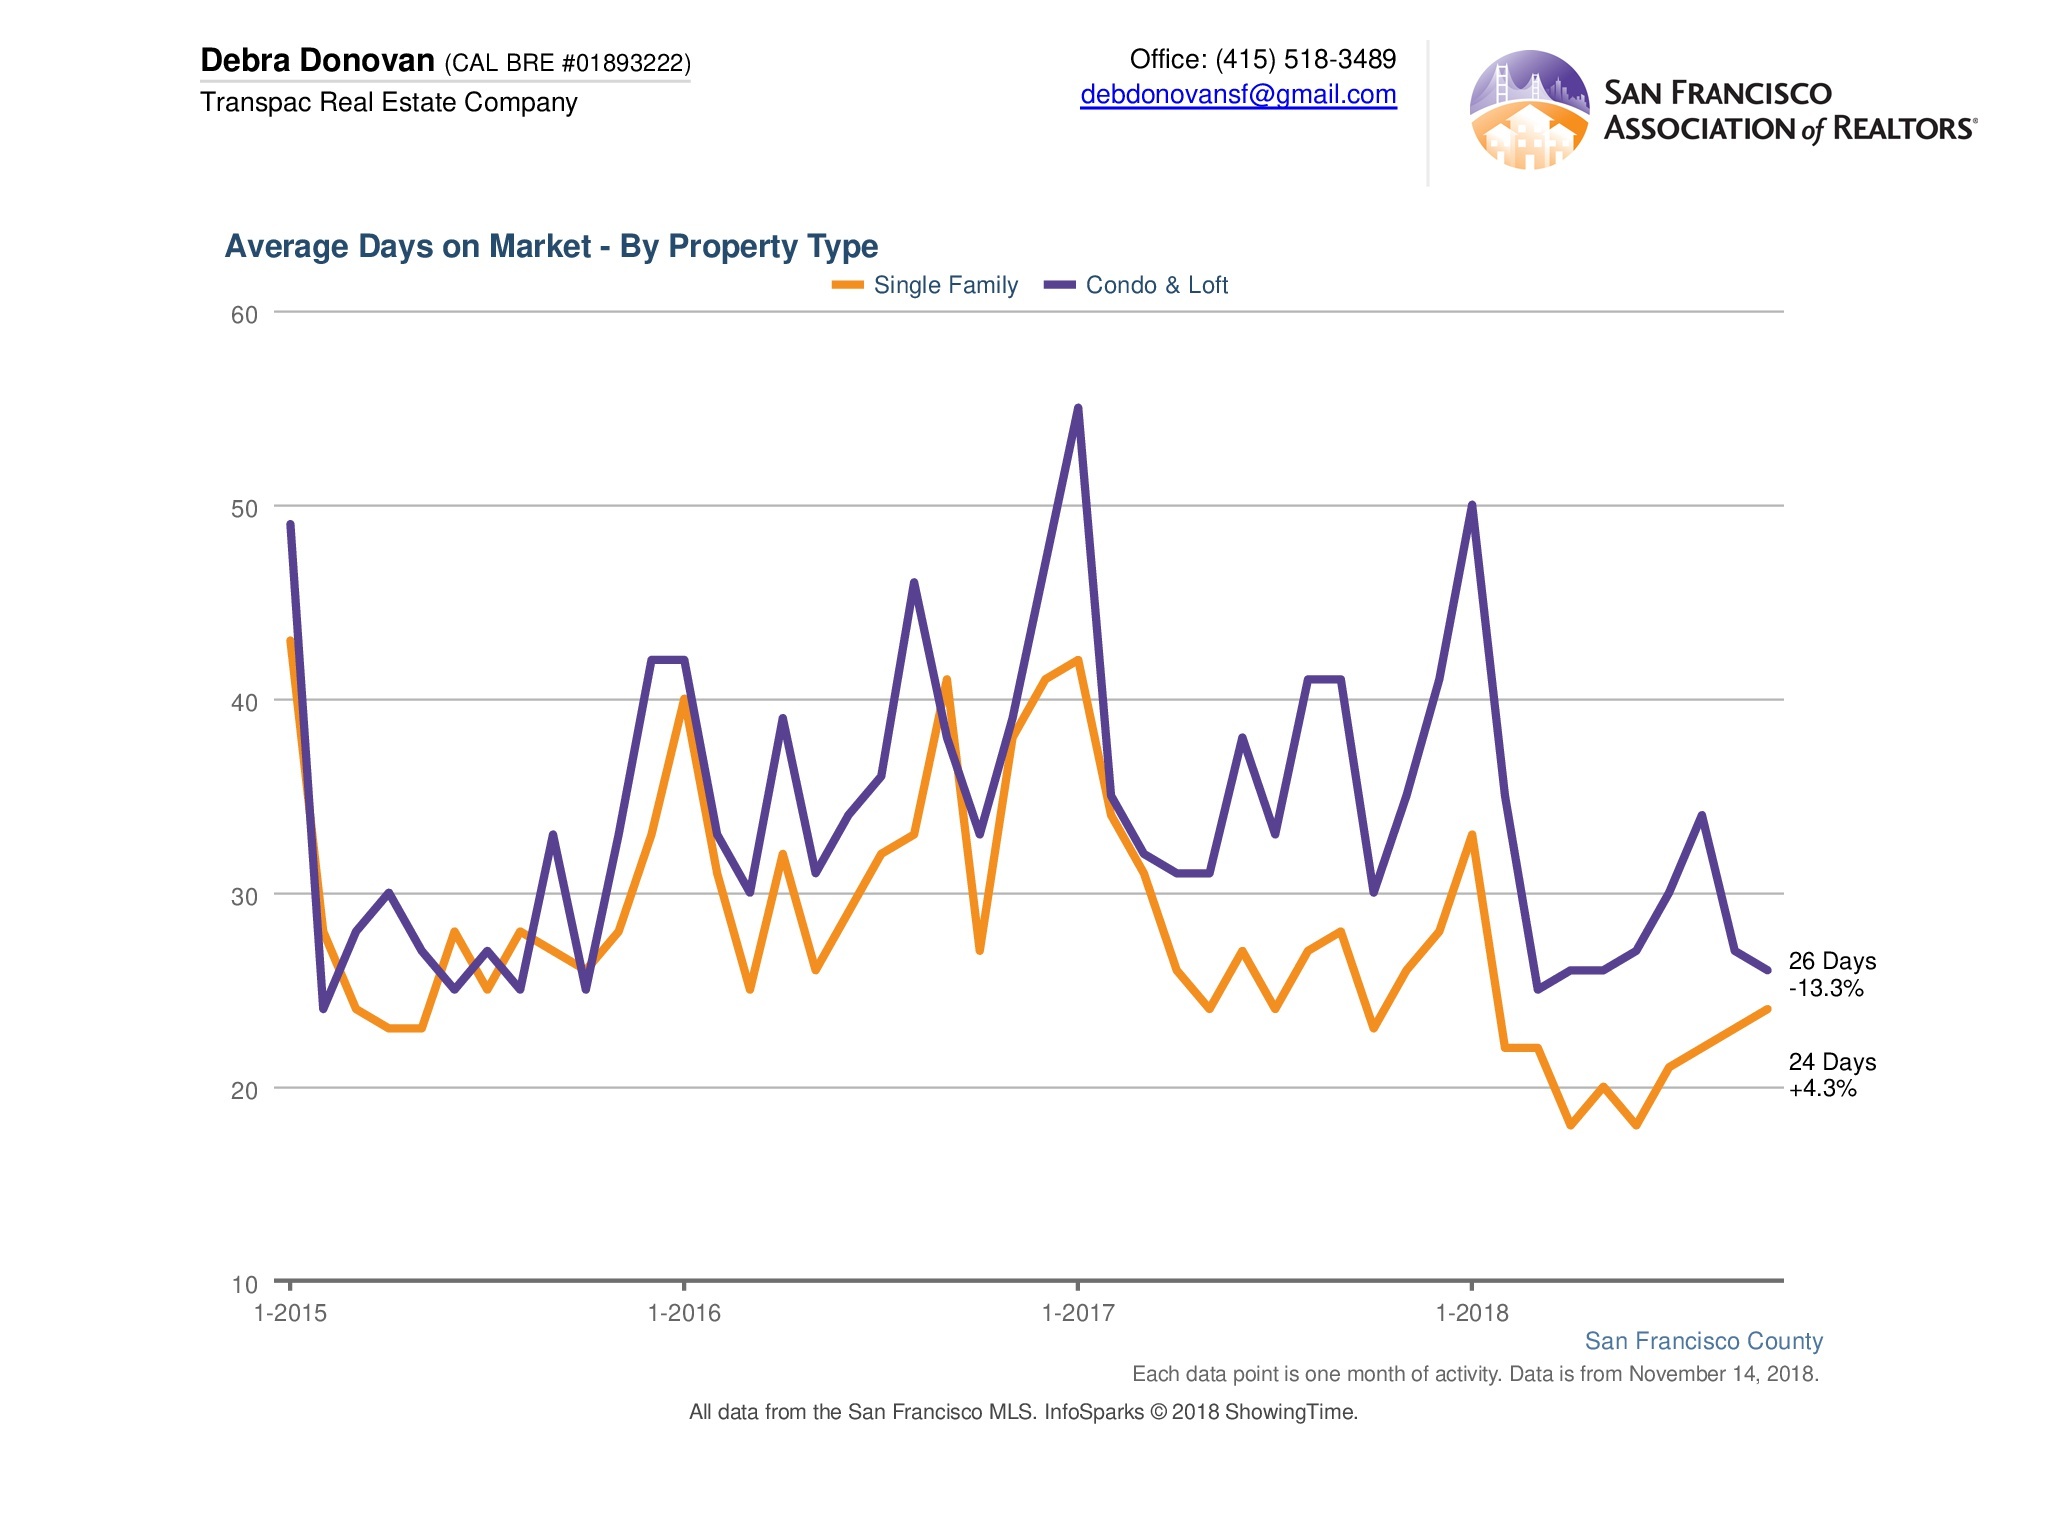
Average Days on Market:
Single family homes on average spent 24 days on market before going into contract. That’s up 4.3% compared to October 2017. Condos and lofts, on the other hand, spent 26 days on the market, down 13.3% compared to the same month last year.
The fine print: All information deemed reliable but not guaranteed or warranted. Data comes from MLS so does not include off-market and most new construction condo sales. The San Francisco real estate market is dynamic so statistics can change on a daily basis. These statistics are meant to be a snapshot of the day and time they were pulled.