The Bay Area real estate market, including Daly City, shifted in the third quarter of this year. Rising interest rates and inflation, combined with a volatile stock market all contributed to a slowing in buyer purchase power and demand.
As a result, median sales prices fell even as inventory remained in a deficit. Homes took a bit longer to sell and there were fewer bidding wars. However the market still stayed in sellers’ market territory.
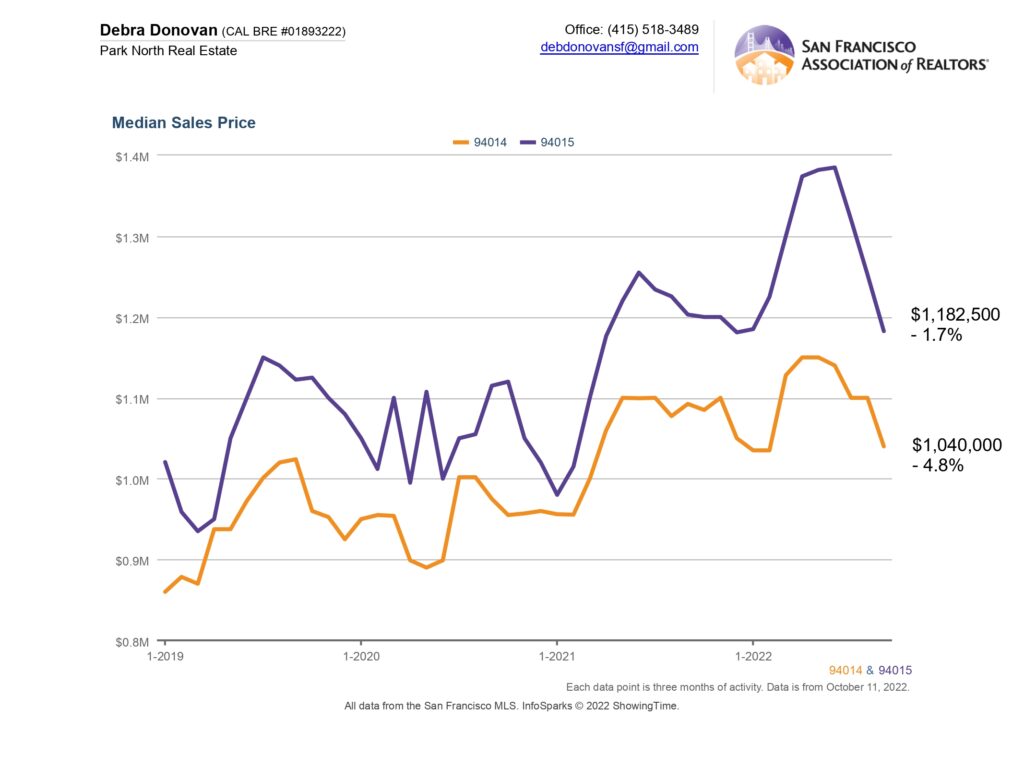
Median Sales Price:
The median sales price for homes in zip code 94014 fell about 5% to $1,040,000 in Q3. Homes in zip code 94015 fell almost 2% to $1,182,500.
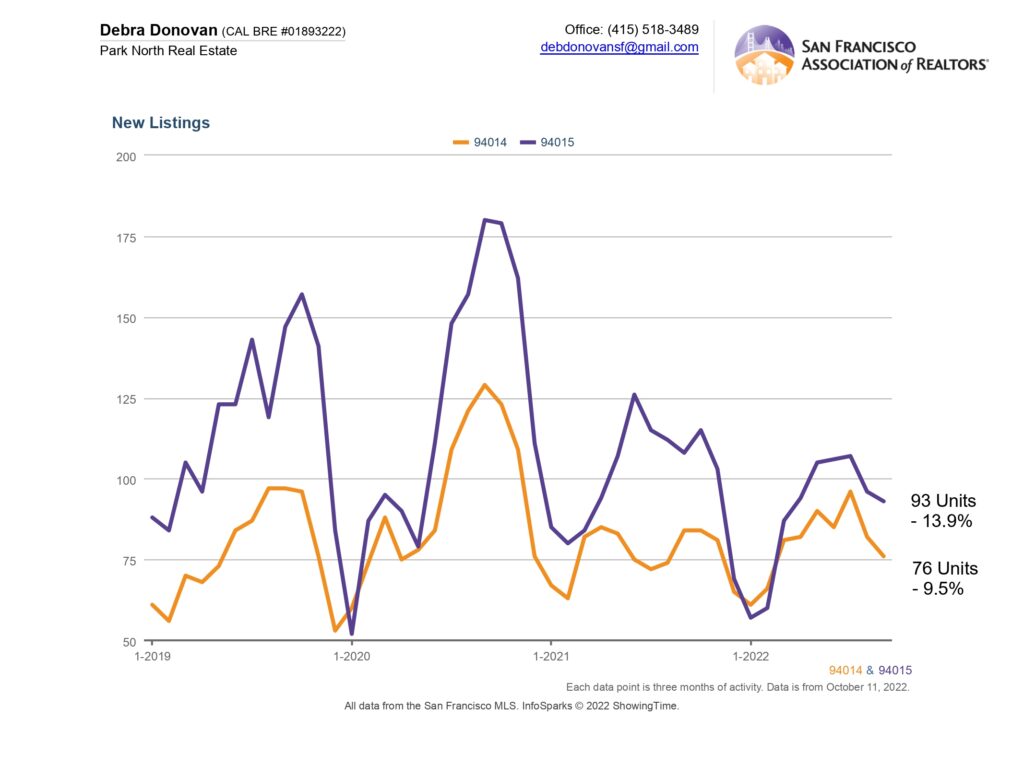
New Listings:
In addition to decreasing prices, there were also fewer new properties for sale in Daly City in Q3. Zip code 94014 had just 76 new listings over the quarter, down almost 10% compared to Q3 2021. Zip code 94015 had 93 new listings, down 14%.
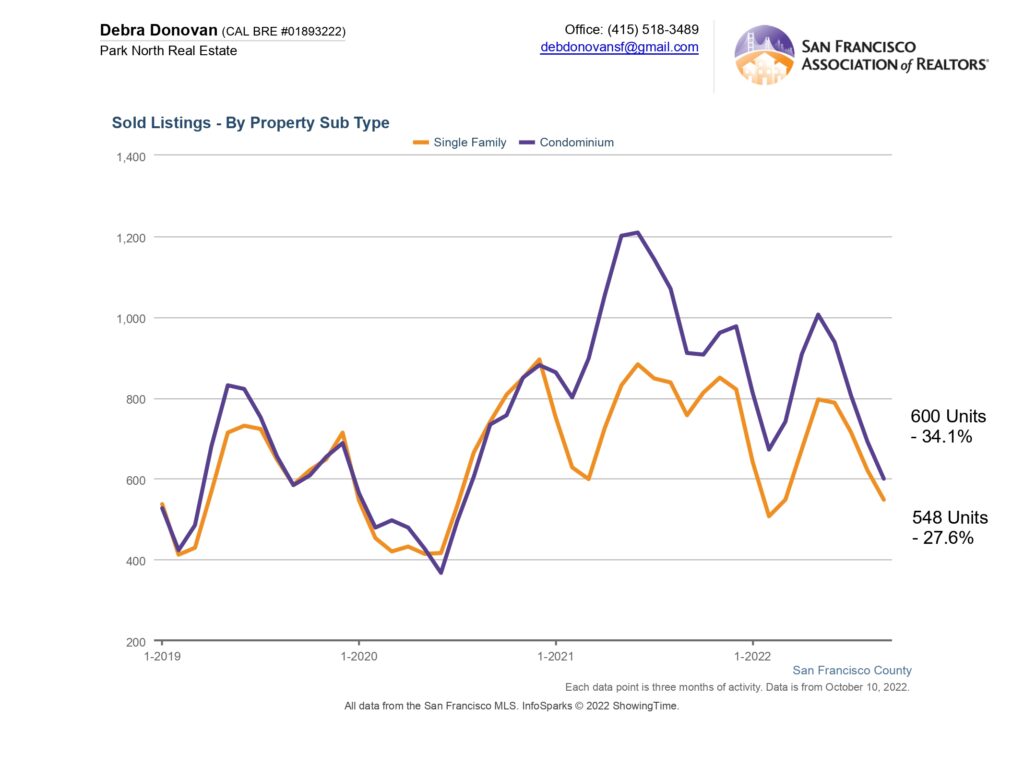
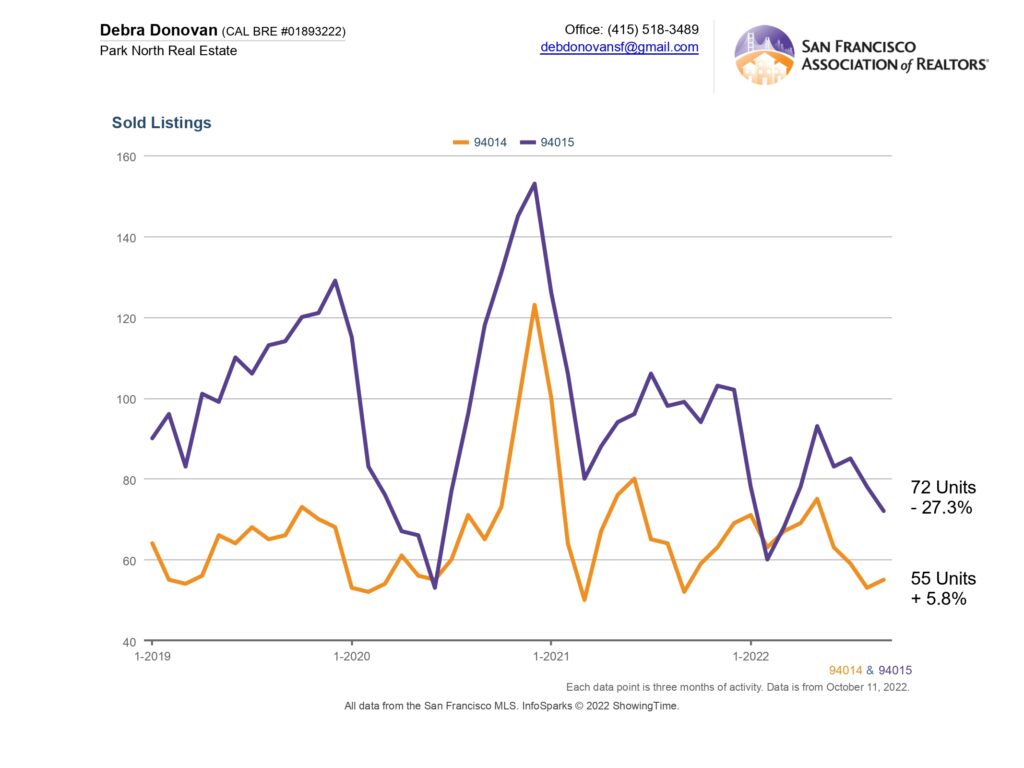
Sold Listings:
There was a dichotomy between sold listings throughout Daly City. Zip code 94014 saw sold listings increase by almost 6% while zip code 94015 saw a decrease of 27% in sold listings quarter-over-quarter.
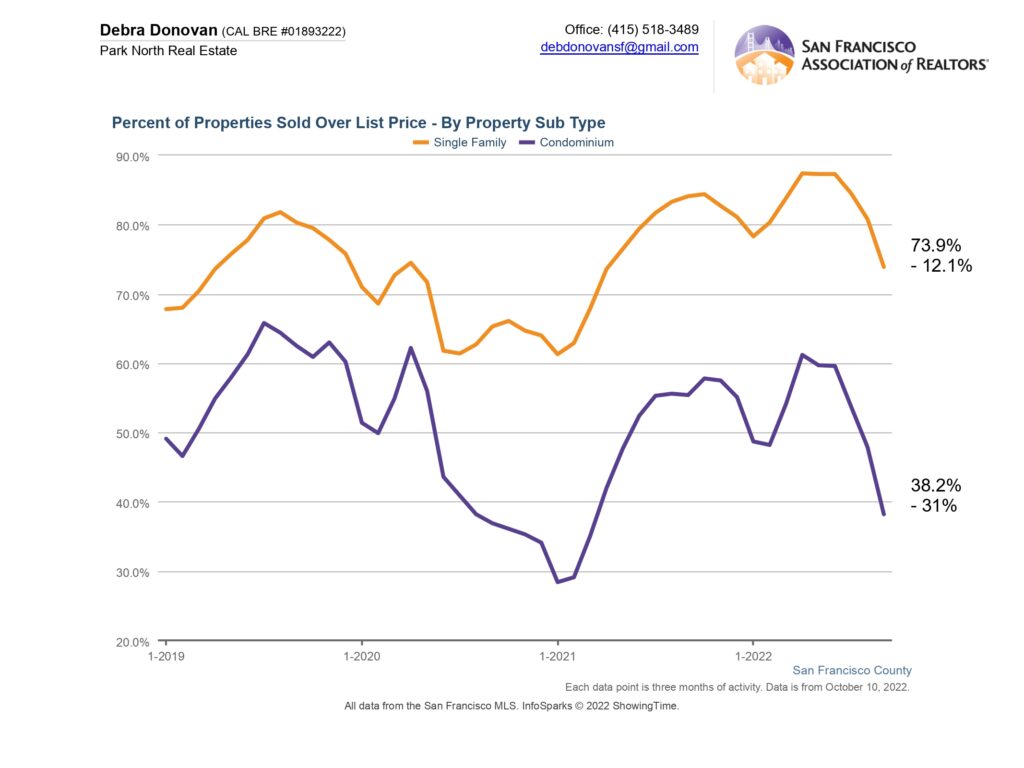
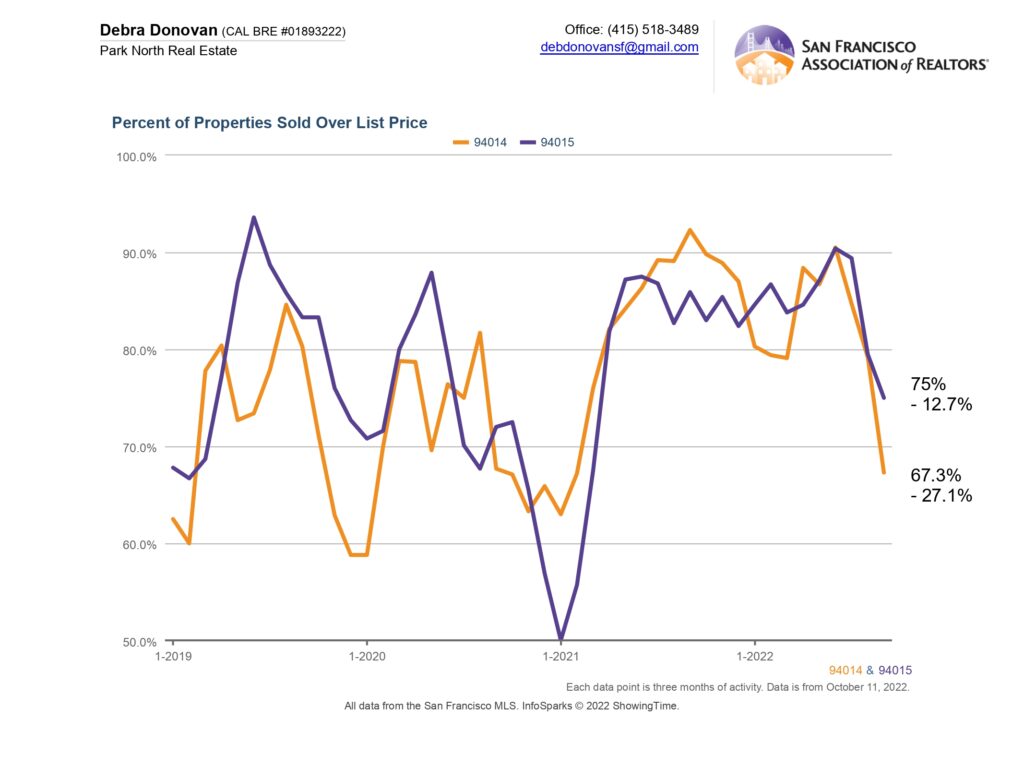
Percentage of Properties that Sold Over List Price:
As buyer demand declined so did the number of bidding wars. The overall percentage of properties that sold above their list price decreased. About two-thirds of homes in zip code 94014 sold for more than the list price in Q3, down 27% compared to Q3 2021. Three-quarters of homes in zip code 94015 sold above list price, down 13% for the quarter.
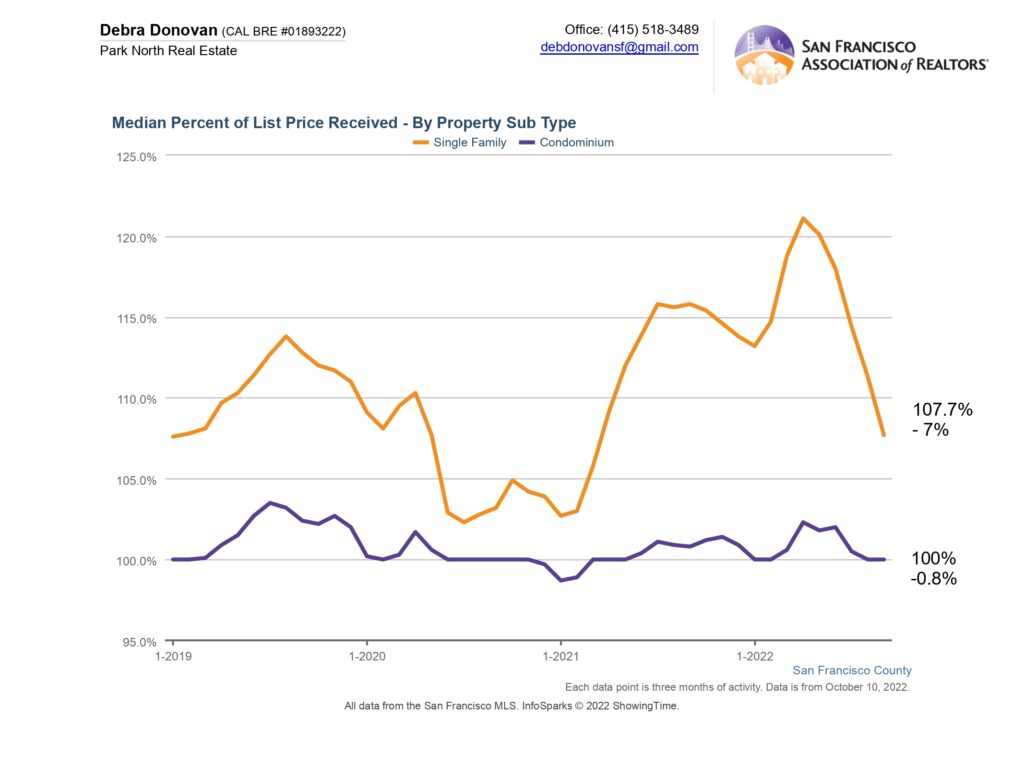
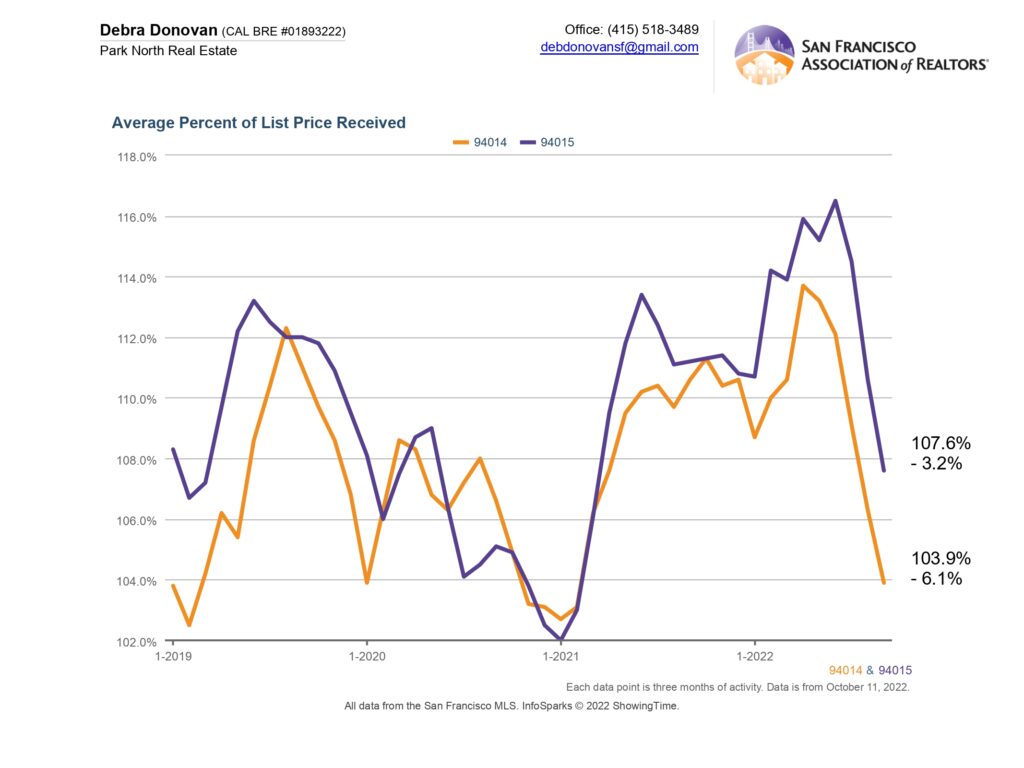
Average Percentage of List Price Received:
As buyers held back from extreme bidding wars, the average percent of list price that homes received also decreased. Homes in zip code 94014 sold for an average of 104% of their list price in Q3, down 6% compared to the same quarter last year. Homes in zip code 94015 sold for an average of 107% of their list price, down a little more than 3%.
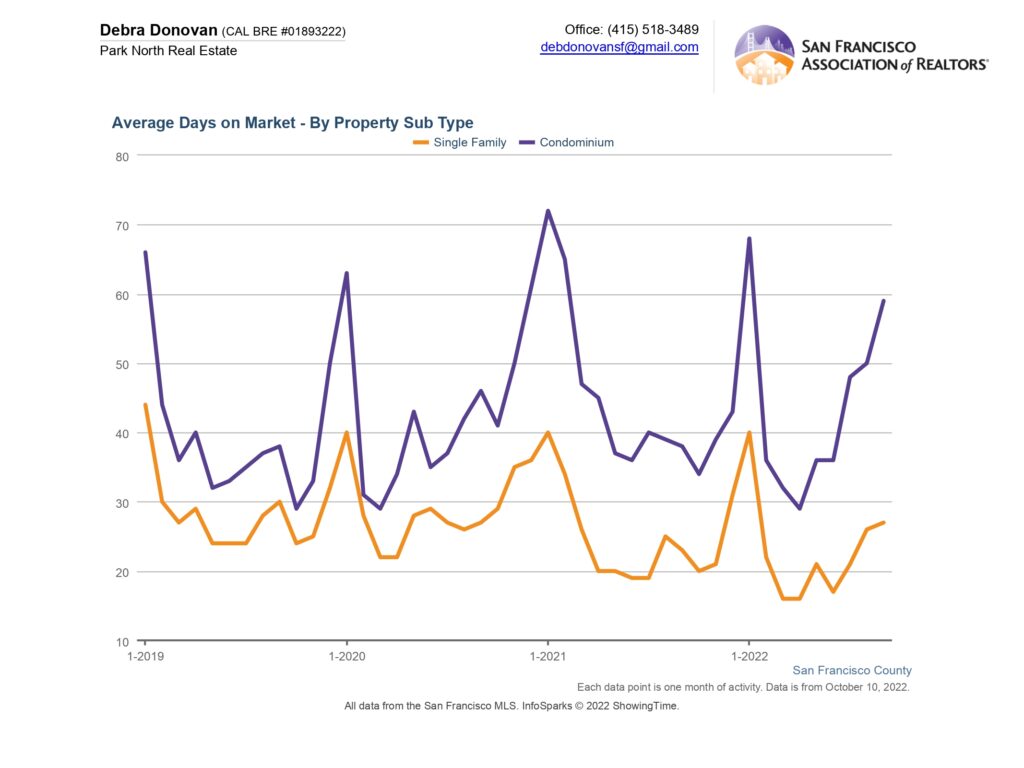
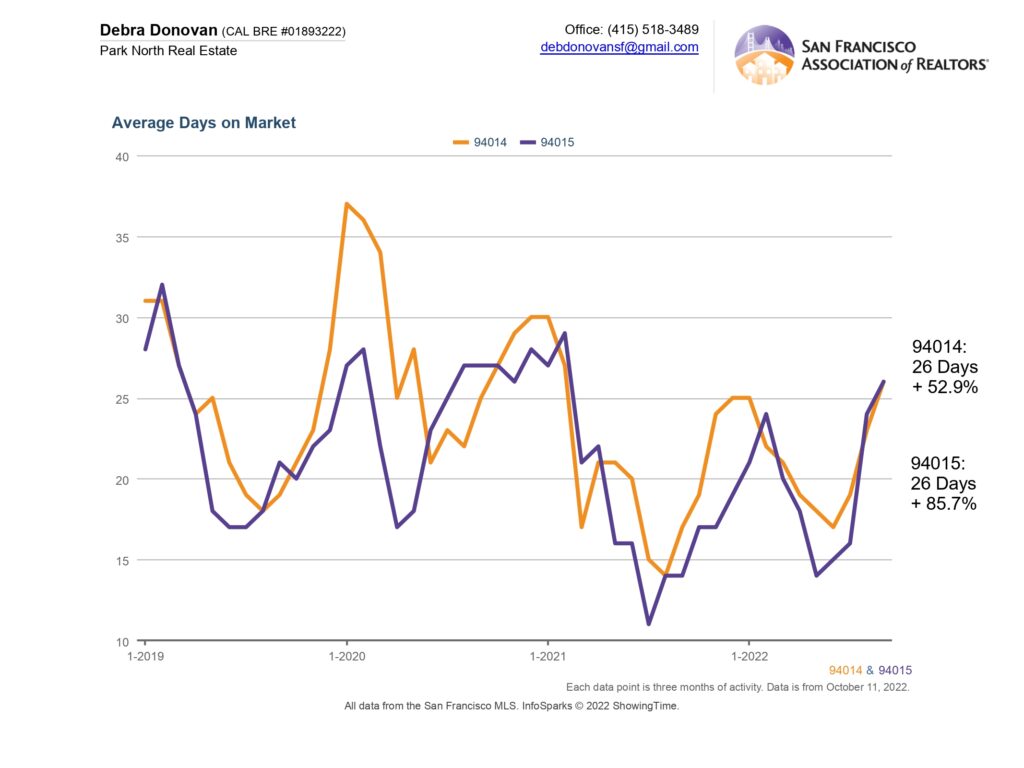
Average Days on Market:
The average days on market for homes in zip codes 94014 and 94015 increased to 26 days on the market before accepting an offer. In Q3 of 2021 homes were on the market for an average of 17 and 14 days respectively. So while 26 days may seem quick to many parts of the country, it’s an increase for here in the Bay Area markets.
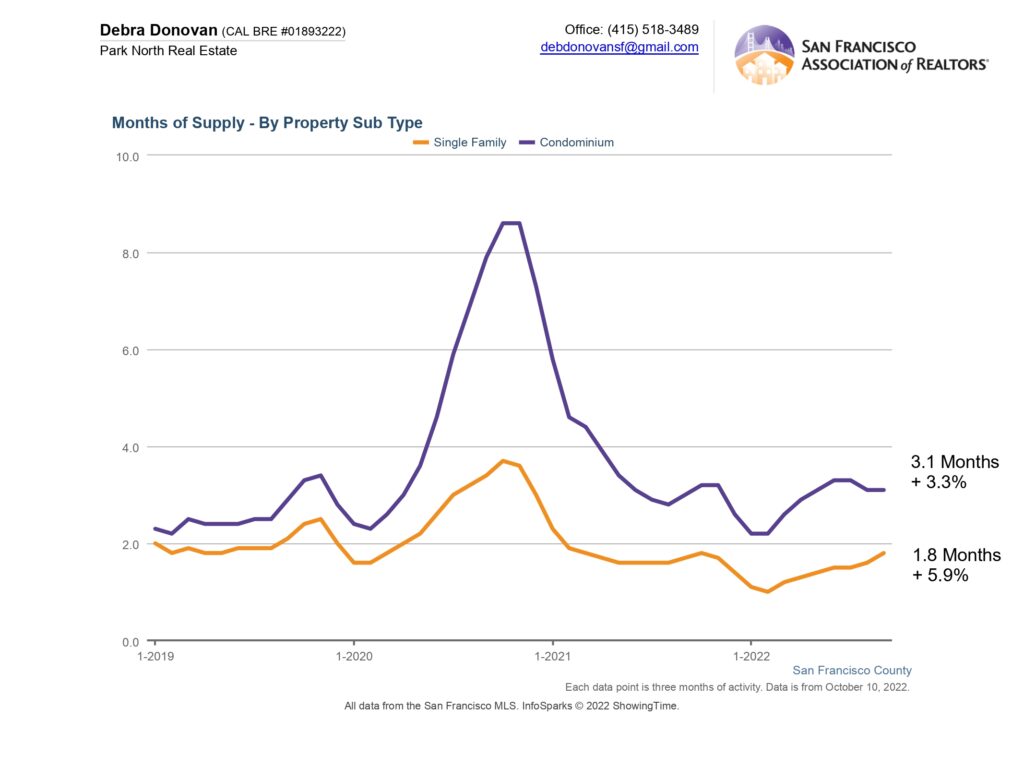
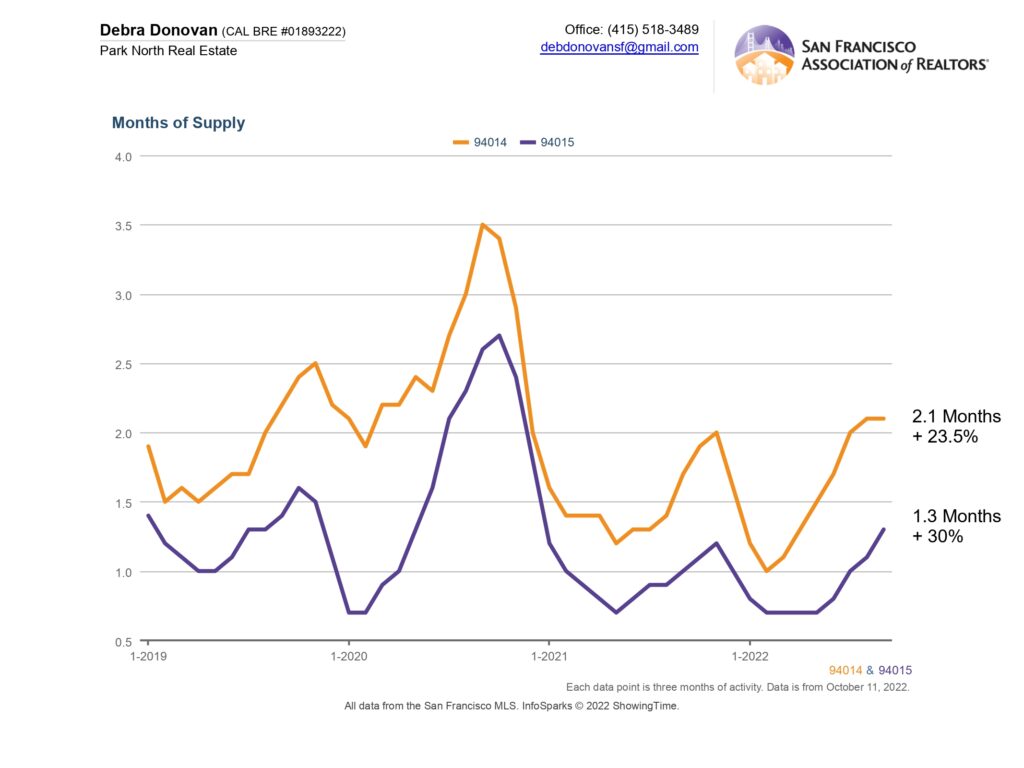
Months Supply of Inventory:
For all of the doom and gloom we’re hearing about the market, it continues to be a sellers’ market based on the absorption rate of properties, called Months Supply of Inventory or MSI. Zip code 94014 had 2.1 months of inventory, while zip code 94015 had just 1.3 months. Both were an increase compared to last year’s Q3, but a more balanced market would show 6 or so months of inventory.
The fine print: All information deemed reliable but not guaranteed or warranted. Data comes from the MLS so does not include off-market and most new construction condo sales. The Bay Area real estate market is dynamic so statistics can change on a daily basis. These statistics are meant to be a snapshot of the day and time they were pulled.