We are in full swing for the 2019 San Francisco real estate market. Median sales prices ticked up compared to last month, though single family home prices were down compared to the same month last year. Inventory is again anemic with fewer new listings than last month or last year. The average days on market are also shortening compared to January , though they are still longer than what we saw for most of last year. Check out all of the February stats below!
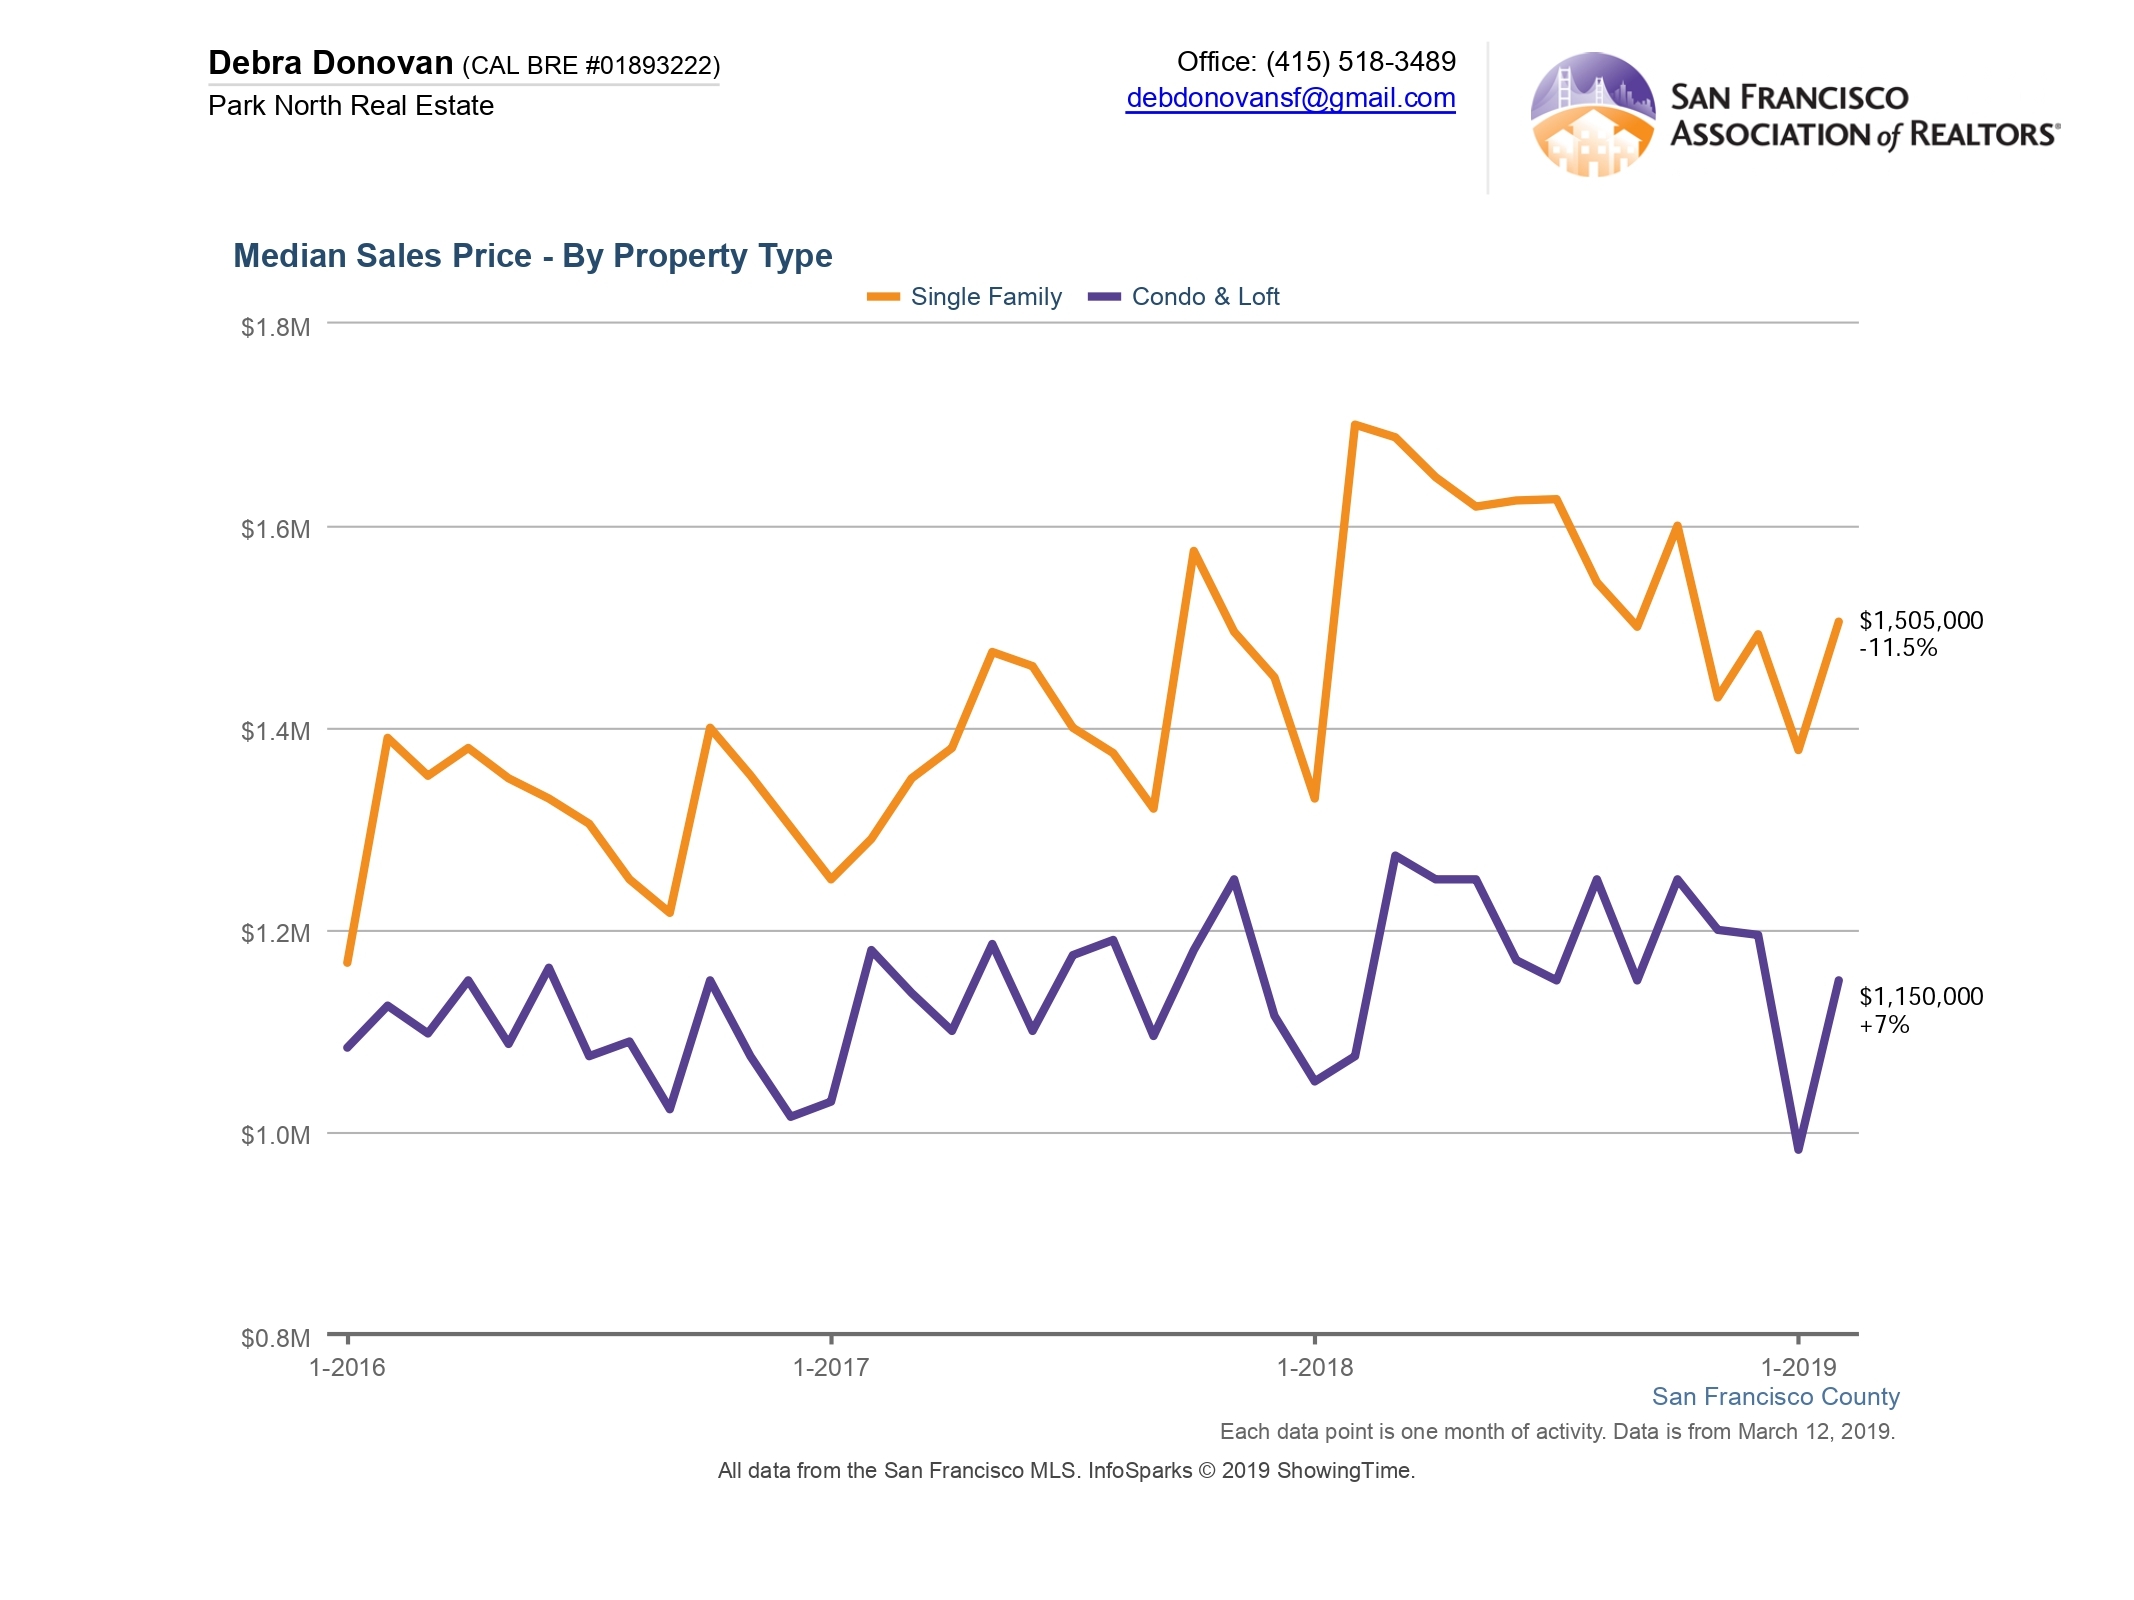
Median Sales Price:
The median sales price for a single family home shot back up to over $1.5 million, but was down compared to the same month last year. Condos and loft prices also bounced up compared to January and were also up compared to February of last year.
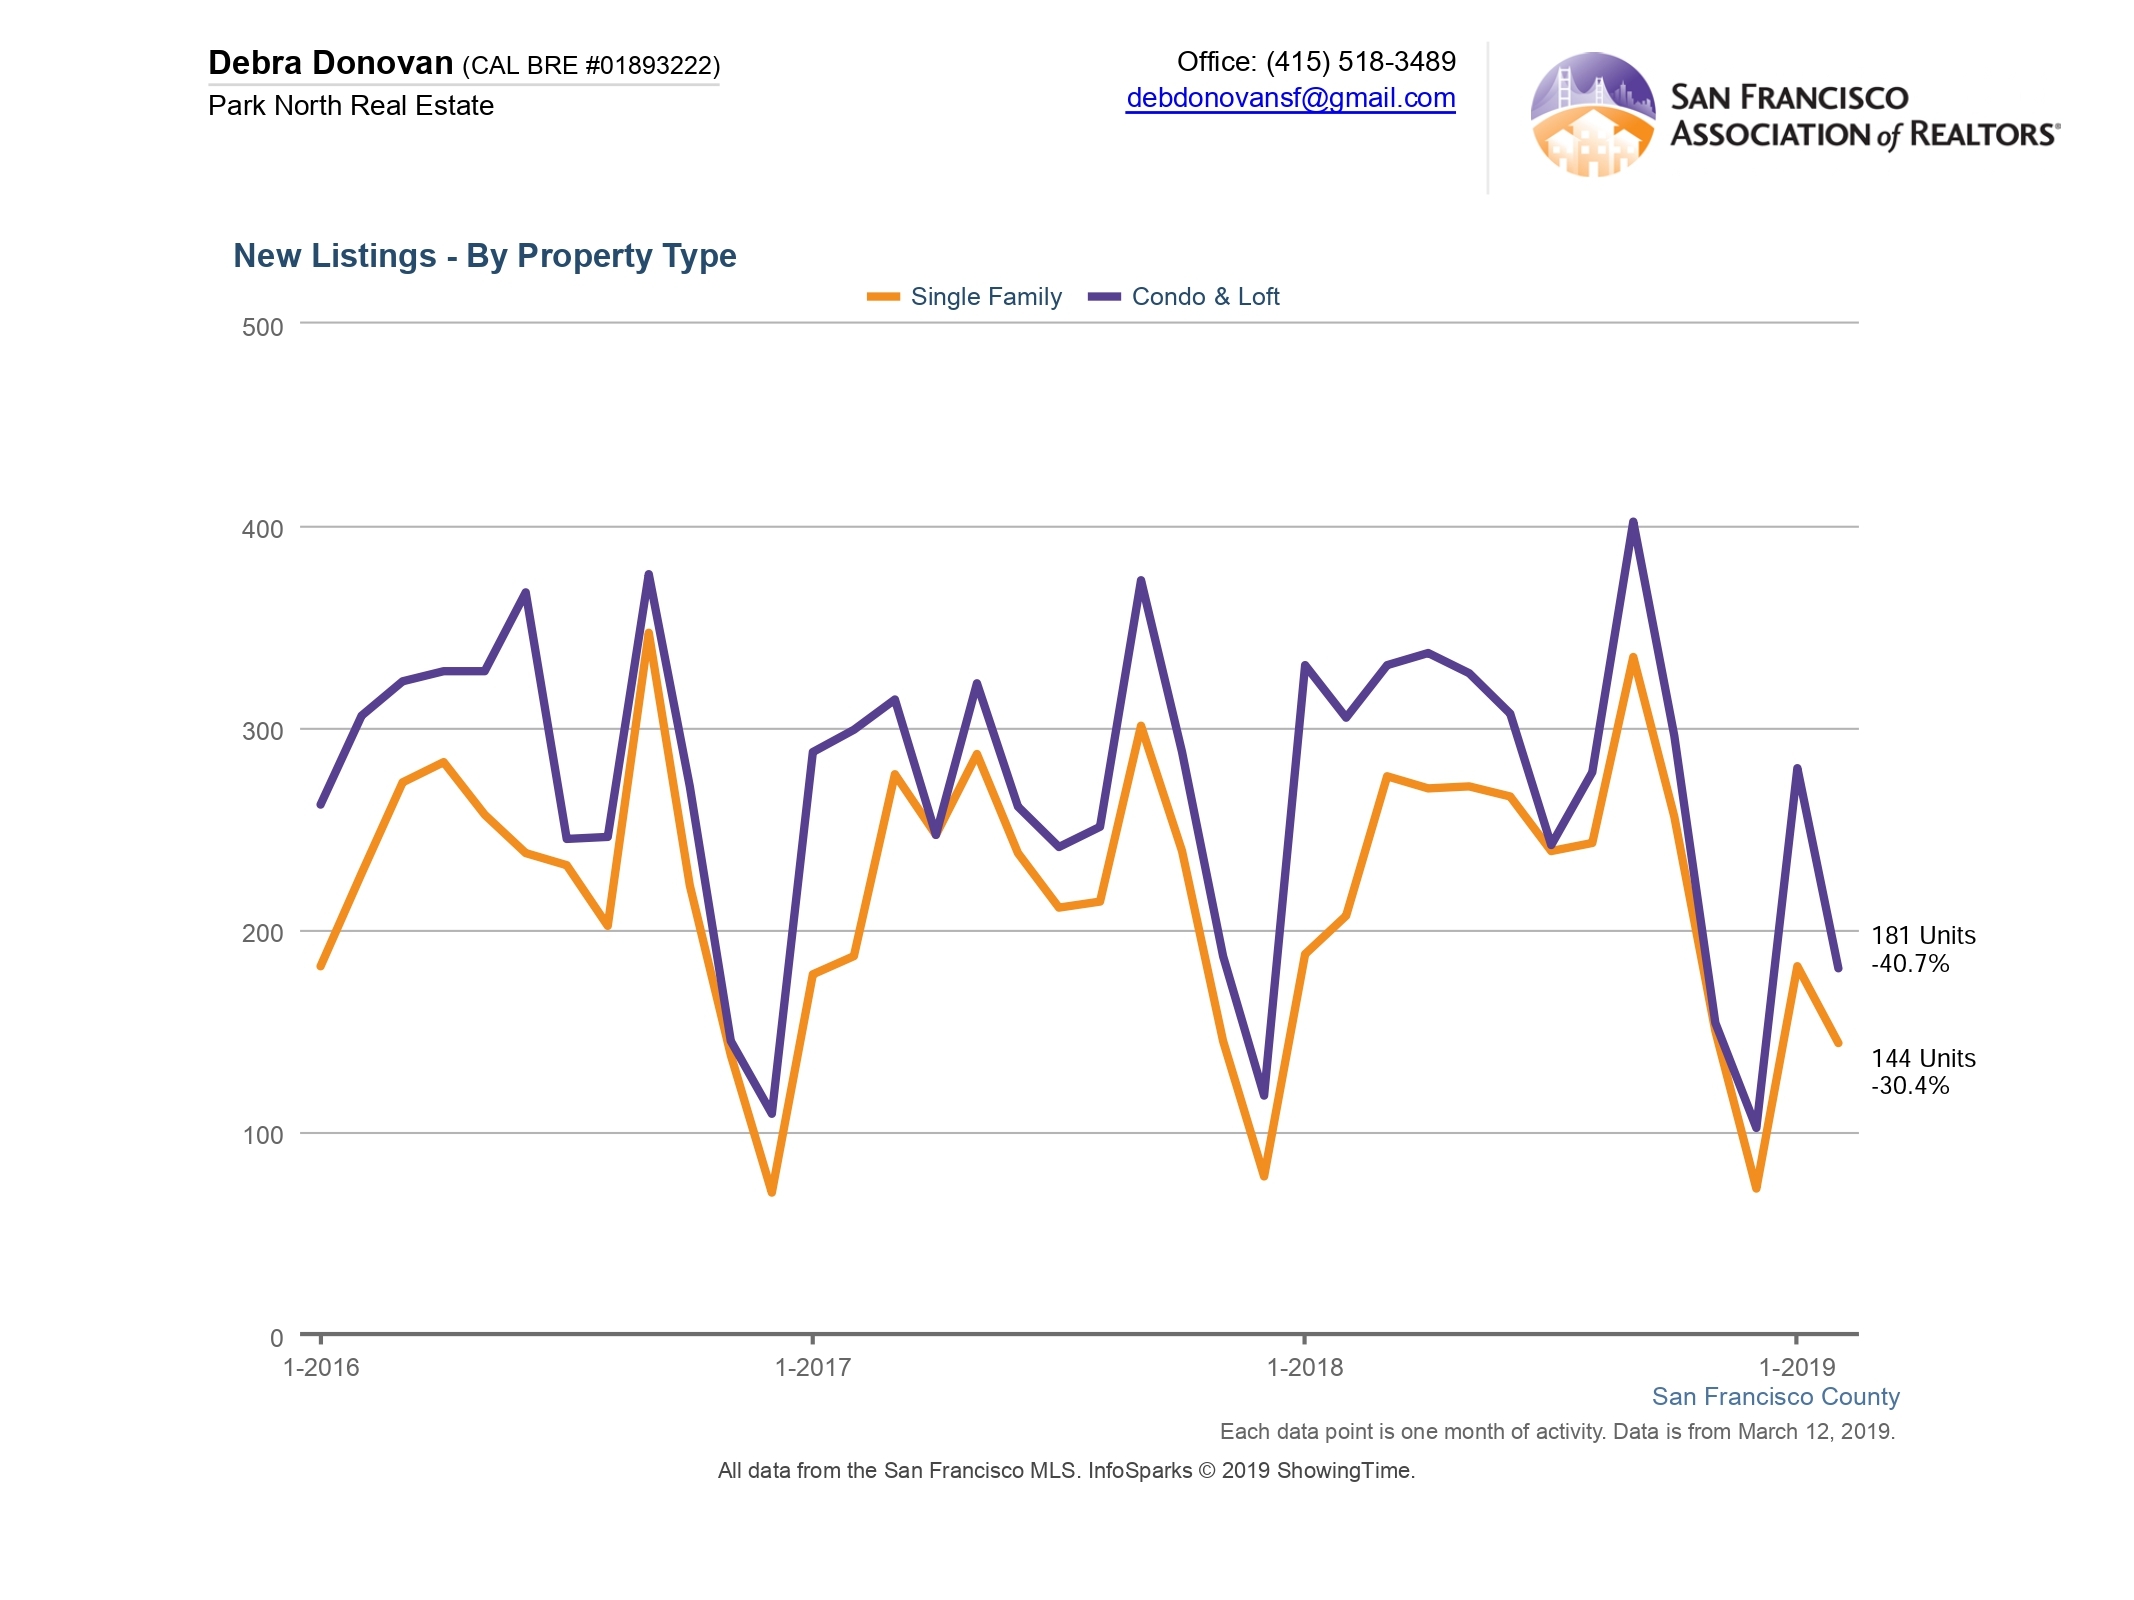
New Listings:
New listings of single family homes and condos/ lofts were down significantly, both compared to last month and last year. Only 144 new single family homes came on the market in February, down over 30% compared to February 2018 (which had 207 new listings), and January of this year (which had 182 new listings). Condo/ loft new listings were down more than 40%, much less than the 305 that came on the market in February 2018 and almost 100 fewer than the 280 that came on market in January of this year.
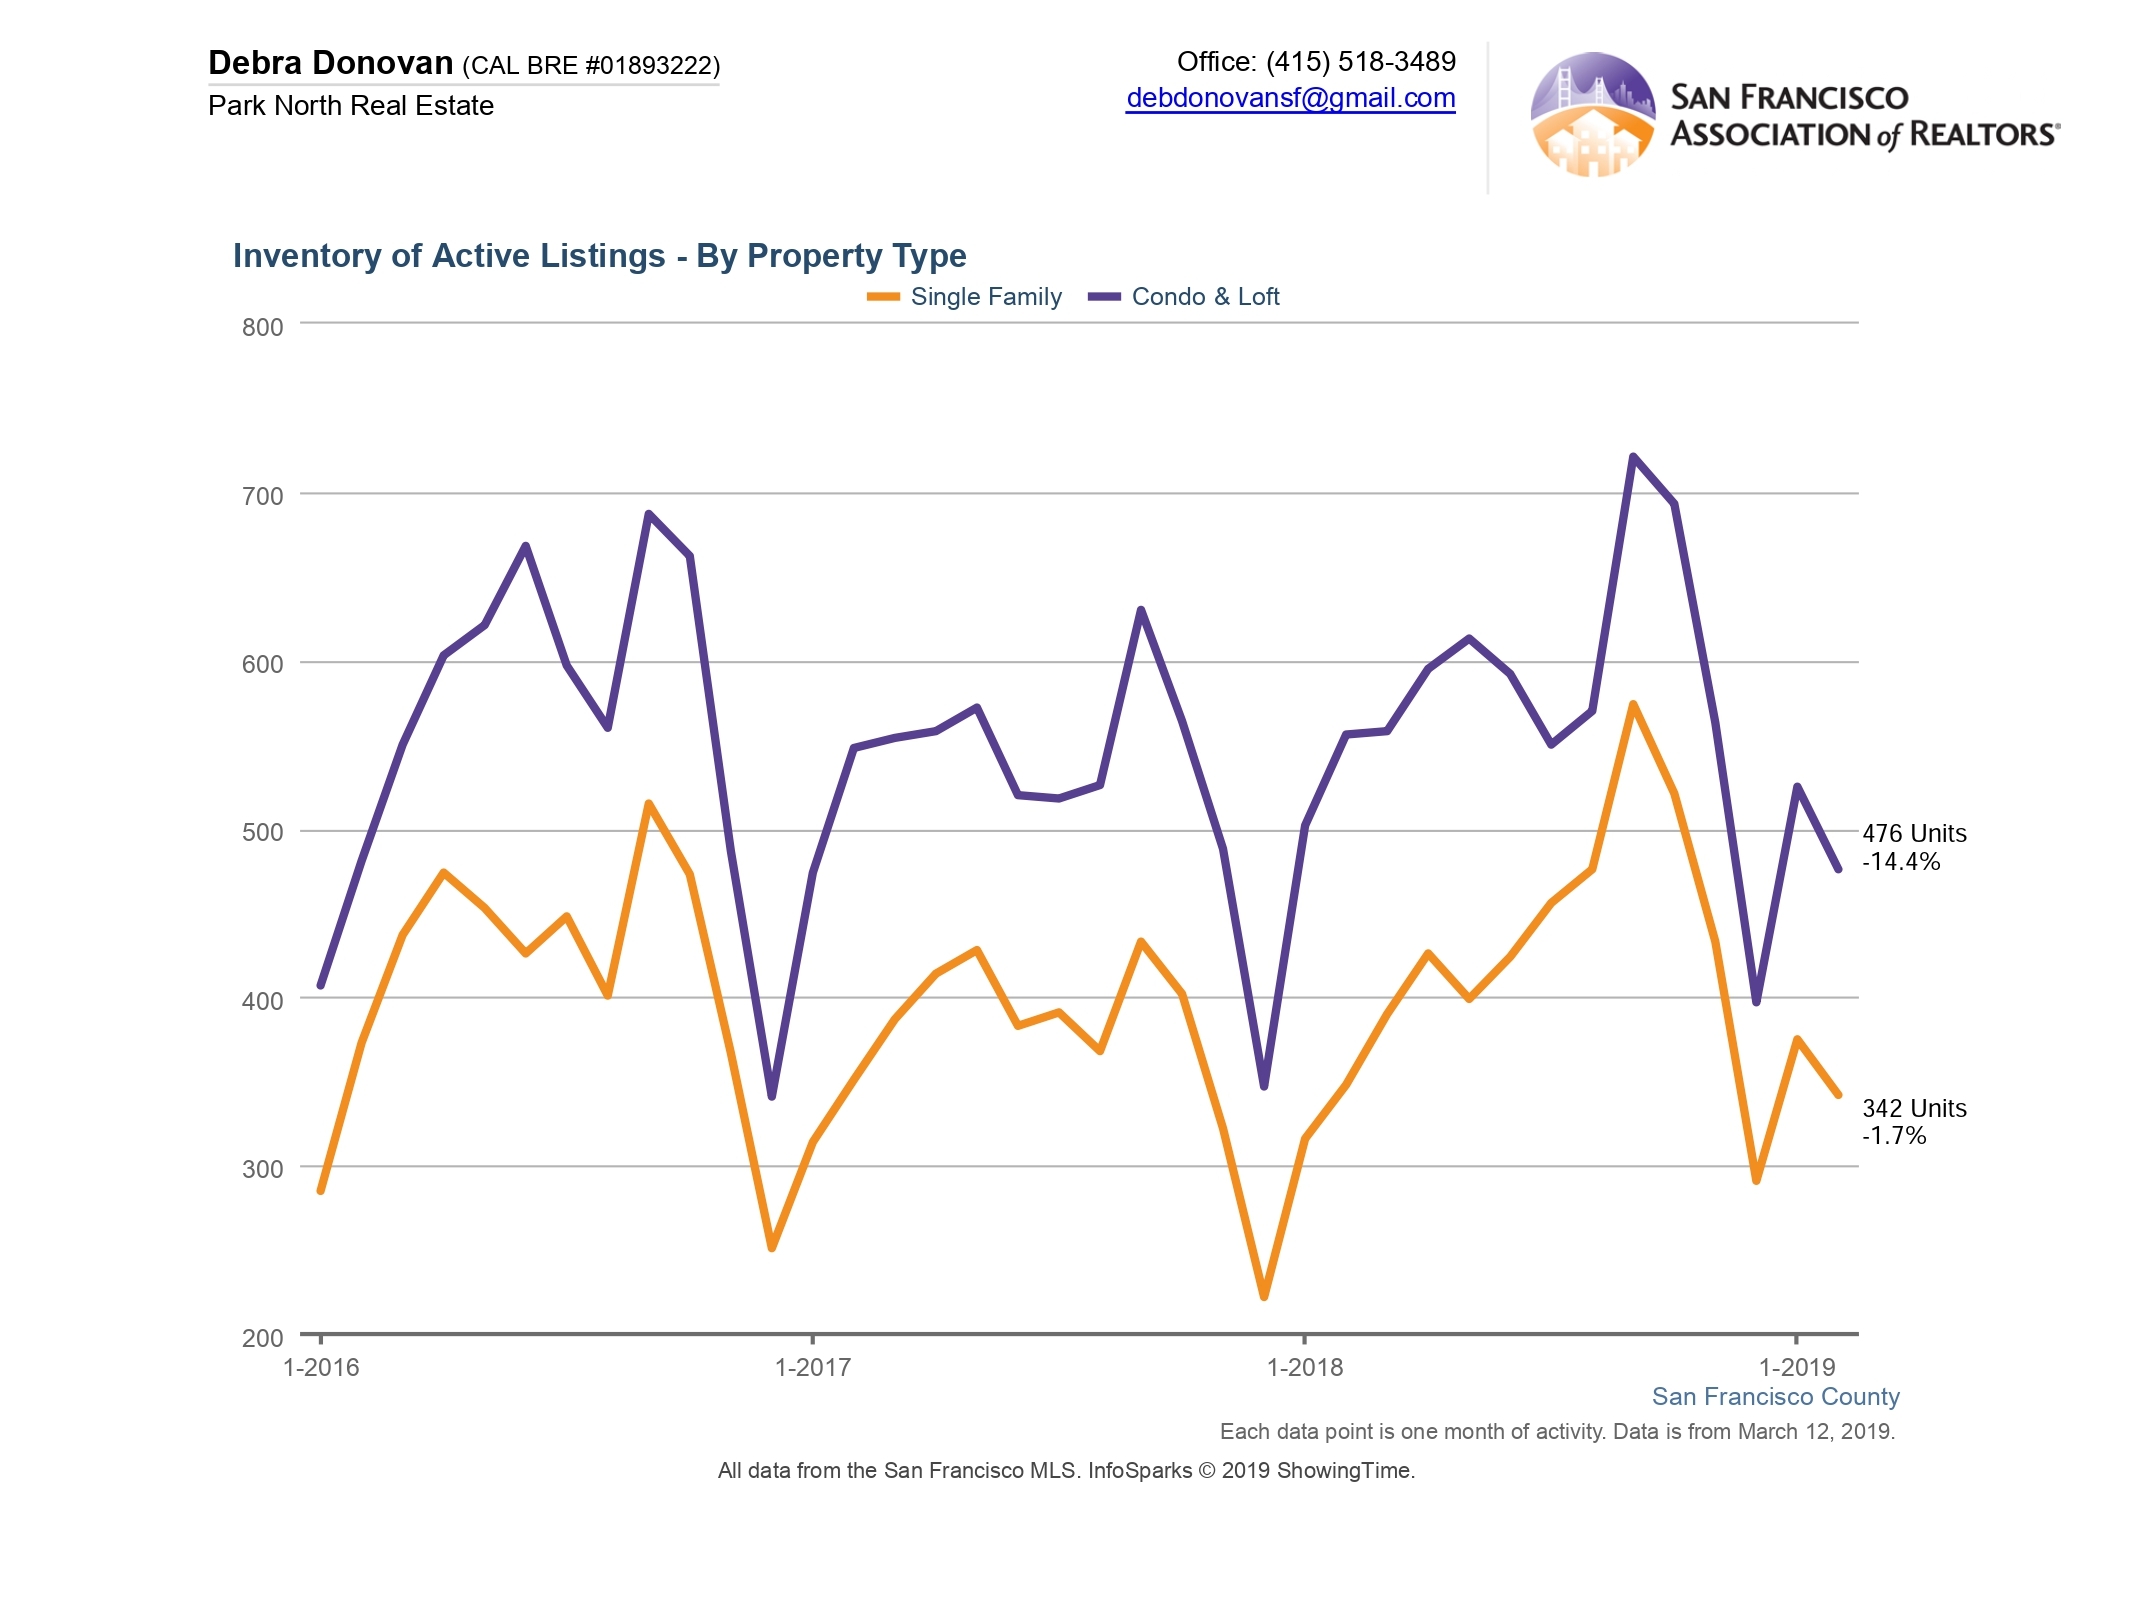
Active Listings:
Active listings, the number of listings still on the market as active at the end of the month, were also down, though single family homes not as much as condos and lofts. In a town where fewer single family homes are being built or are available for sale, they remain the “holy grail” for many buyers and tend to get into contract quickly.
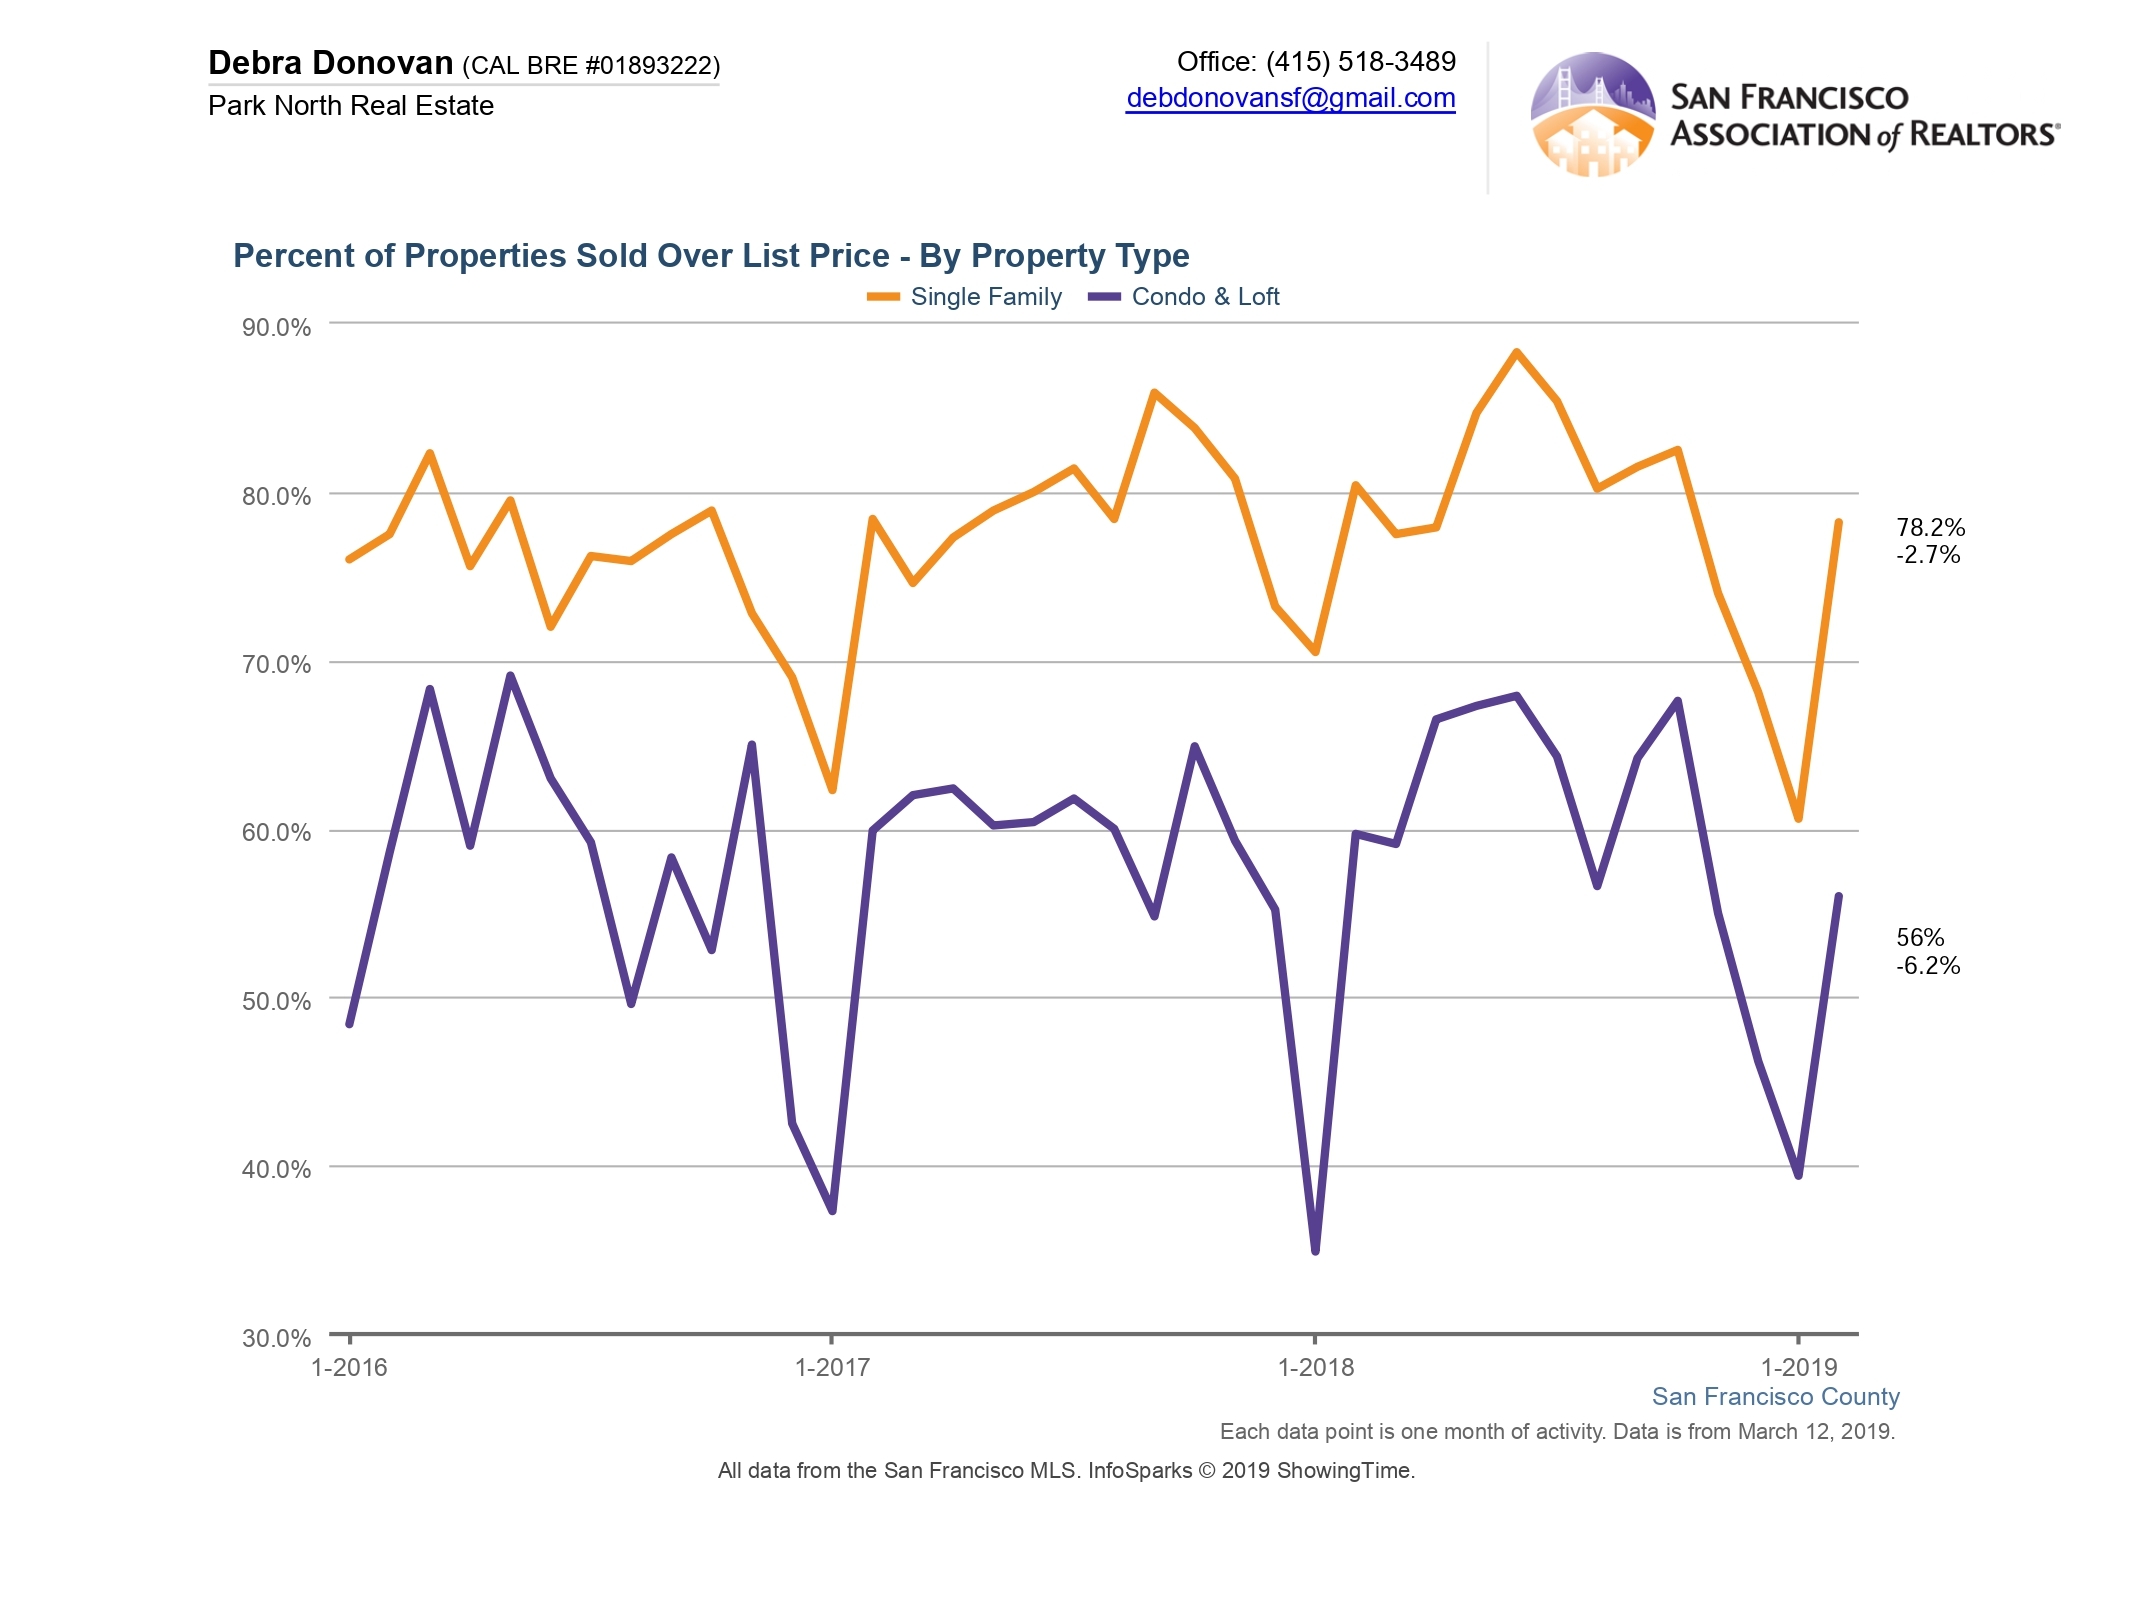
Percentage of Properties Selling Over List Price:
More properties than not continue to sell for over their asking price in San Francisco. 78% of single family homes sold for over their list price in February. 56% of condos and lofts sold for over their asking price.
Average Percentage of List Price Received:
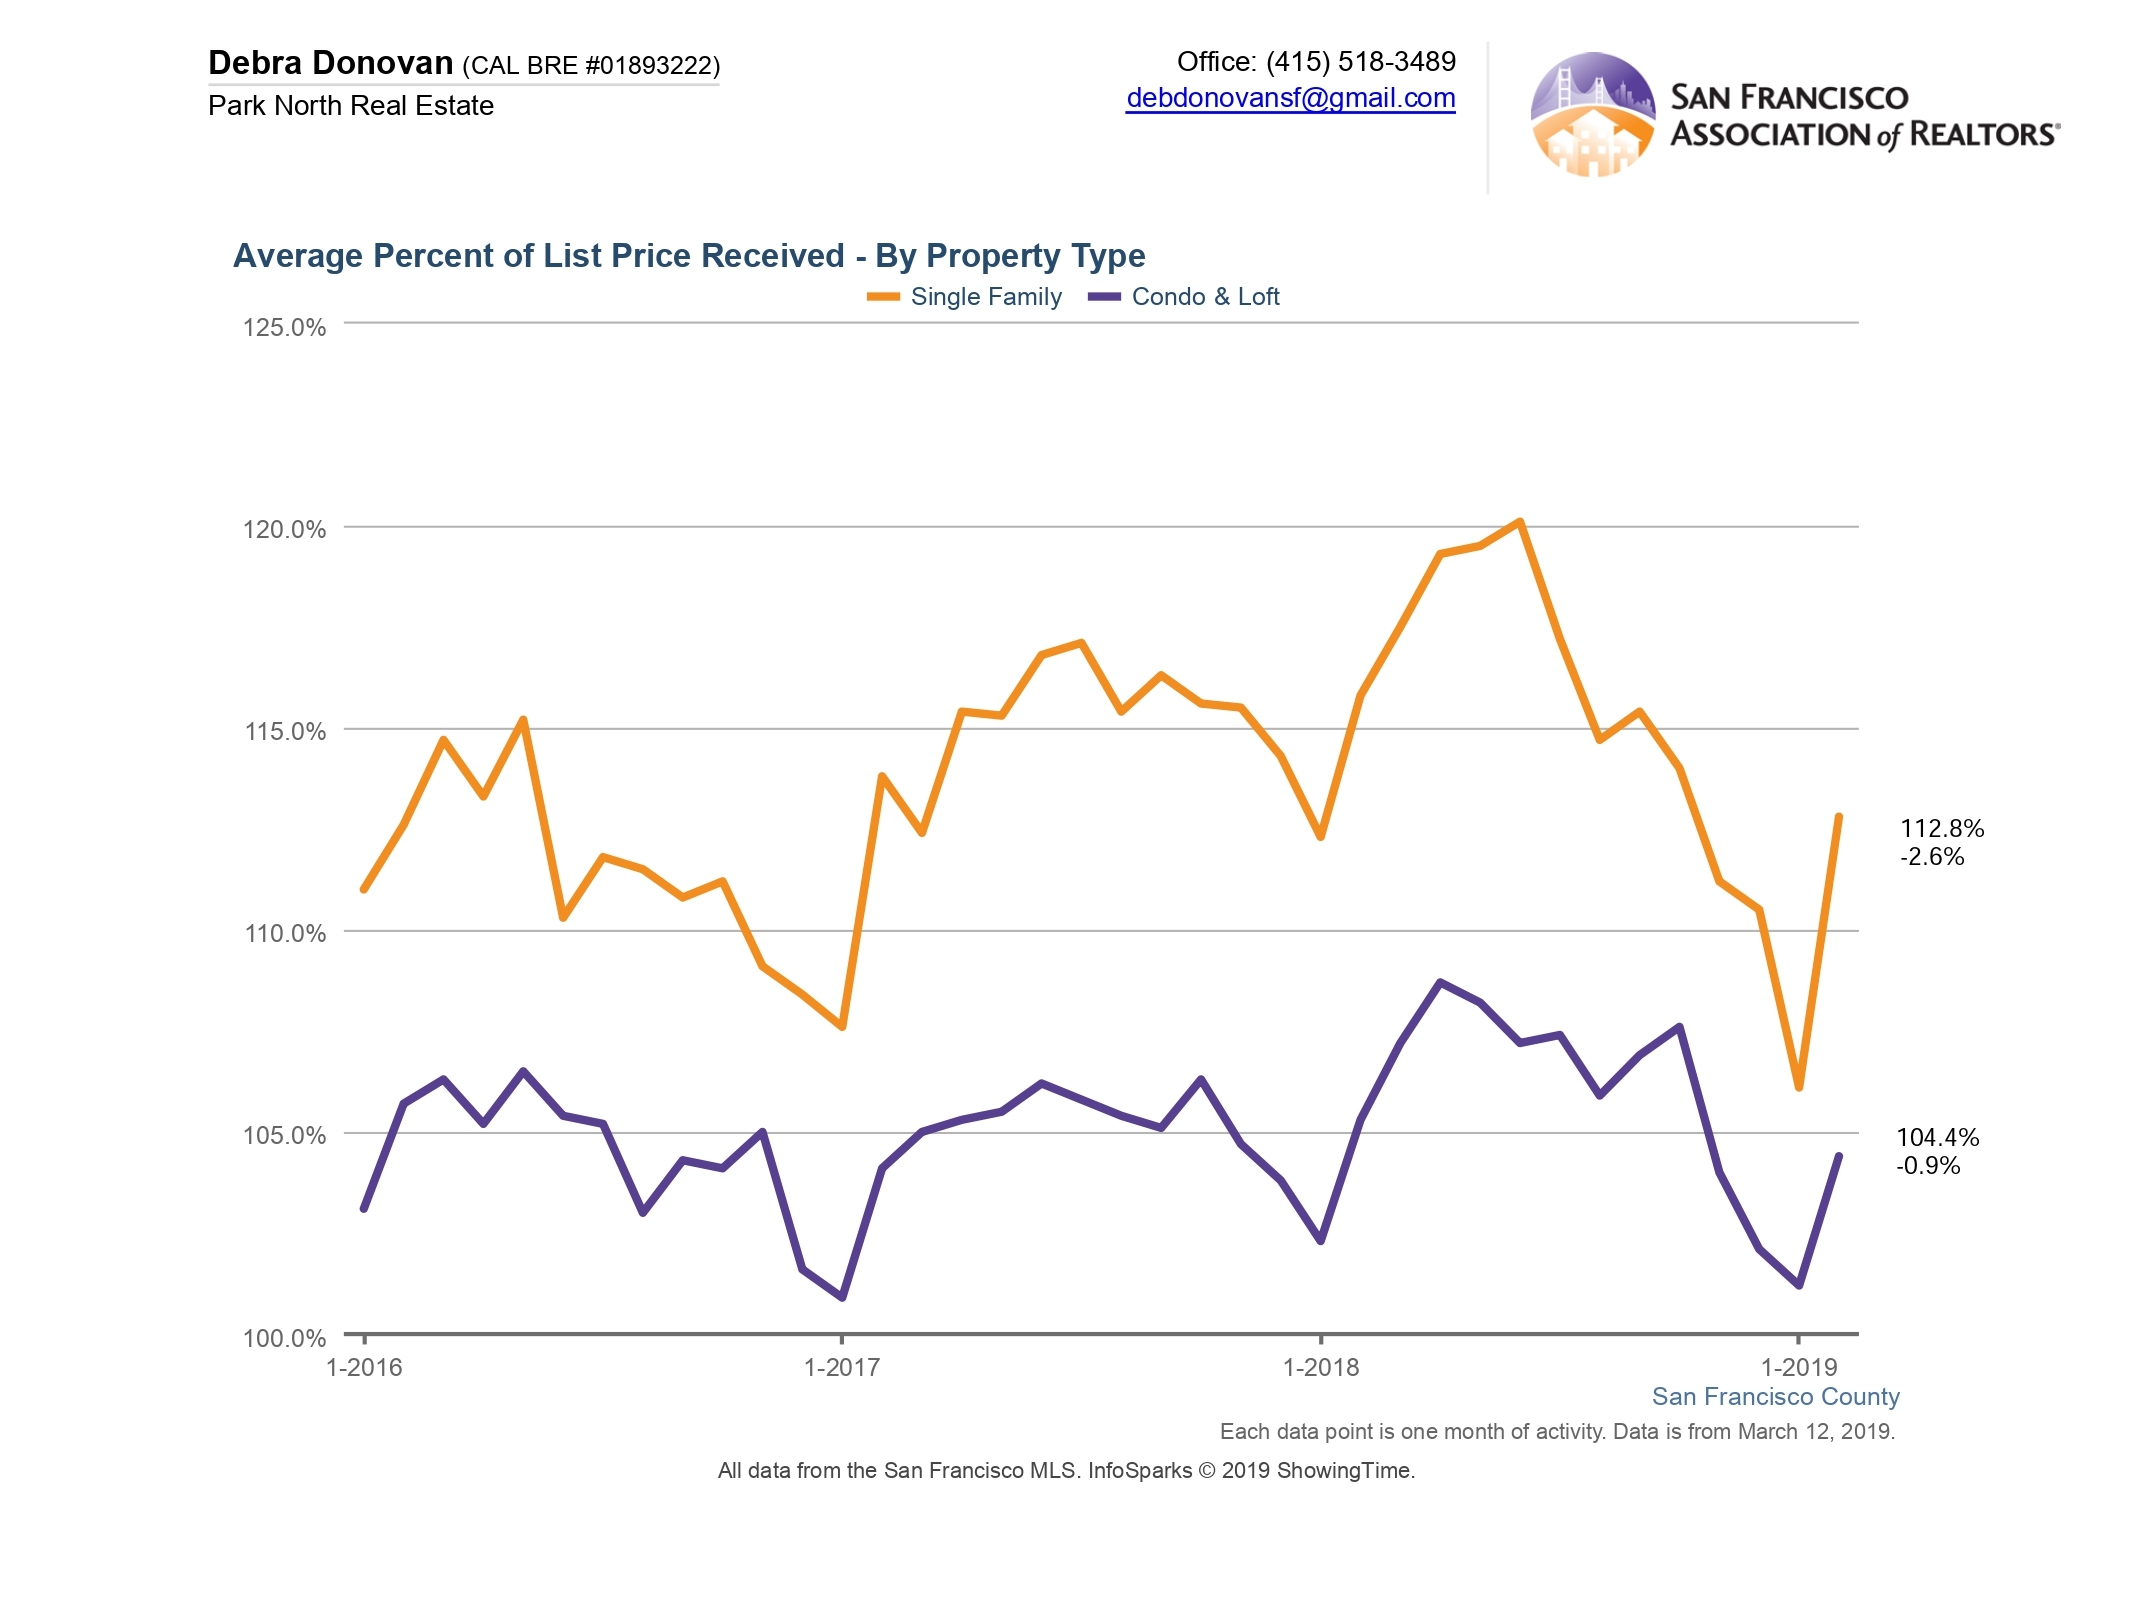
On average, single family homes sold for 113% of their asking price in February. This was down slightly from February of 2018. Condo’s and lofts sold on average just under 105% of their asking price, down just a smidge compared to the same month last year.
Months Supply of Inventory:
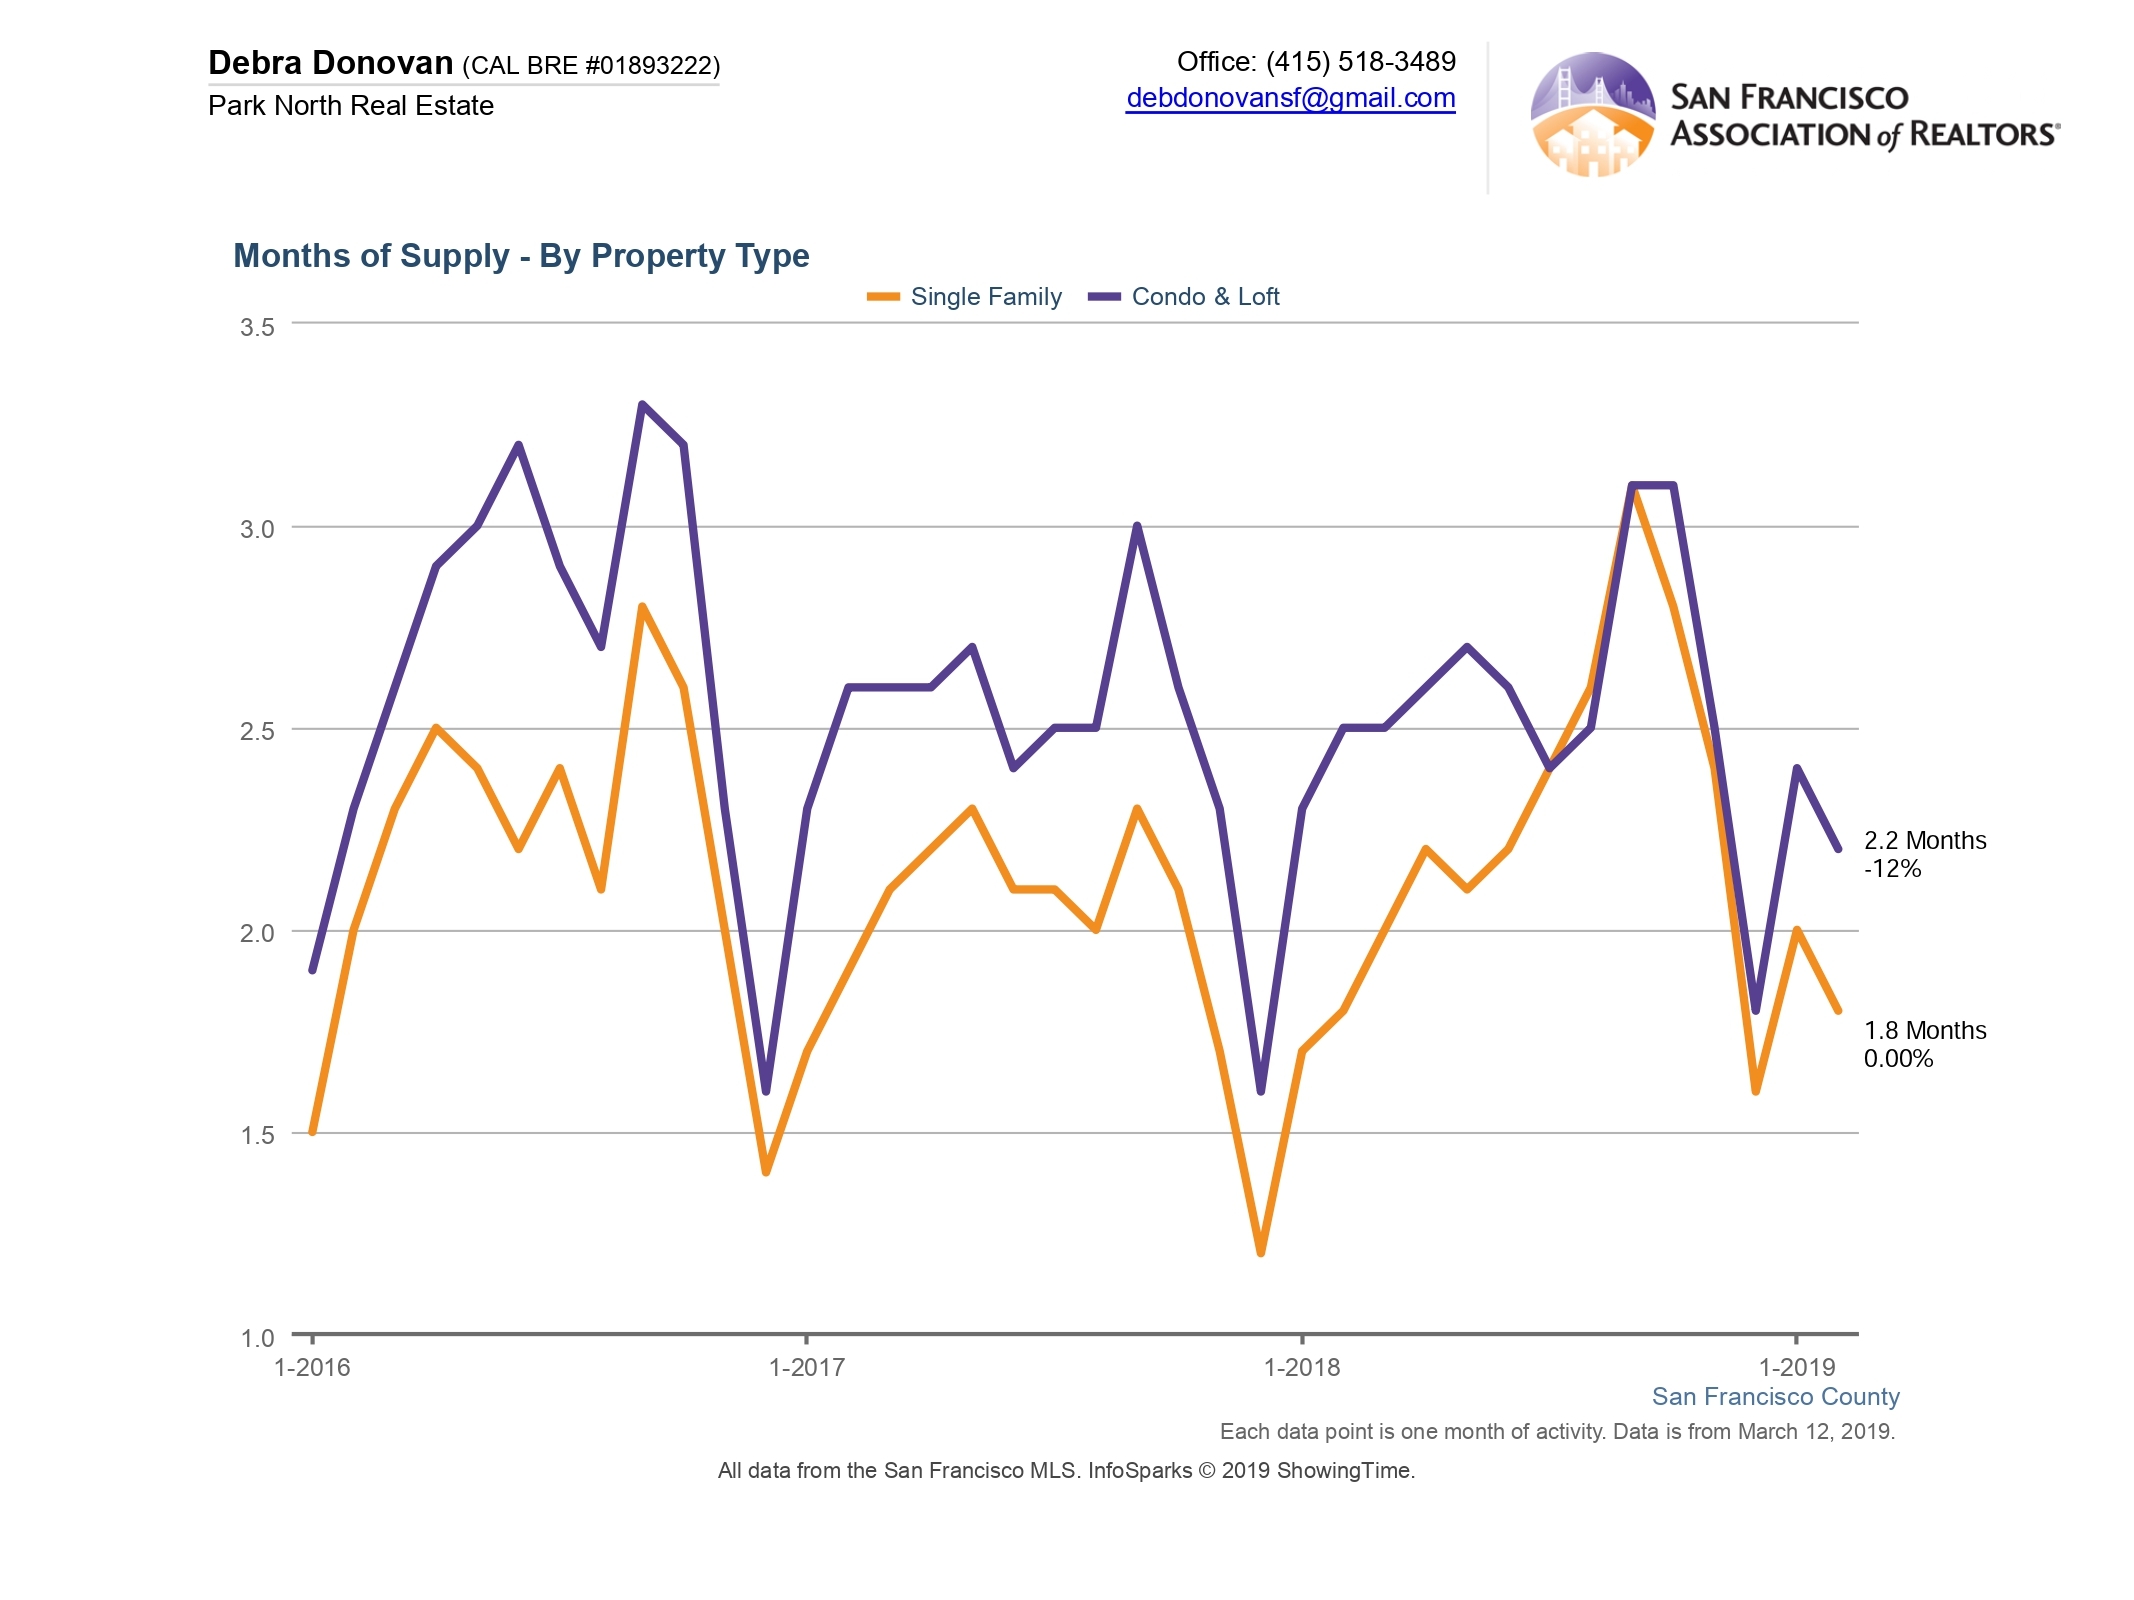
MSI for single family homes again dipped under 2 months in February, which remained unchanged compared to February of 2018. Condos and lofts dropped 12% compared to the same month last year to 2.2 months.
Average Days on Market:
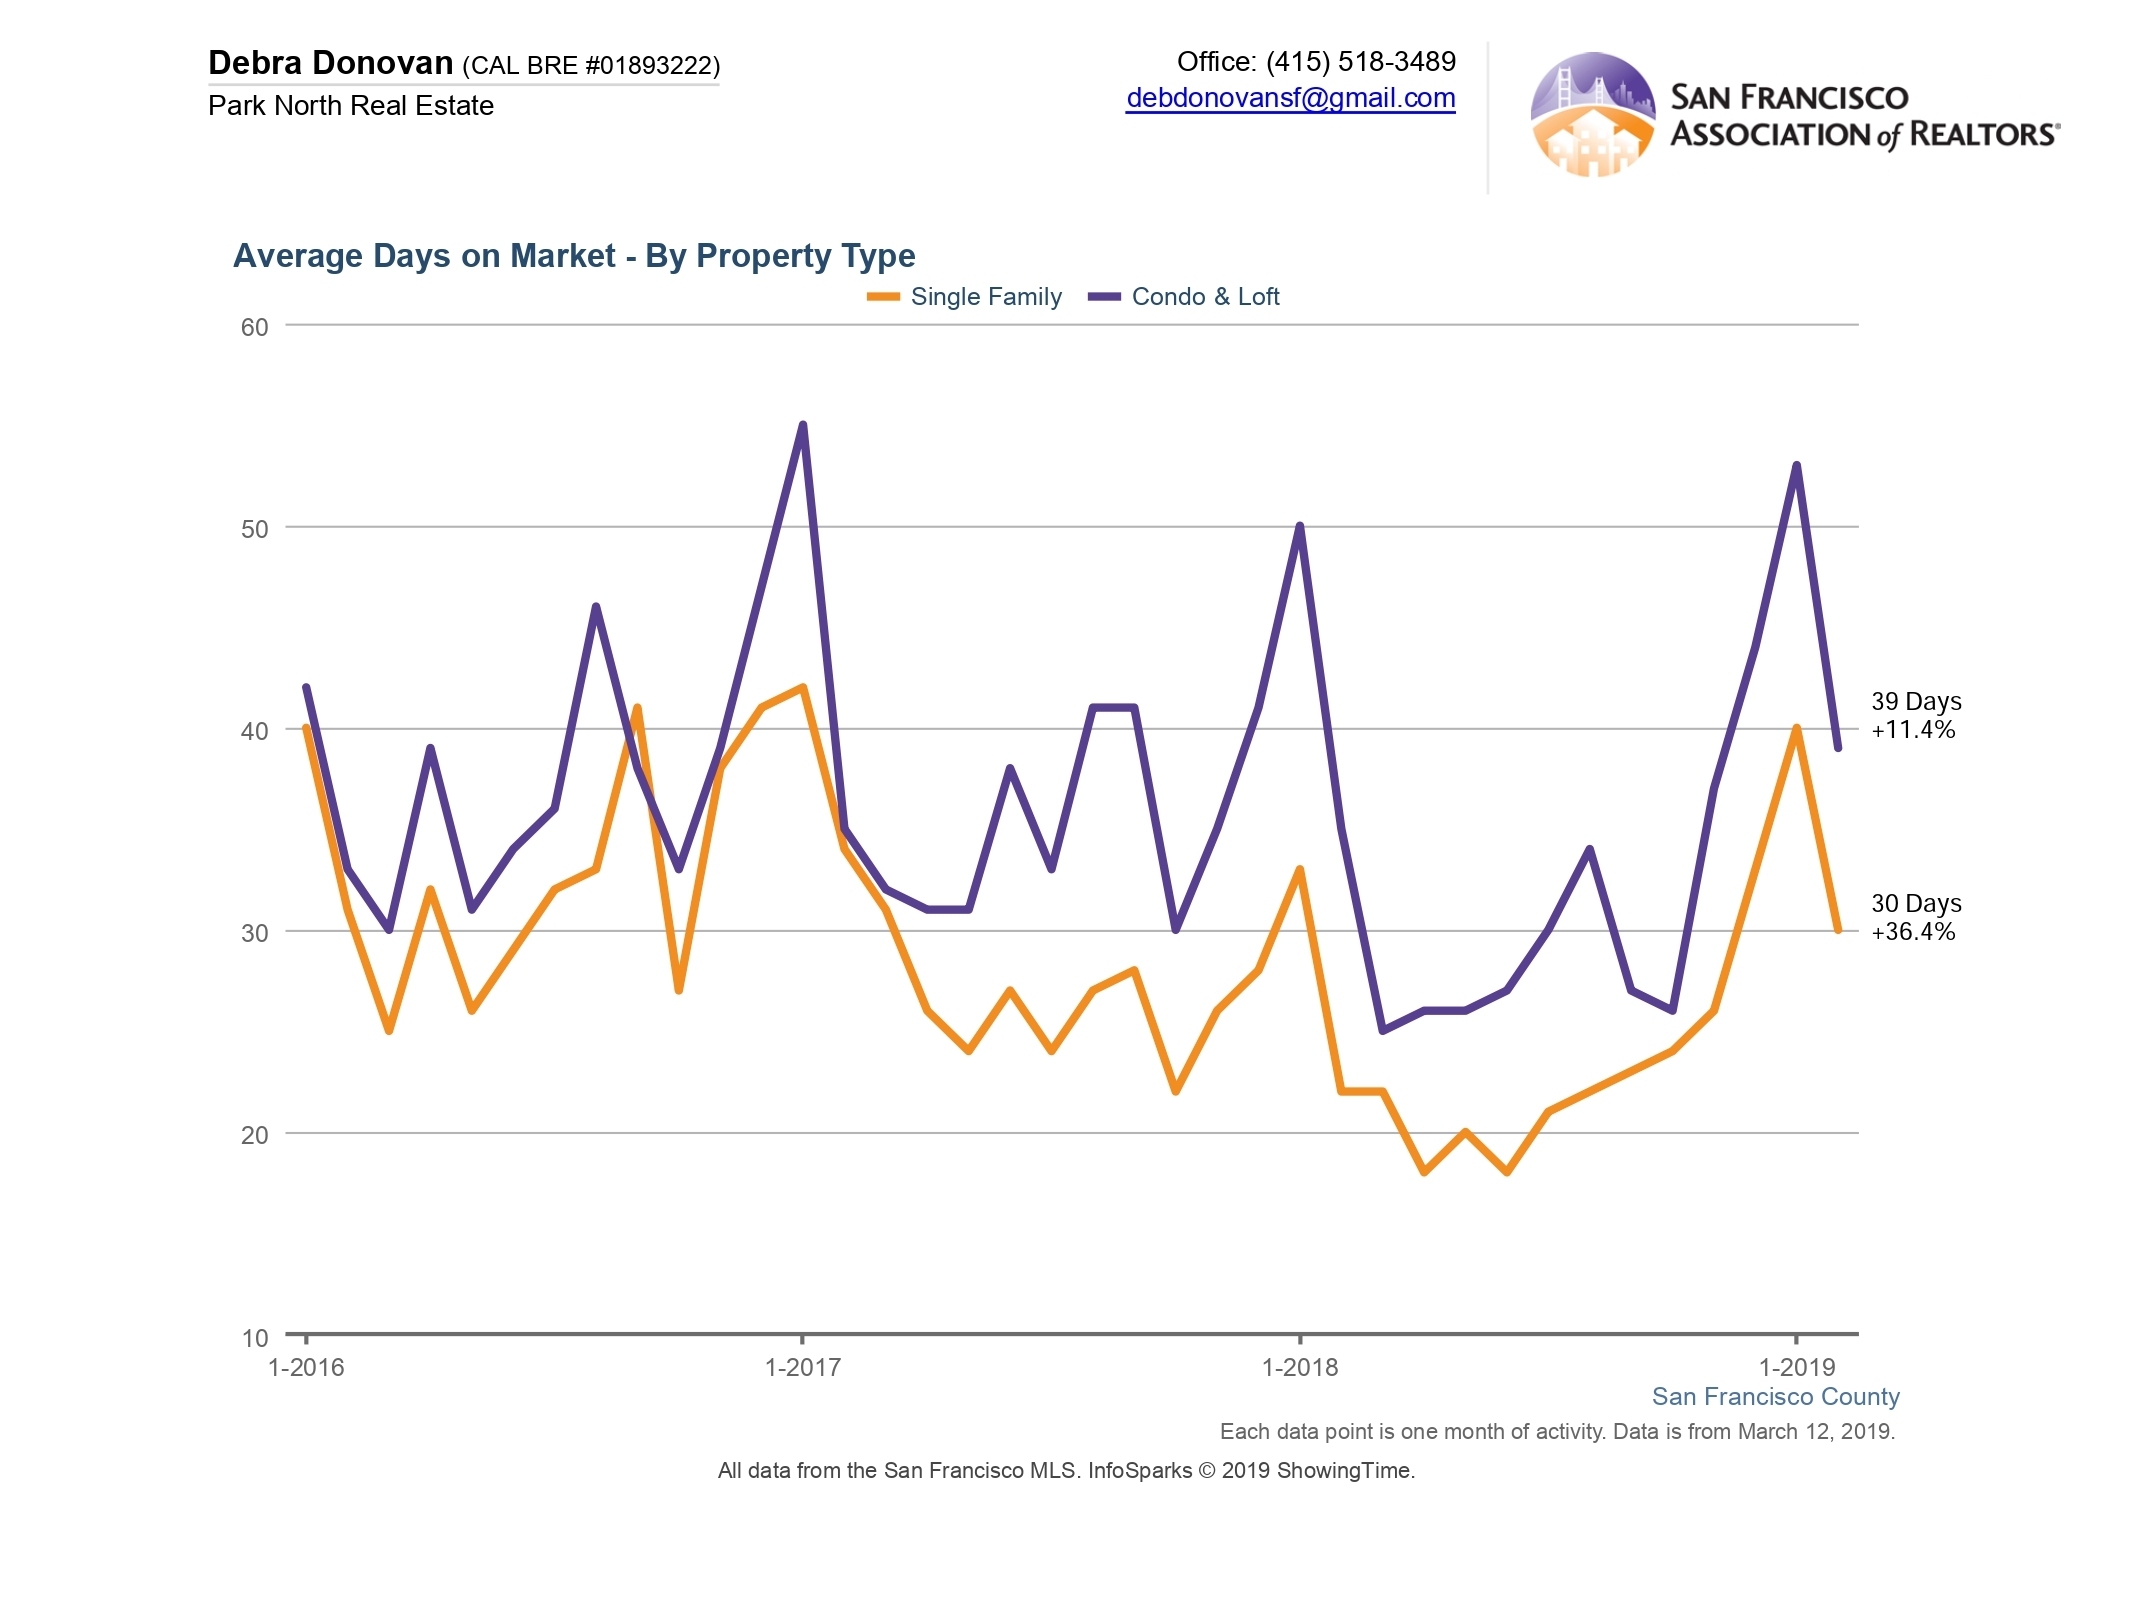
Single family homes spent an average of 30 days on the market before accepting an offer in February. This is up significantly, over 36%, compared to Februrary of last year. Condos and lofts spent an average of 39 days on the market, also up compared to last year. But both spent less time on market compared to January of this year.
The fine print: All information deemed reliable but not guaranteed or warranted. Data comes from MLS so does not include off-market and most new construction condo sales. The San Francisco real estate market is dynamic so statistics can change on a daily basis. These statistics are meant to be a snapshot of the day and time they were pulled.


