As we move into month 2 of the Coronavirus shelter-in-place, real estate in San Francisco and the Bay Area continues to chug along, albeit in a much more limited way. The following statistics represent the market in March. So sales statistics are based on properties that were mostly in escrow prior or just as the shelter-in-place order was given to start on March 17th. Therefore we’re not going to see any statistics reflecting how pricing was effected by the shelter, if it was at all, until next month or the month after. However, what we can see from these numbers is how greatly inventory was effected after the March 17th order. Many sellers decided to place their home sales on hold when the order came down. Some have already returned to the market (with very limited or only virtual showings), while others are continuing to wait out the shelter-in-place. With that context in mind, below are the March 2020 San Francisco real estate market statistics.
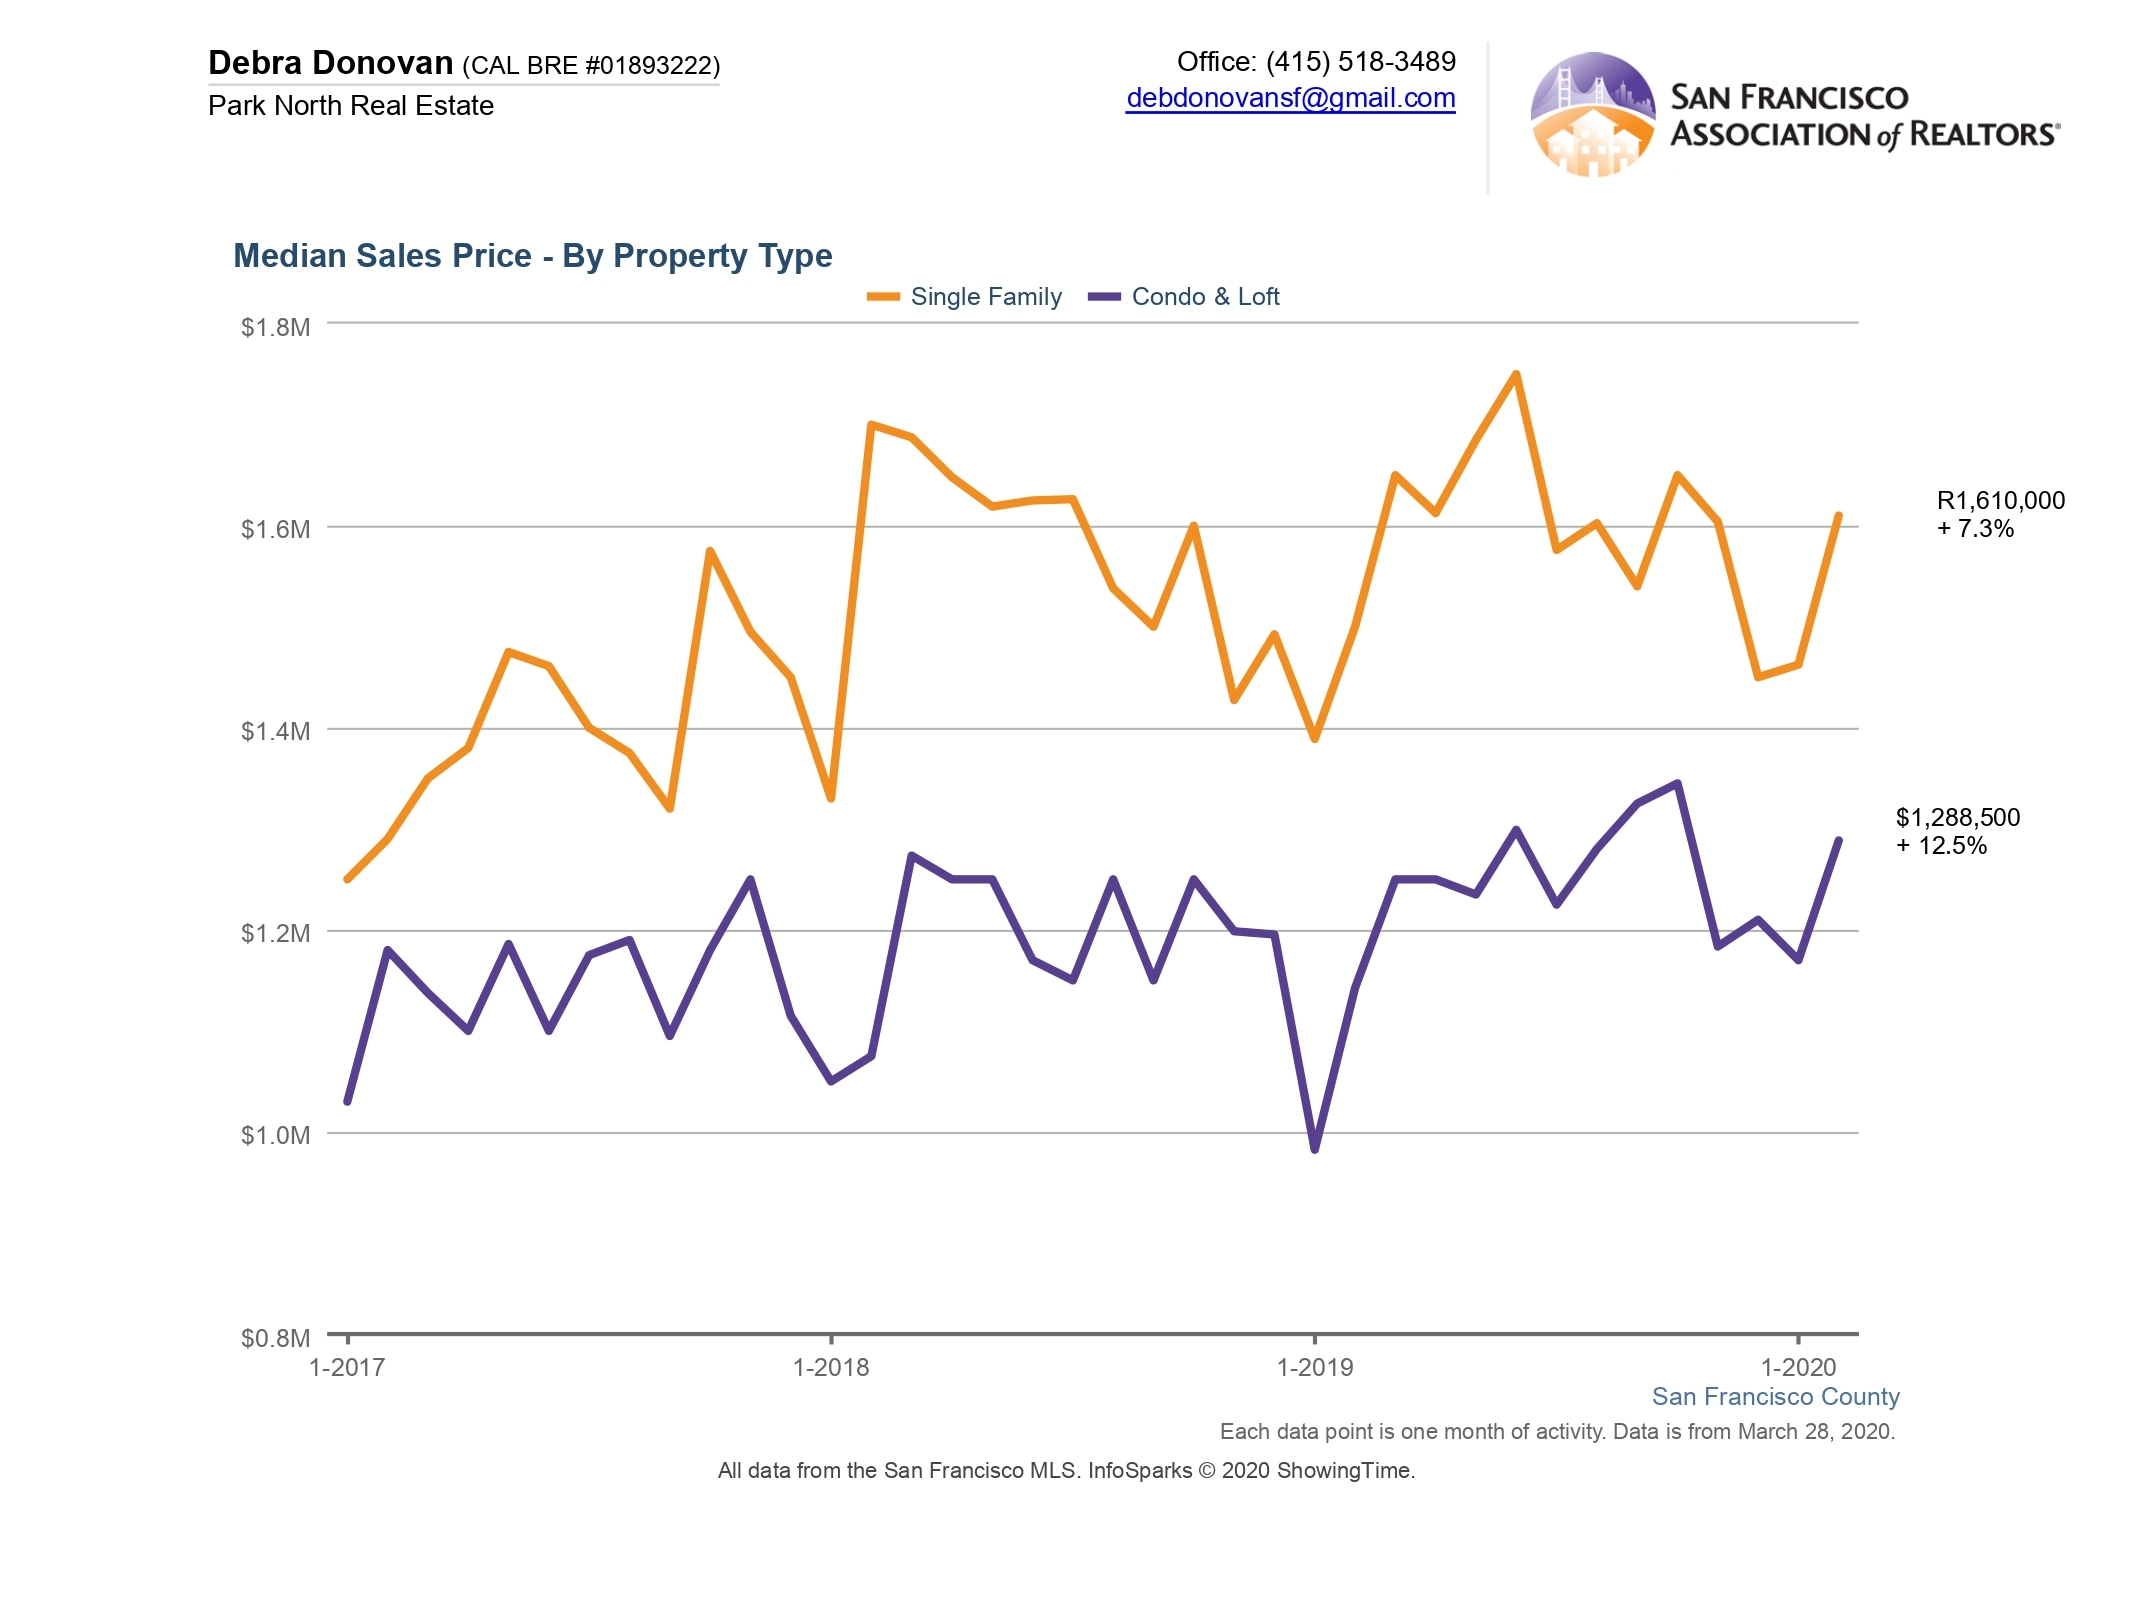
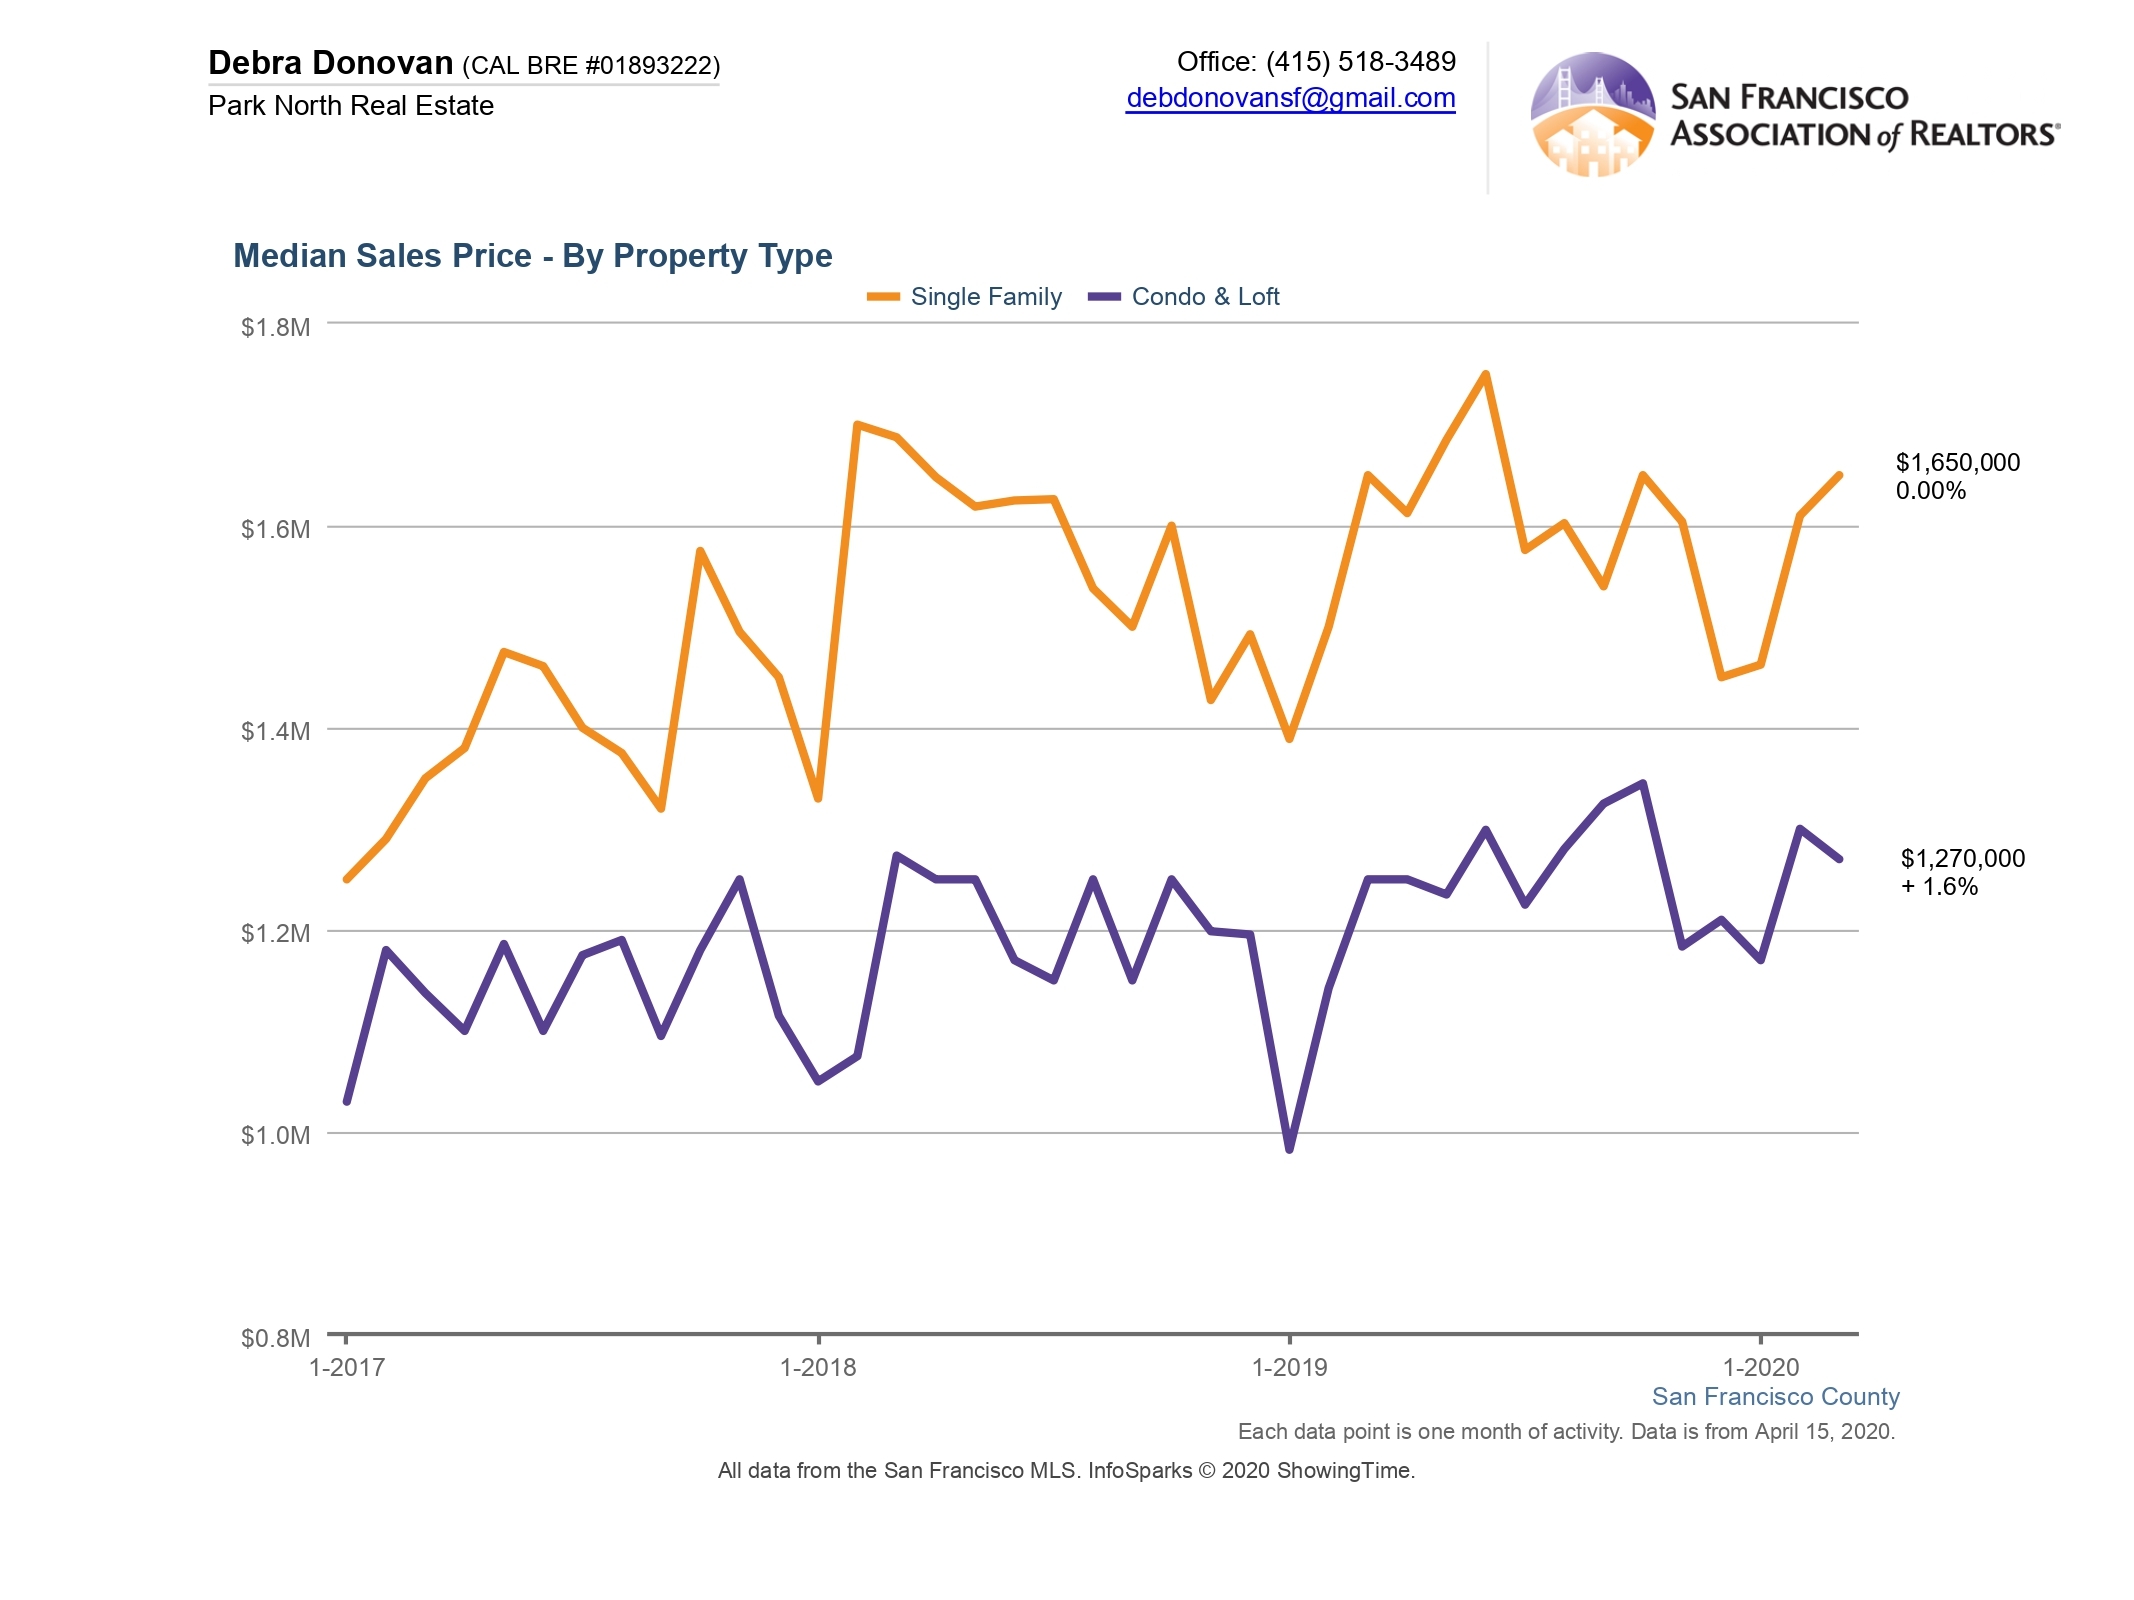
Median Sales Price:
The median price for a single family home in March was $1,650,000. This is up compared to last month but no change compared to the same month last year. Condos and lofts had a median price of $1,270,000, up 1.6% compared to last March but lower than last month’s median sales price. Median sales prices remain steady for homes that are closing.
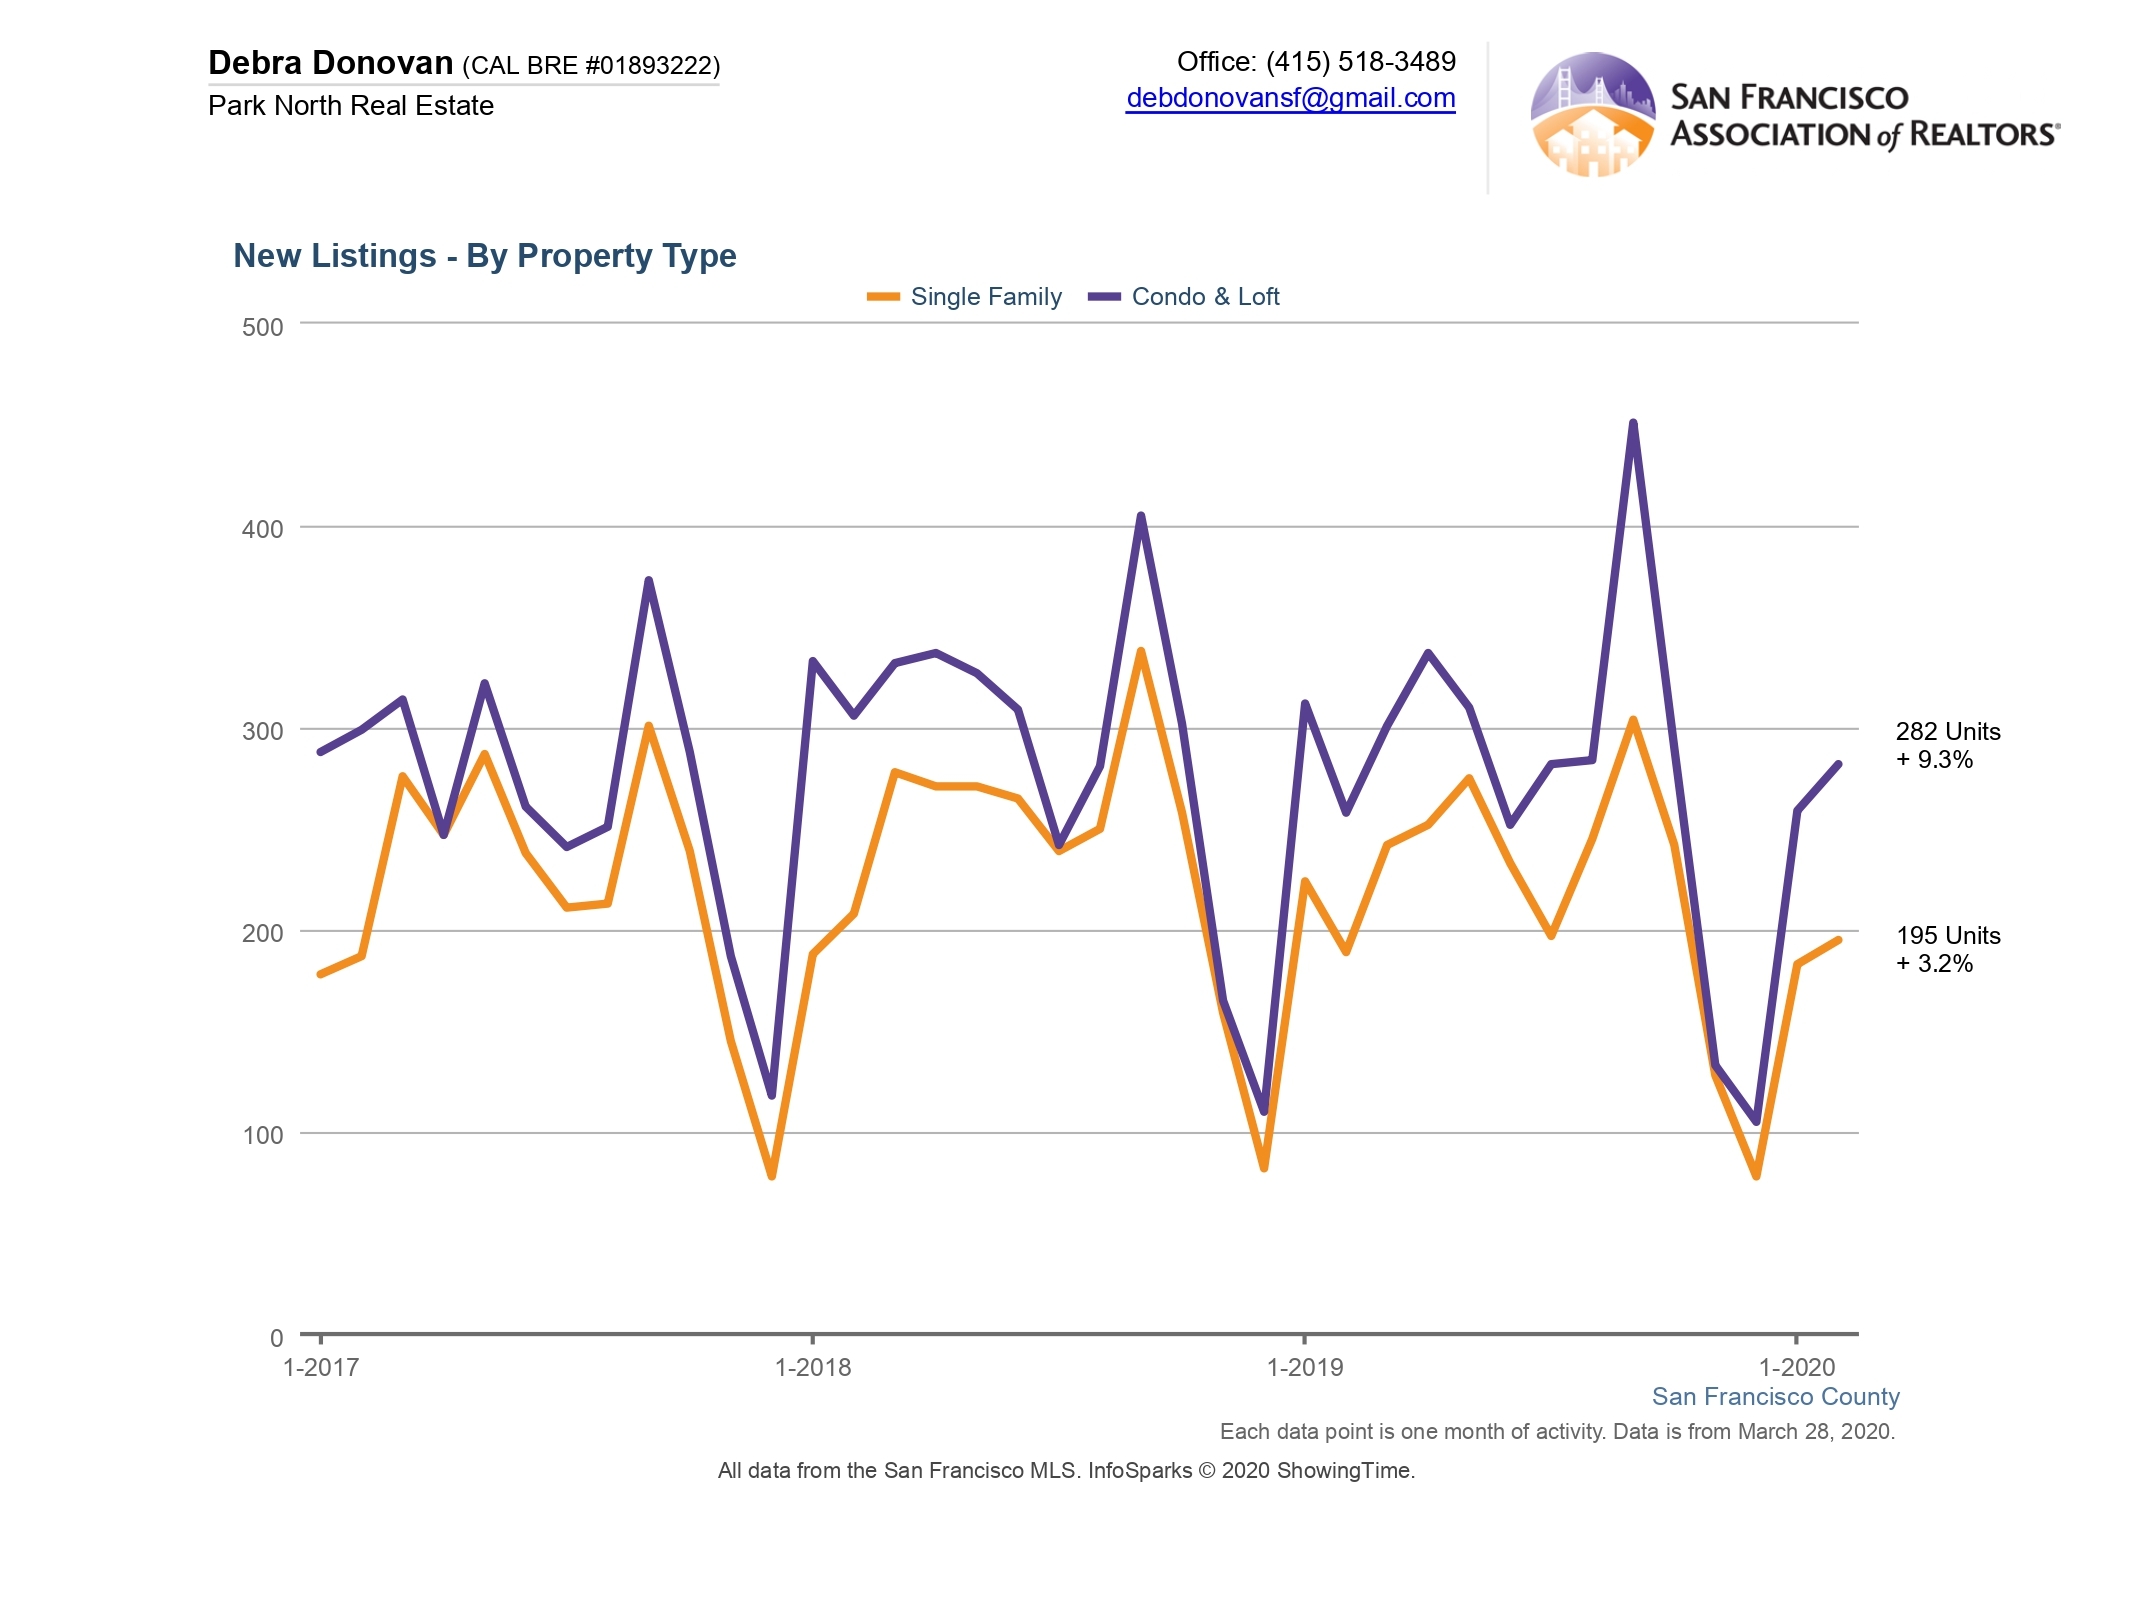
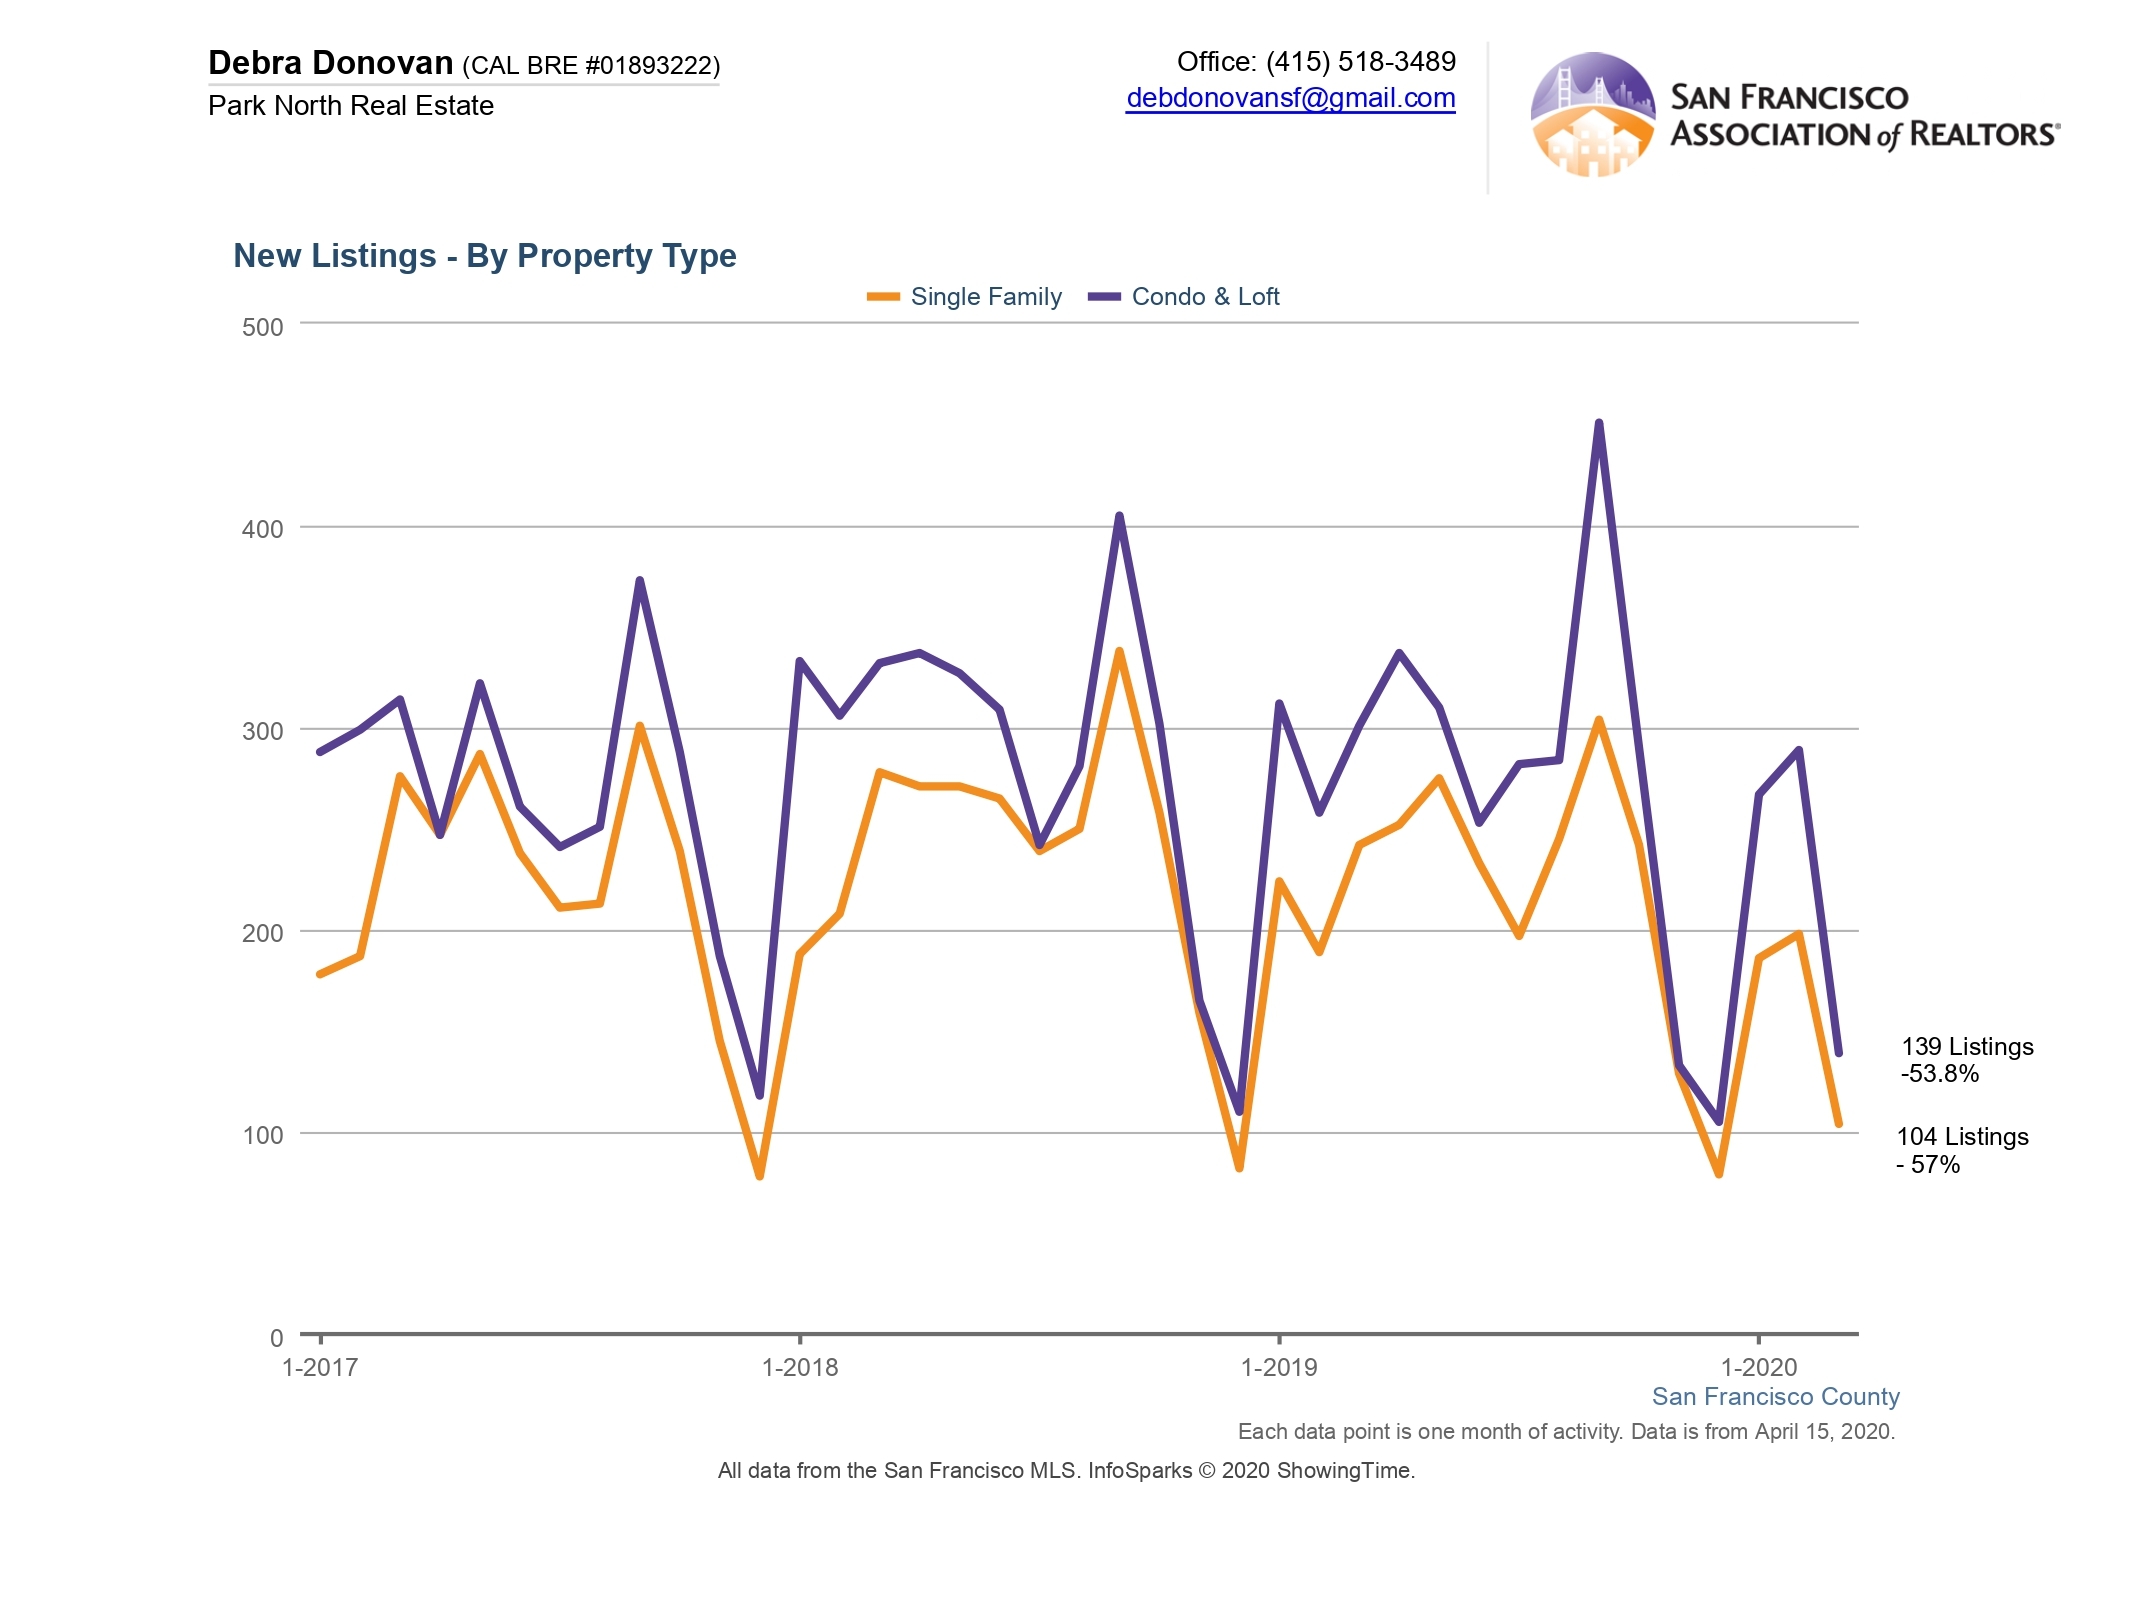
New Listings:
Here’s where we see the effect of the March 17 Shelter-in-Place order. New single family homes were down 57% compared to the same month last year (and almost half of the number of new listings we had in February). Condos and lofts were down 54% and down more than half of what we had in February. March is usually the start of our Spring selling season, but as the shelter order came down many sellers held off putting their home on the market or pulled their home off the market if it was already on.
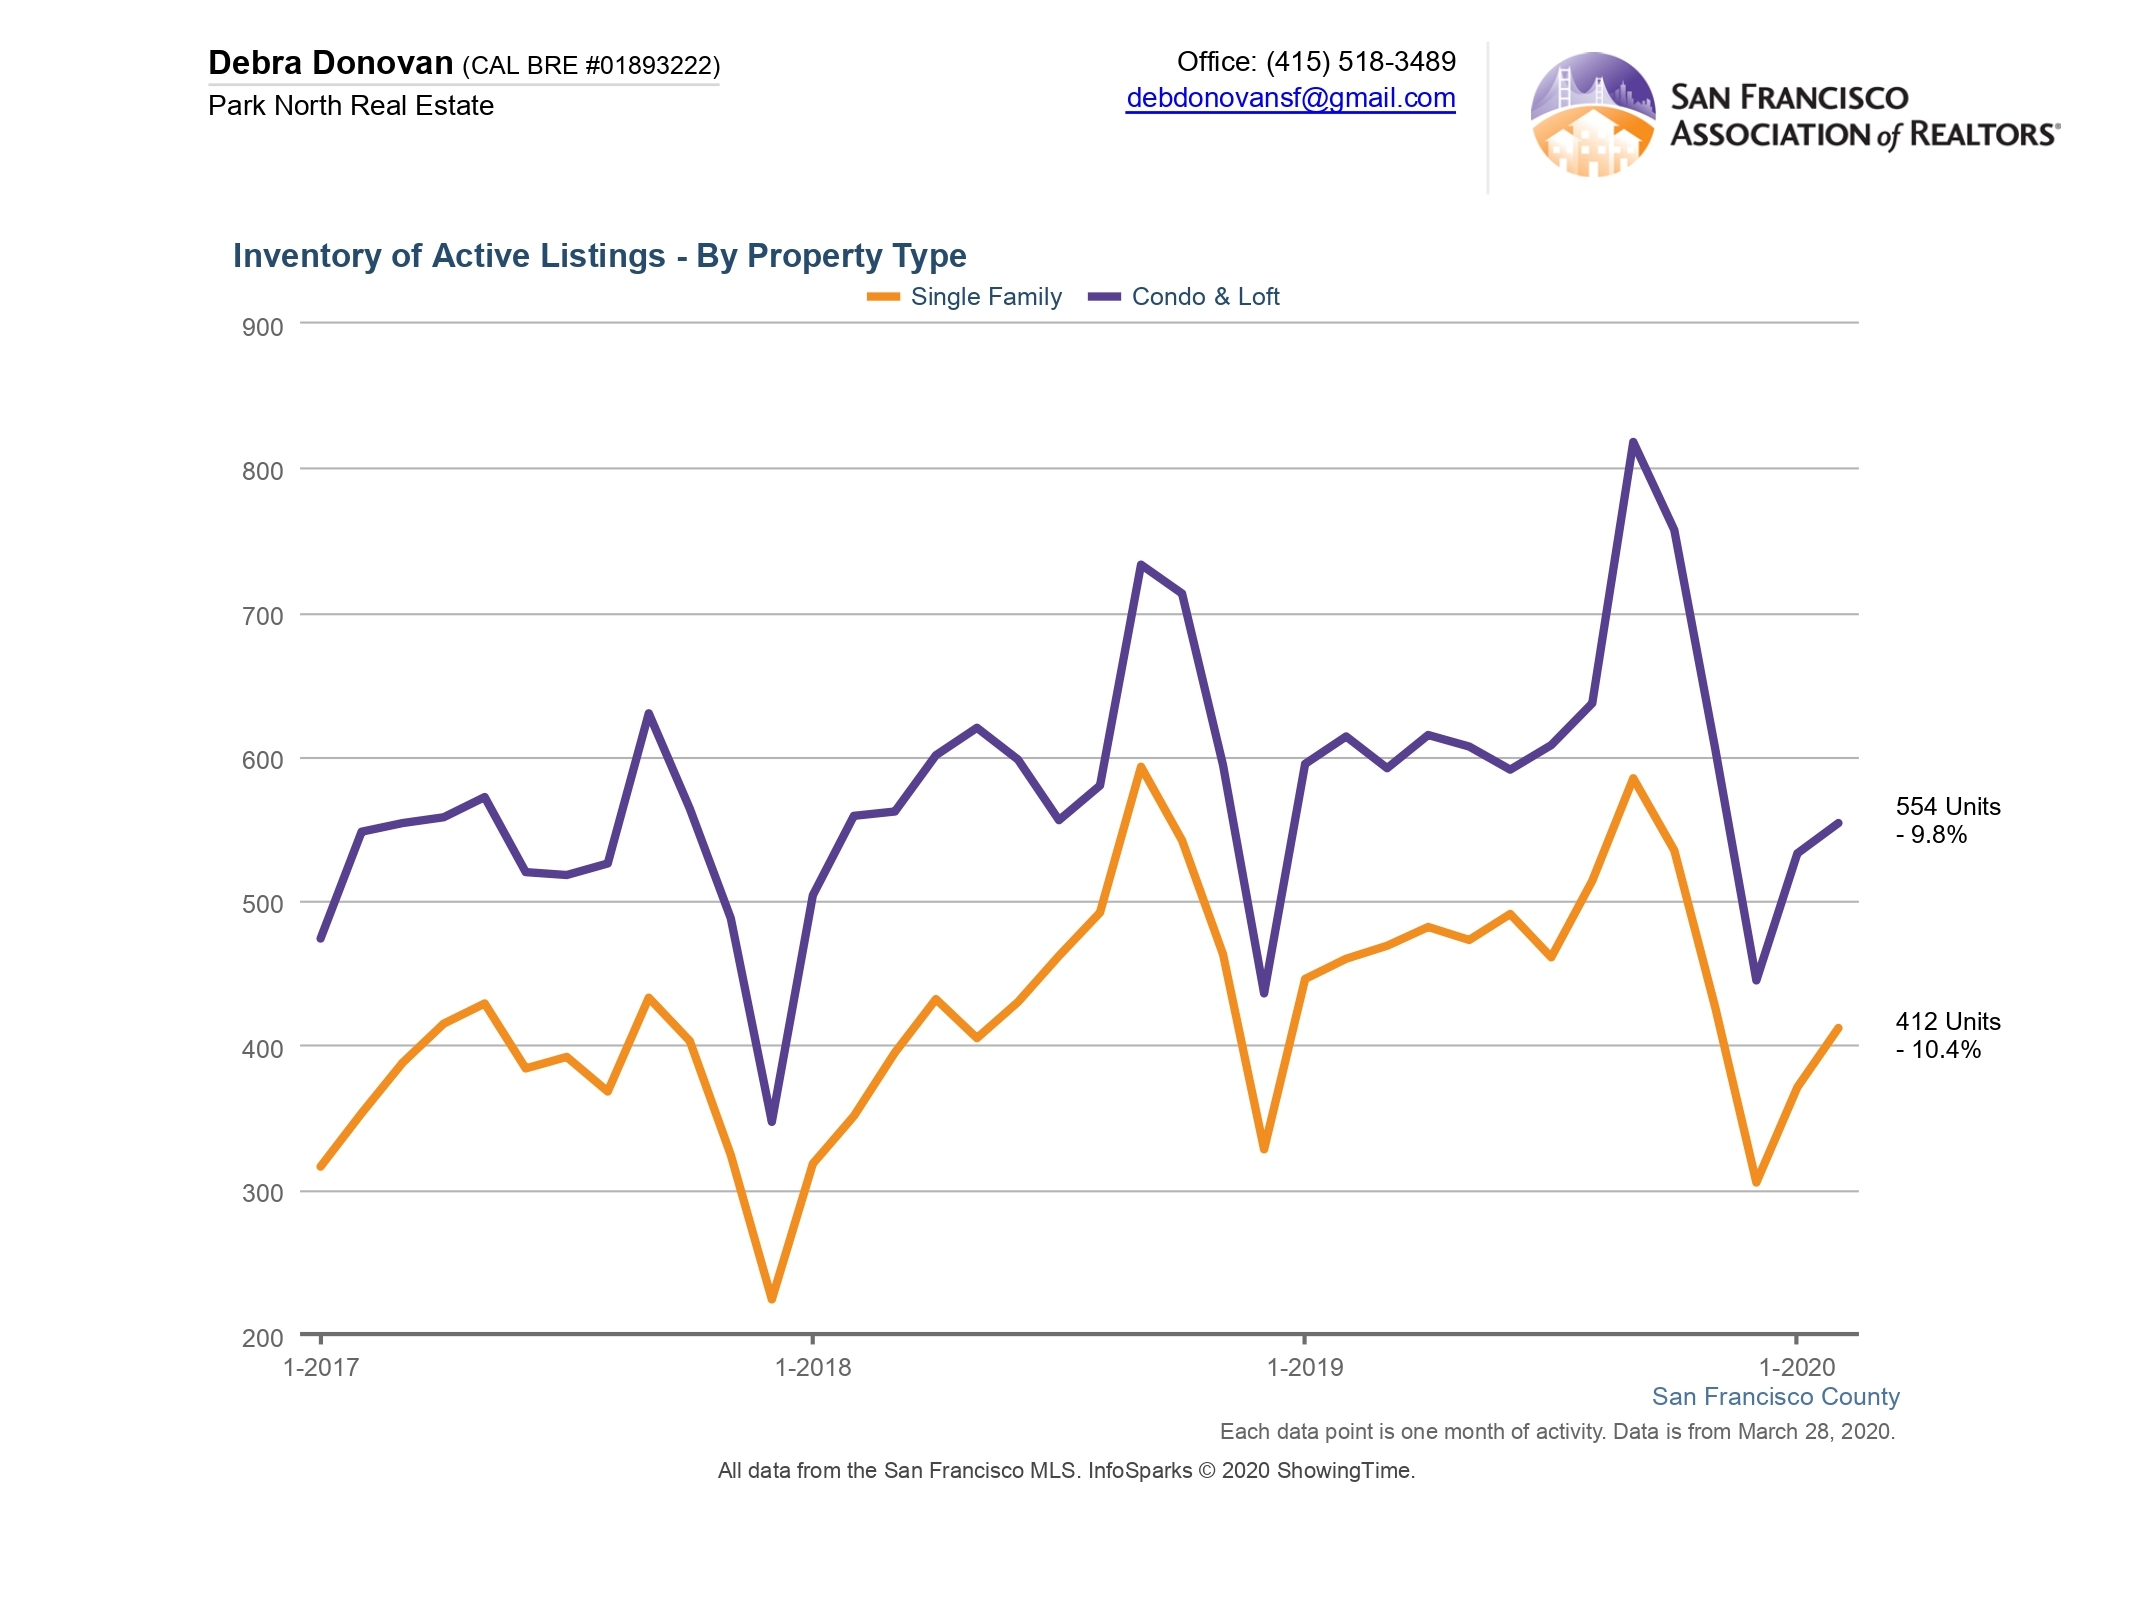
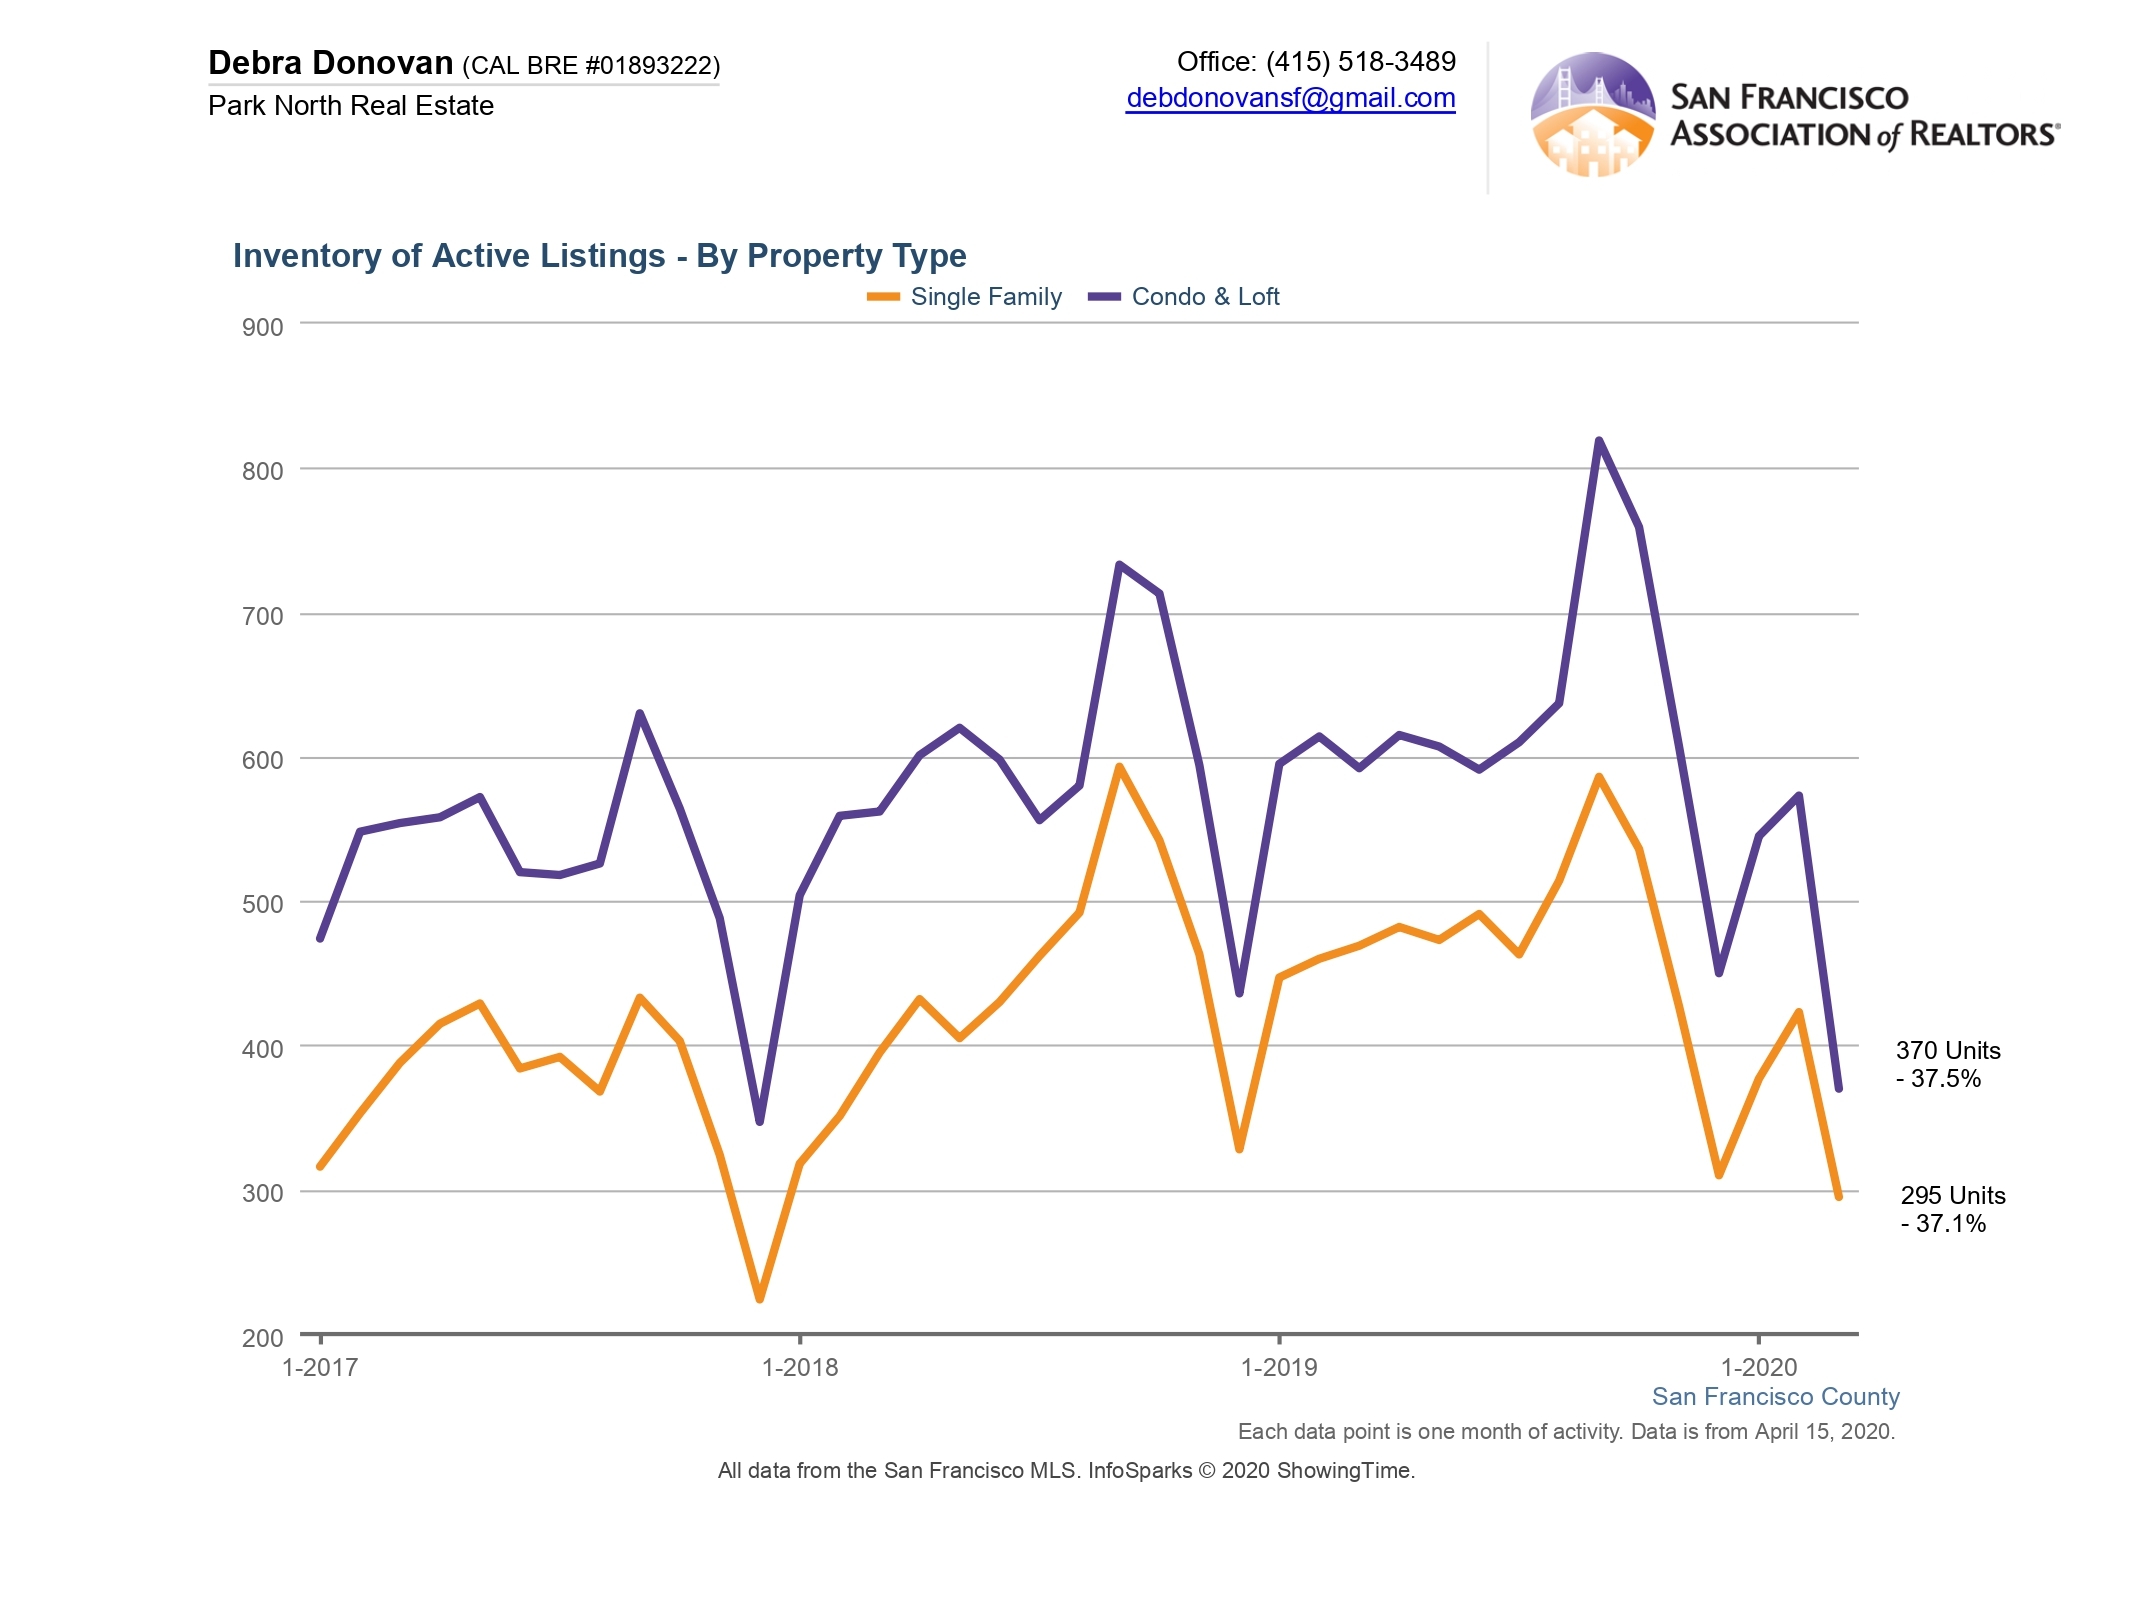
Active Listings:
This is the number of properties still available for sale at the end of the month. Again, we are seeing the “Corona effect” here as many homes were quickly pulled off the market just after the order. Active listings for single family homes were down 37%, while active condo and loft listings were down almost 38%.
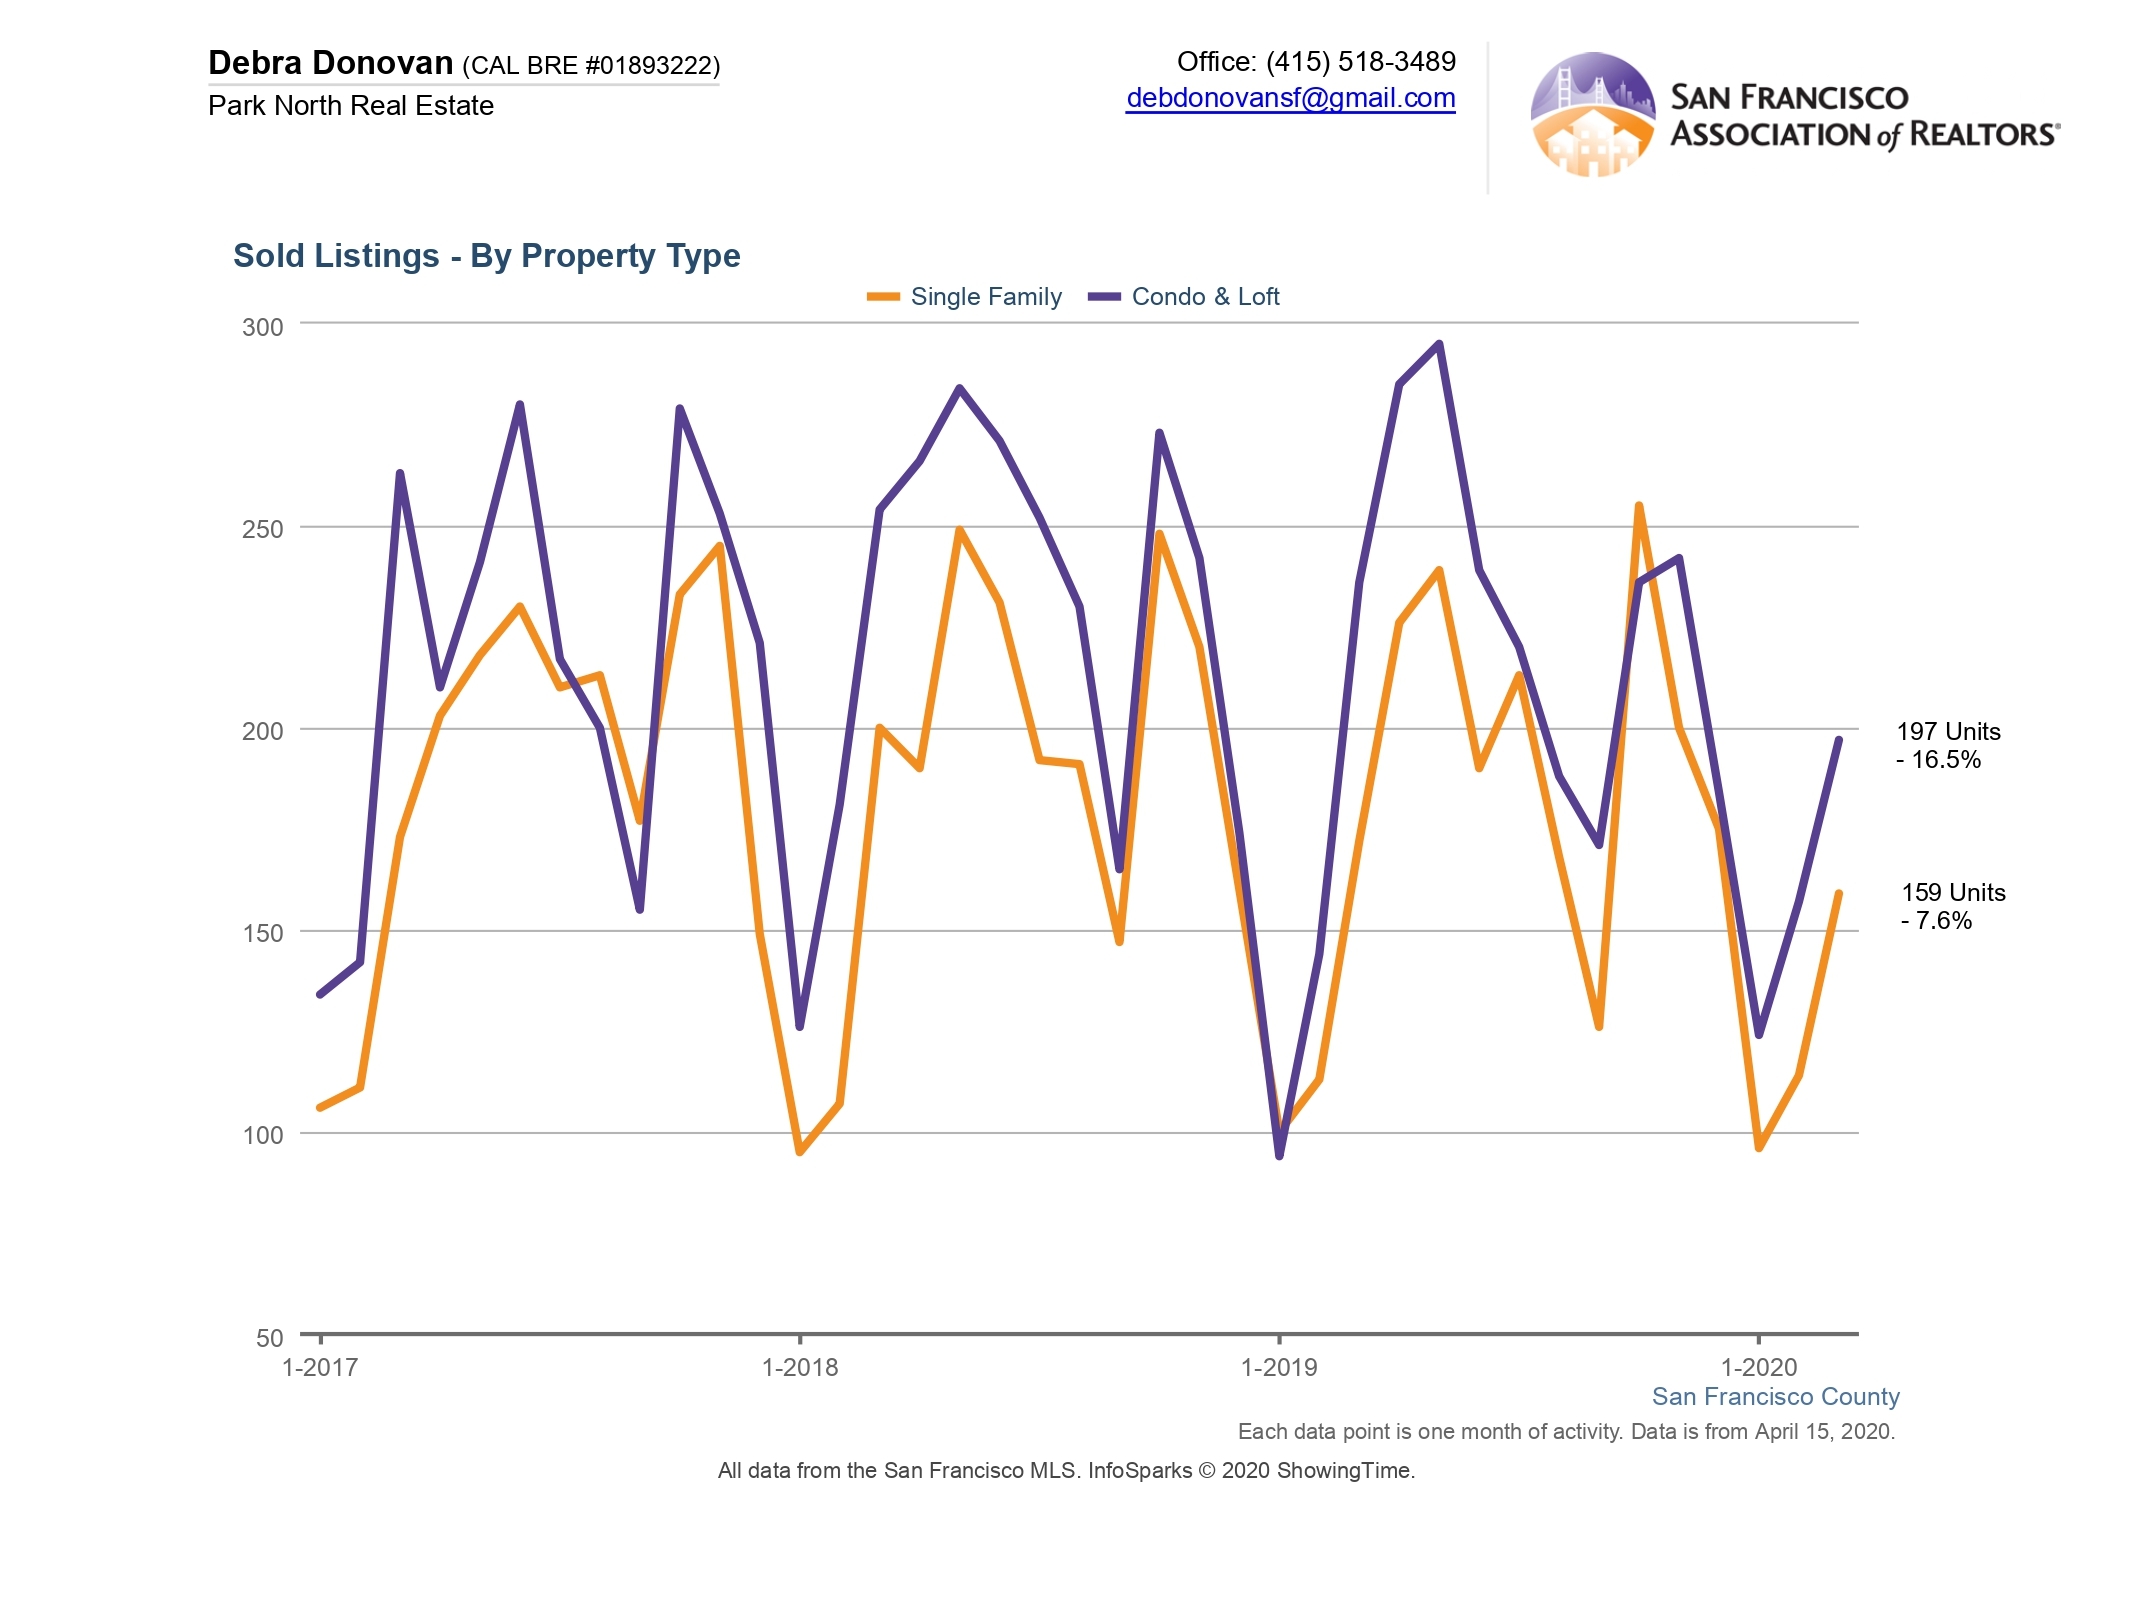
Sold Listings:
In March 159 single family homes were sold, down 7.6% compared to the same month last year. Condo and lofts sales were down 16.5% with 197 units selling. Both saw an increased number of sales compared to February (114 and 157 respectively). Given the time lag/ escrow period between a home going into contract and closing, sold listings were likely already in escrow when the shelter order came down. Some buyers cancelled their escrow/ sale due to the uncertainty of the markets.
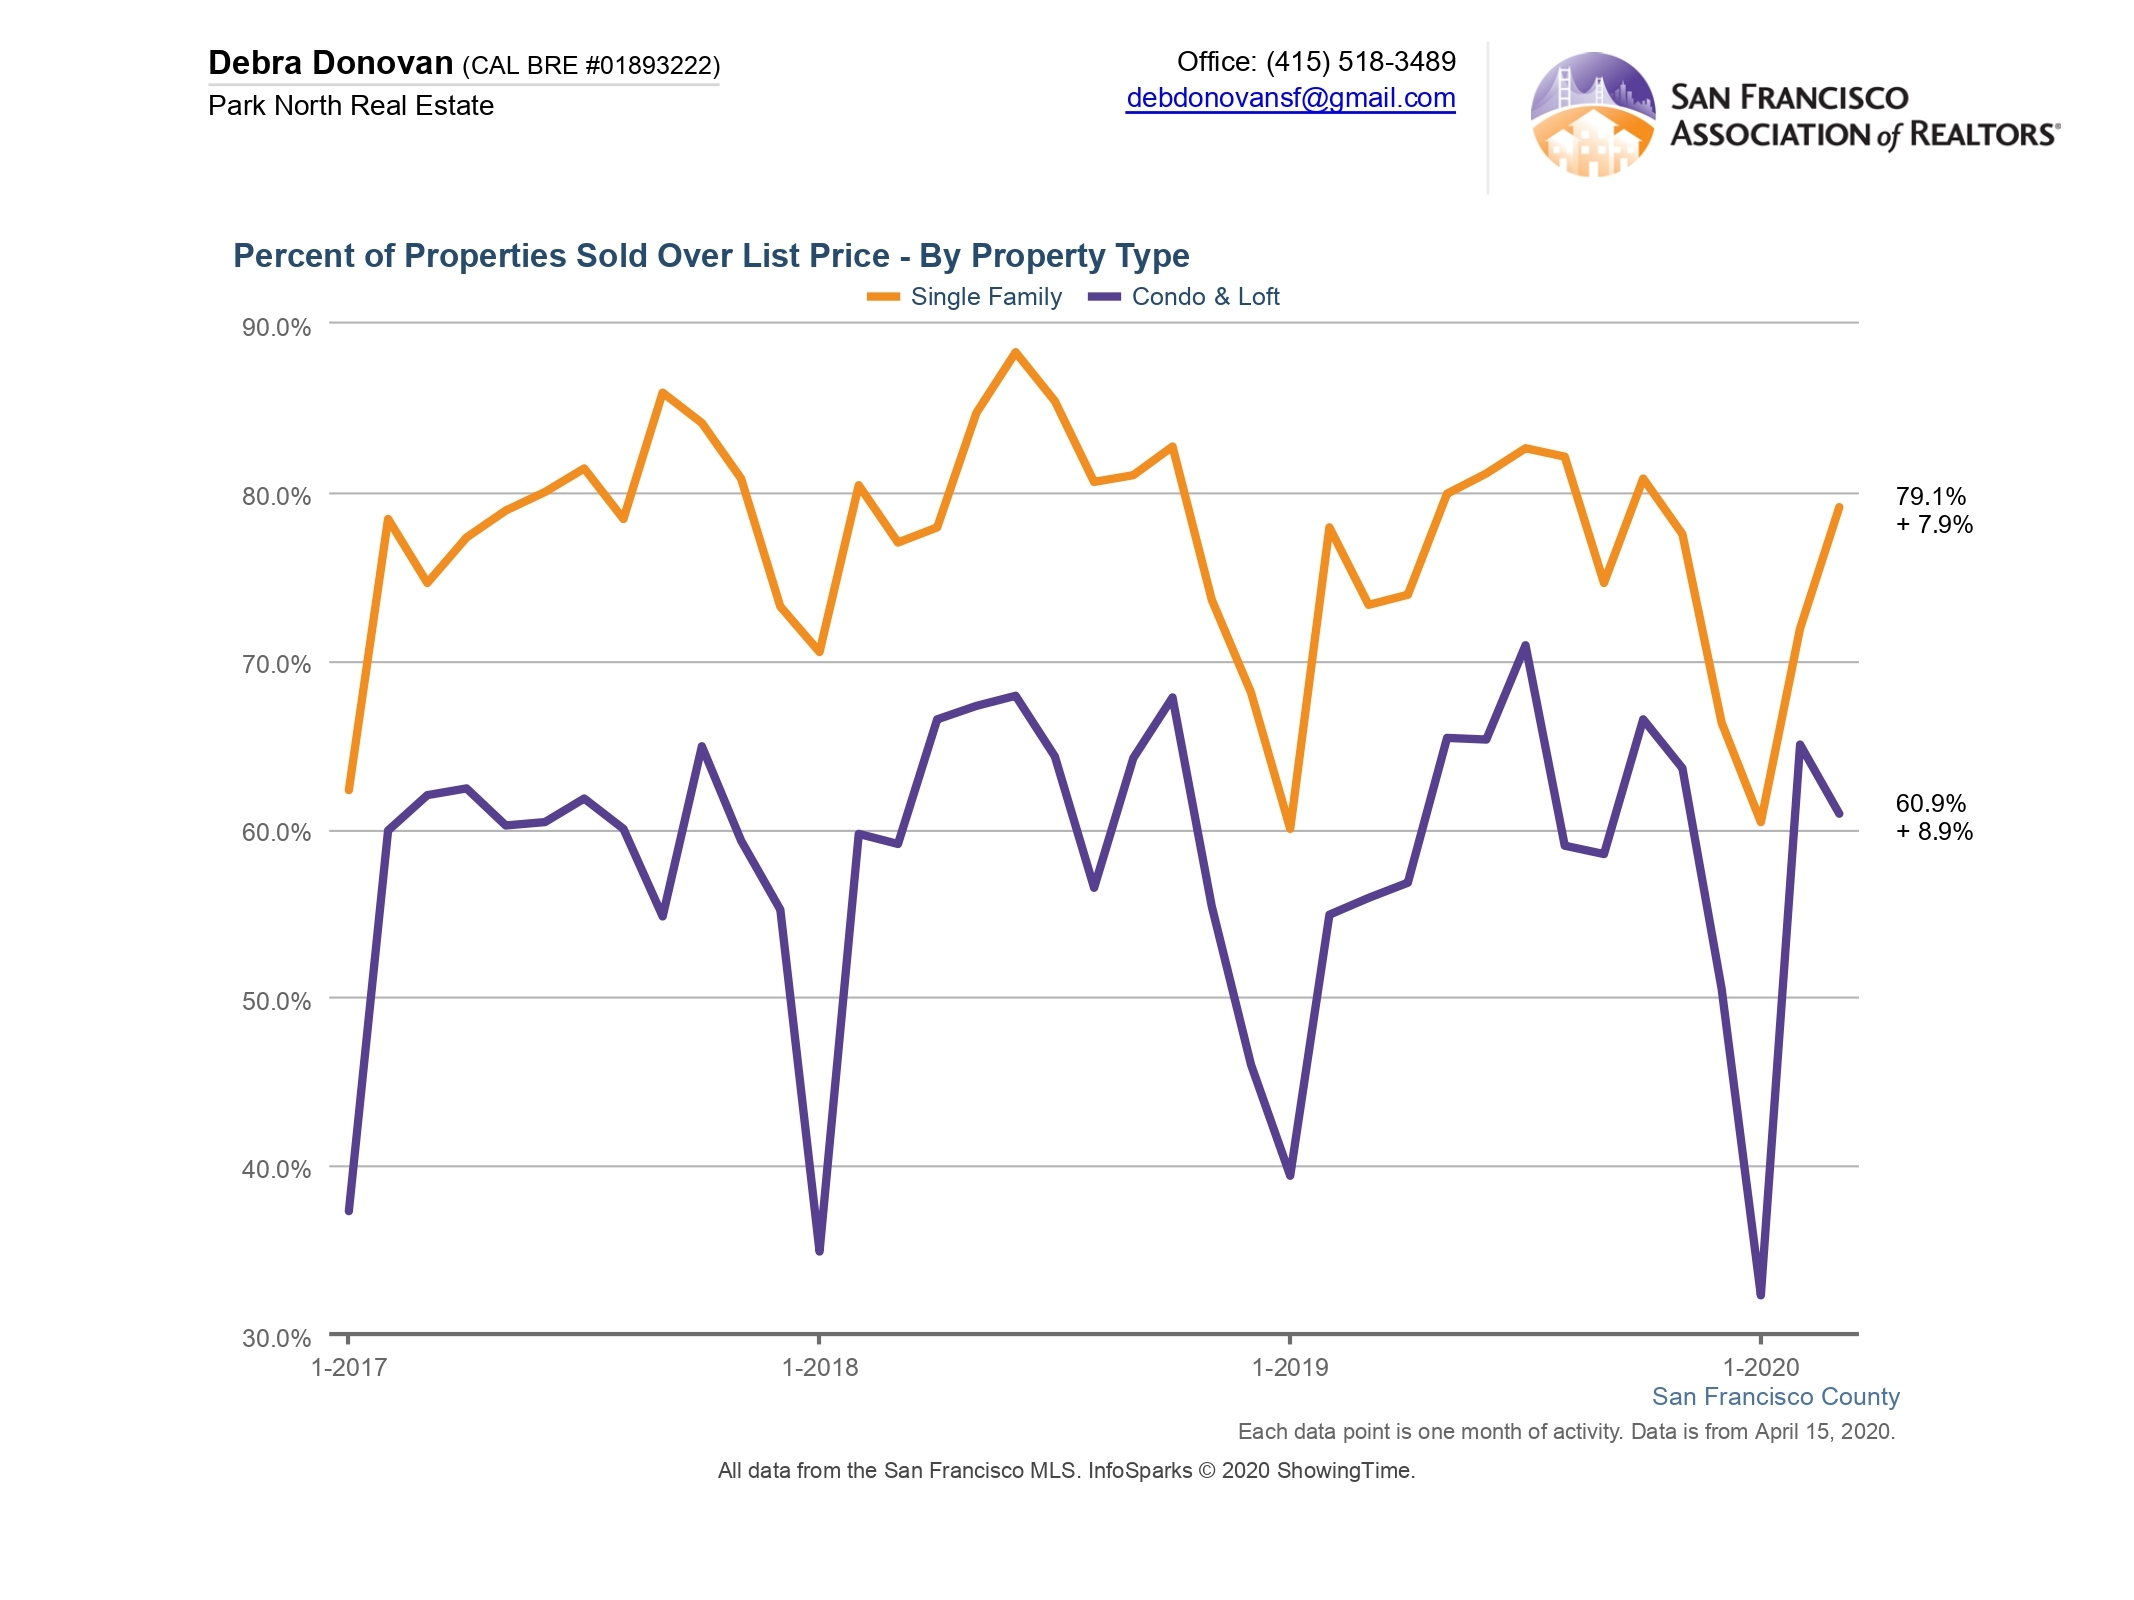
Percentage of Properties Sold Over List Price:
More properties than not continue to sell over their list price. Almost 80% of single family homes sold for over list price, up 7.9% compared to the same month last year, and up compared to last month. Almost 61% of condos and lofts sold for over their list price. This is up about 9% compared to the same month last year, but down compared to last month’s 65%.
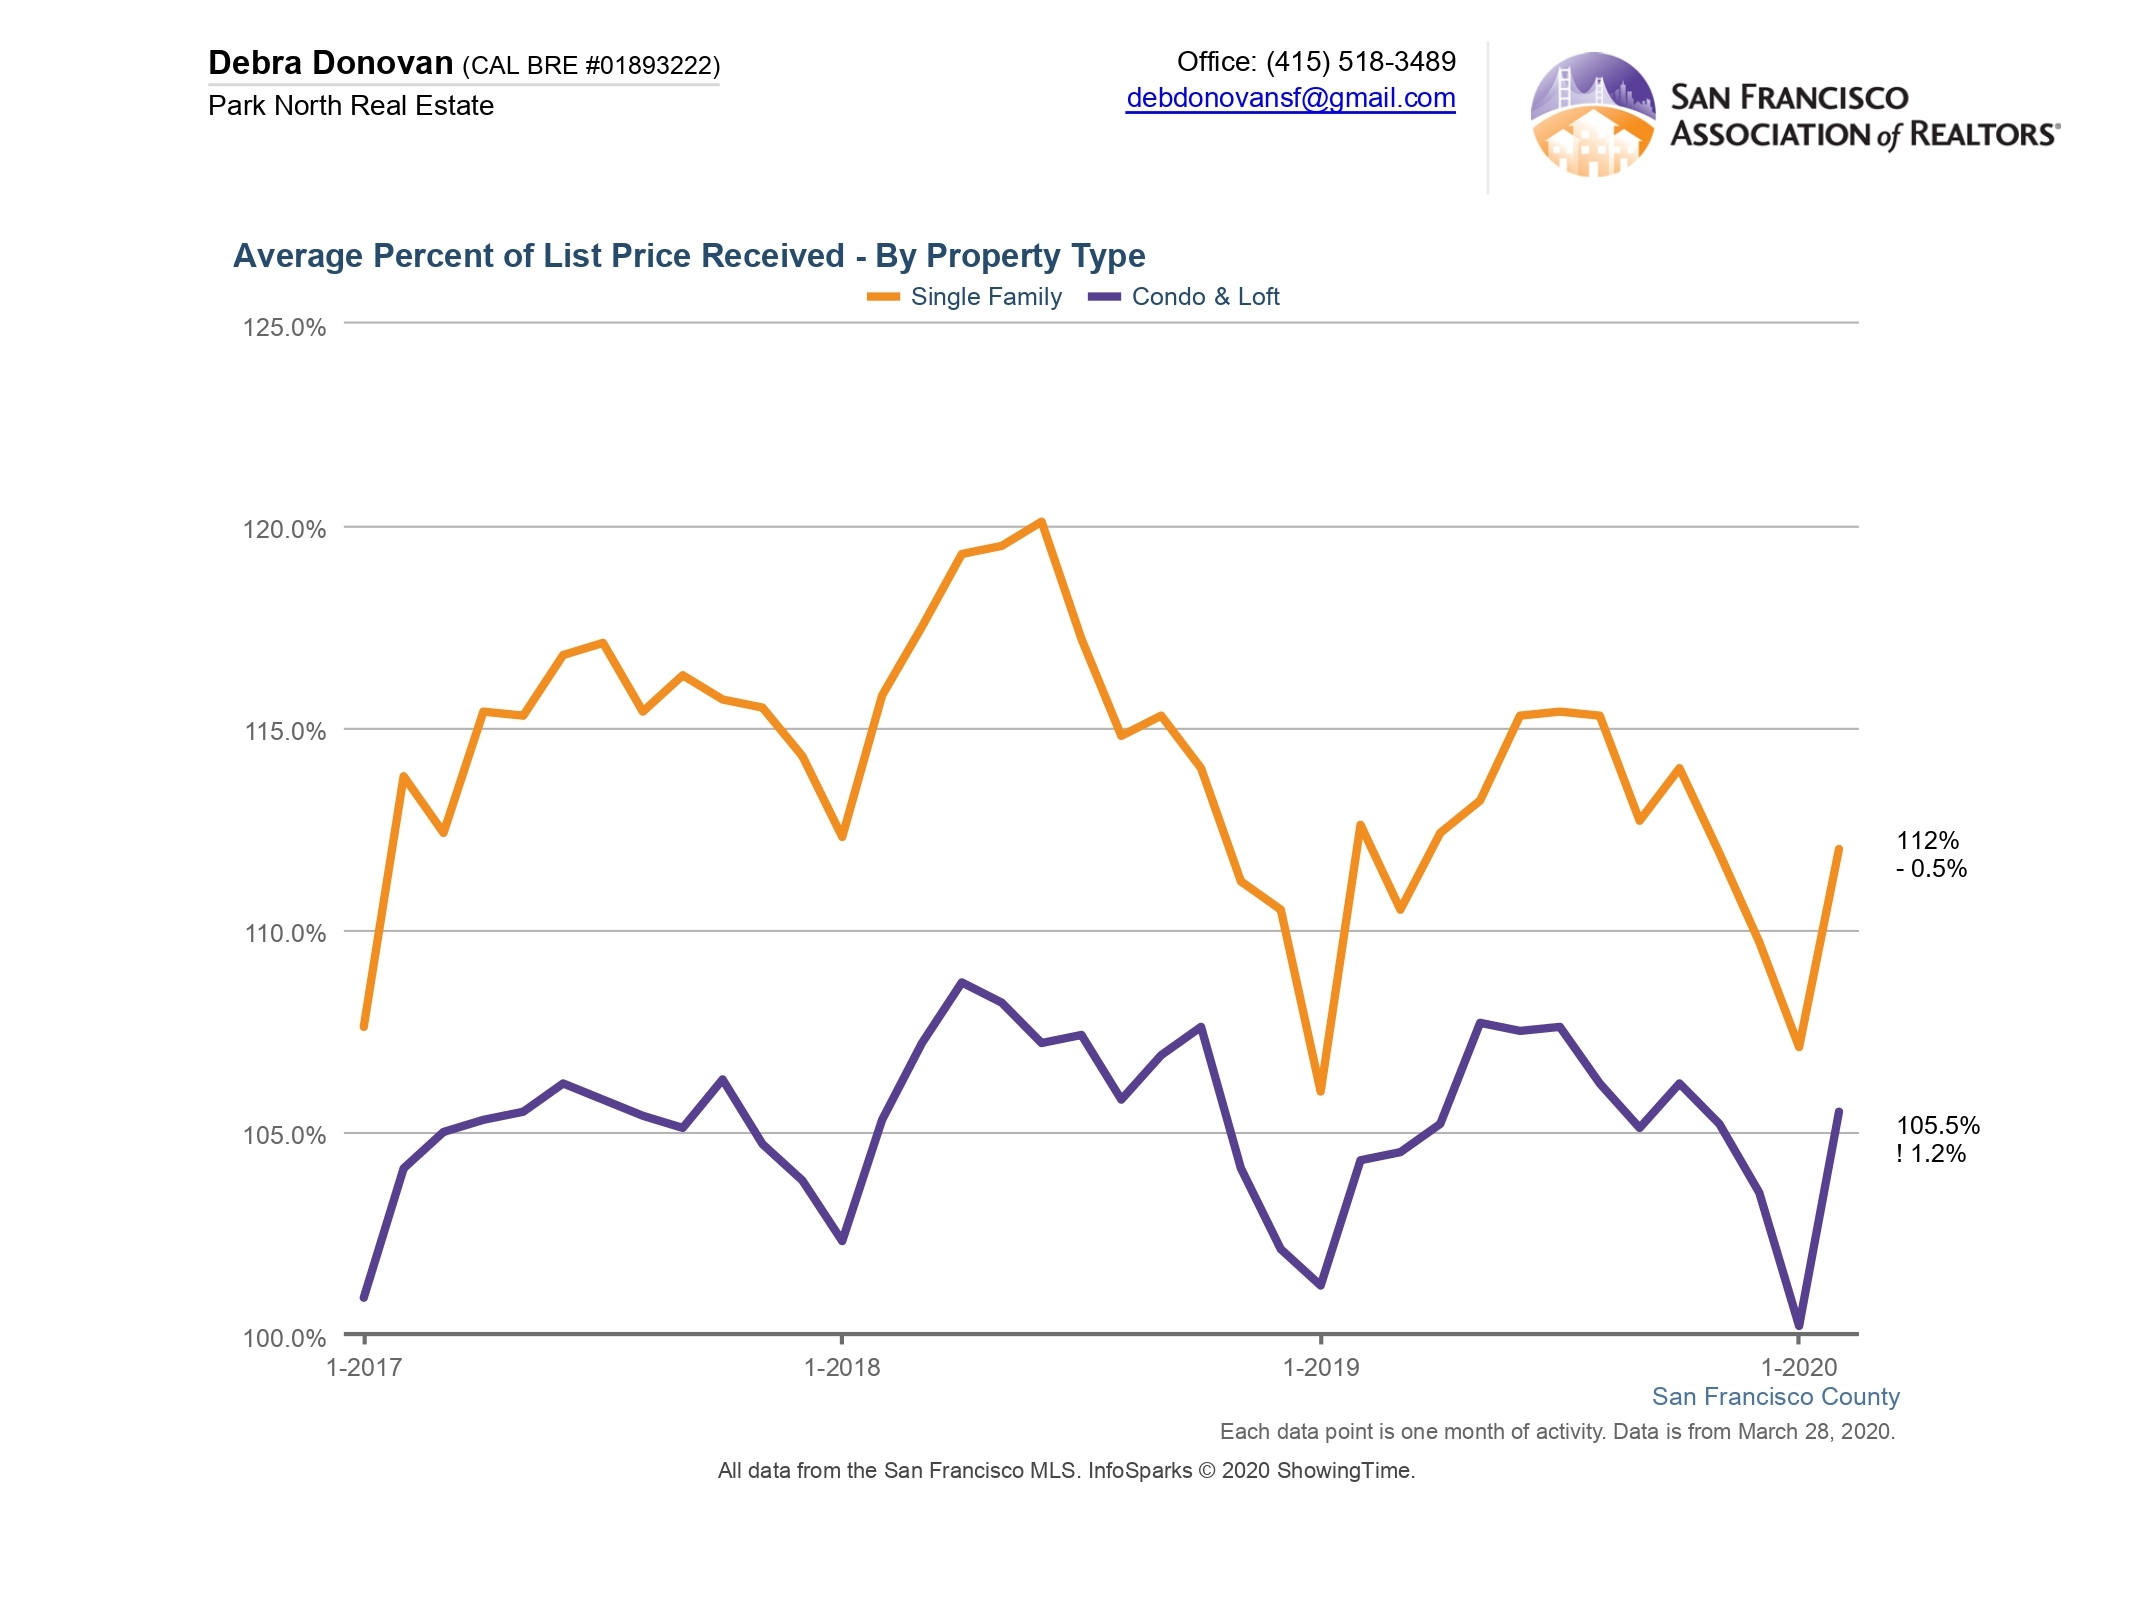
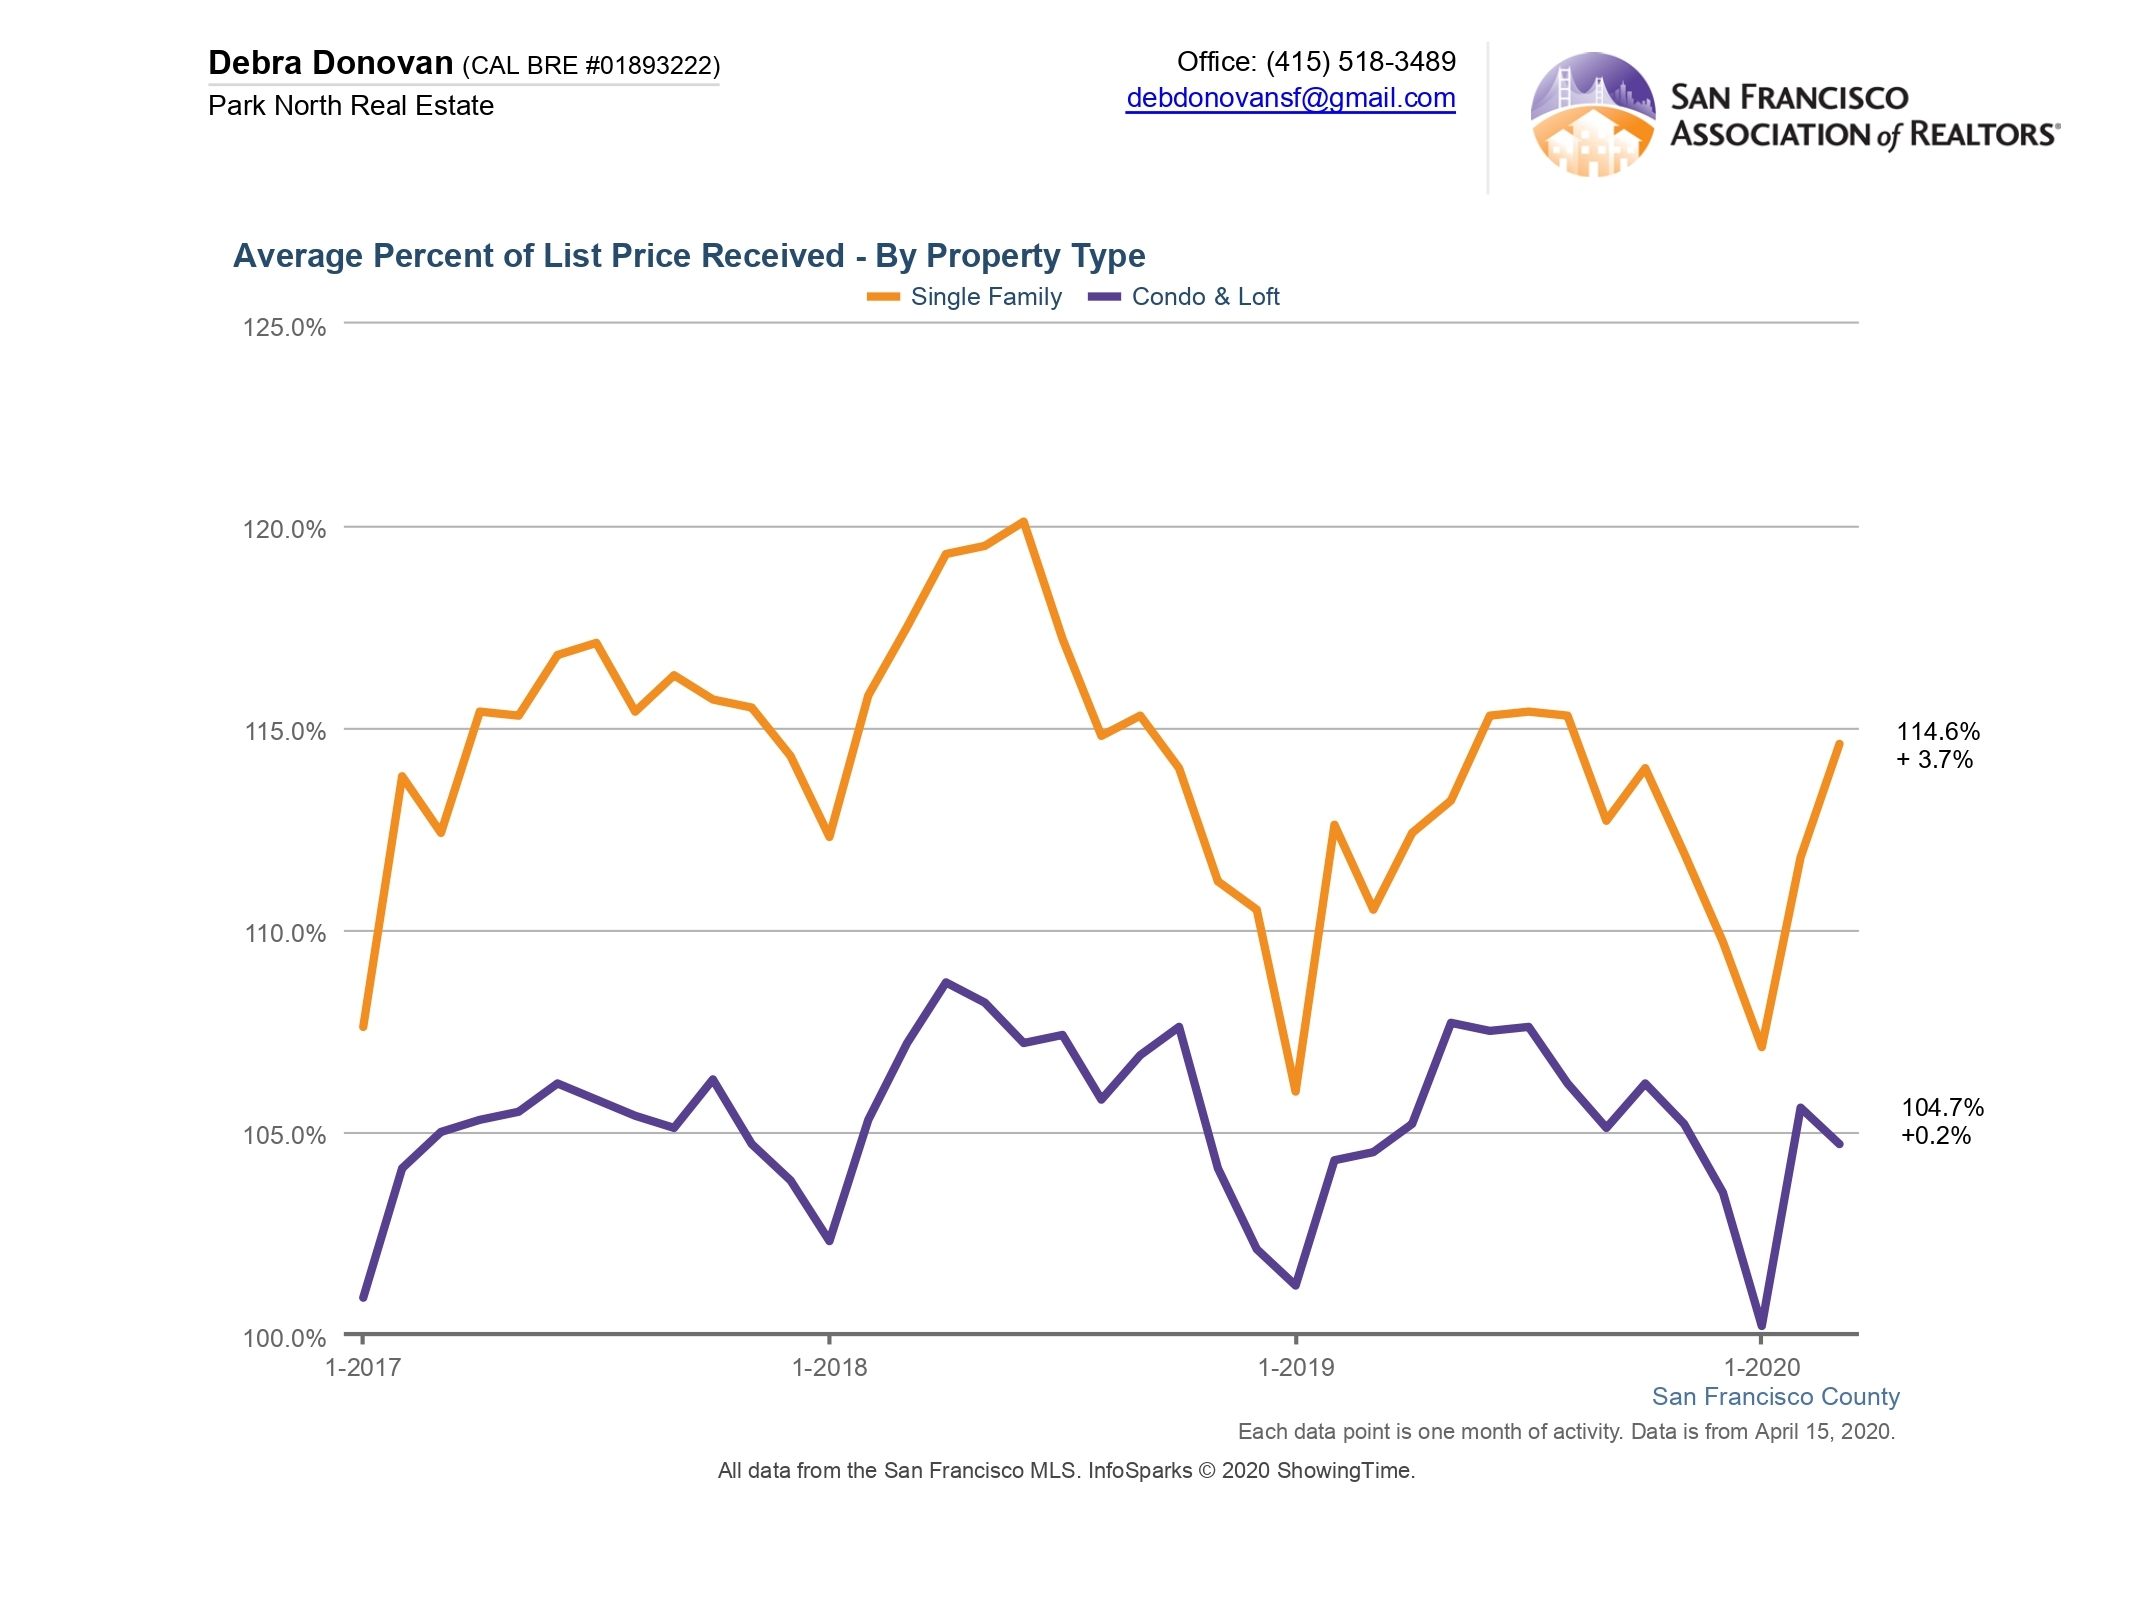
Average Percentage of List Price Received:
Single family homes received an average of almost 115% of their list price in March, up 3.7% compared to the same month last year and up from 112% in February 2020. Condos and lofts received an average of about 105%, up just 0.2% compared to last year and down from 106% in February.
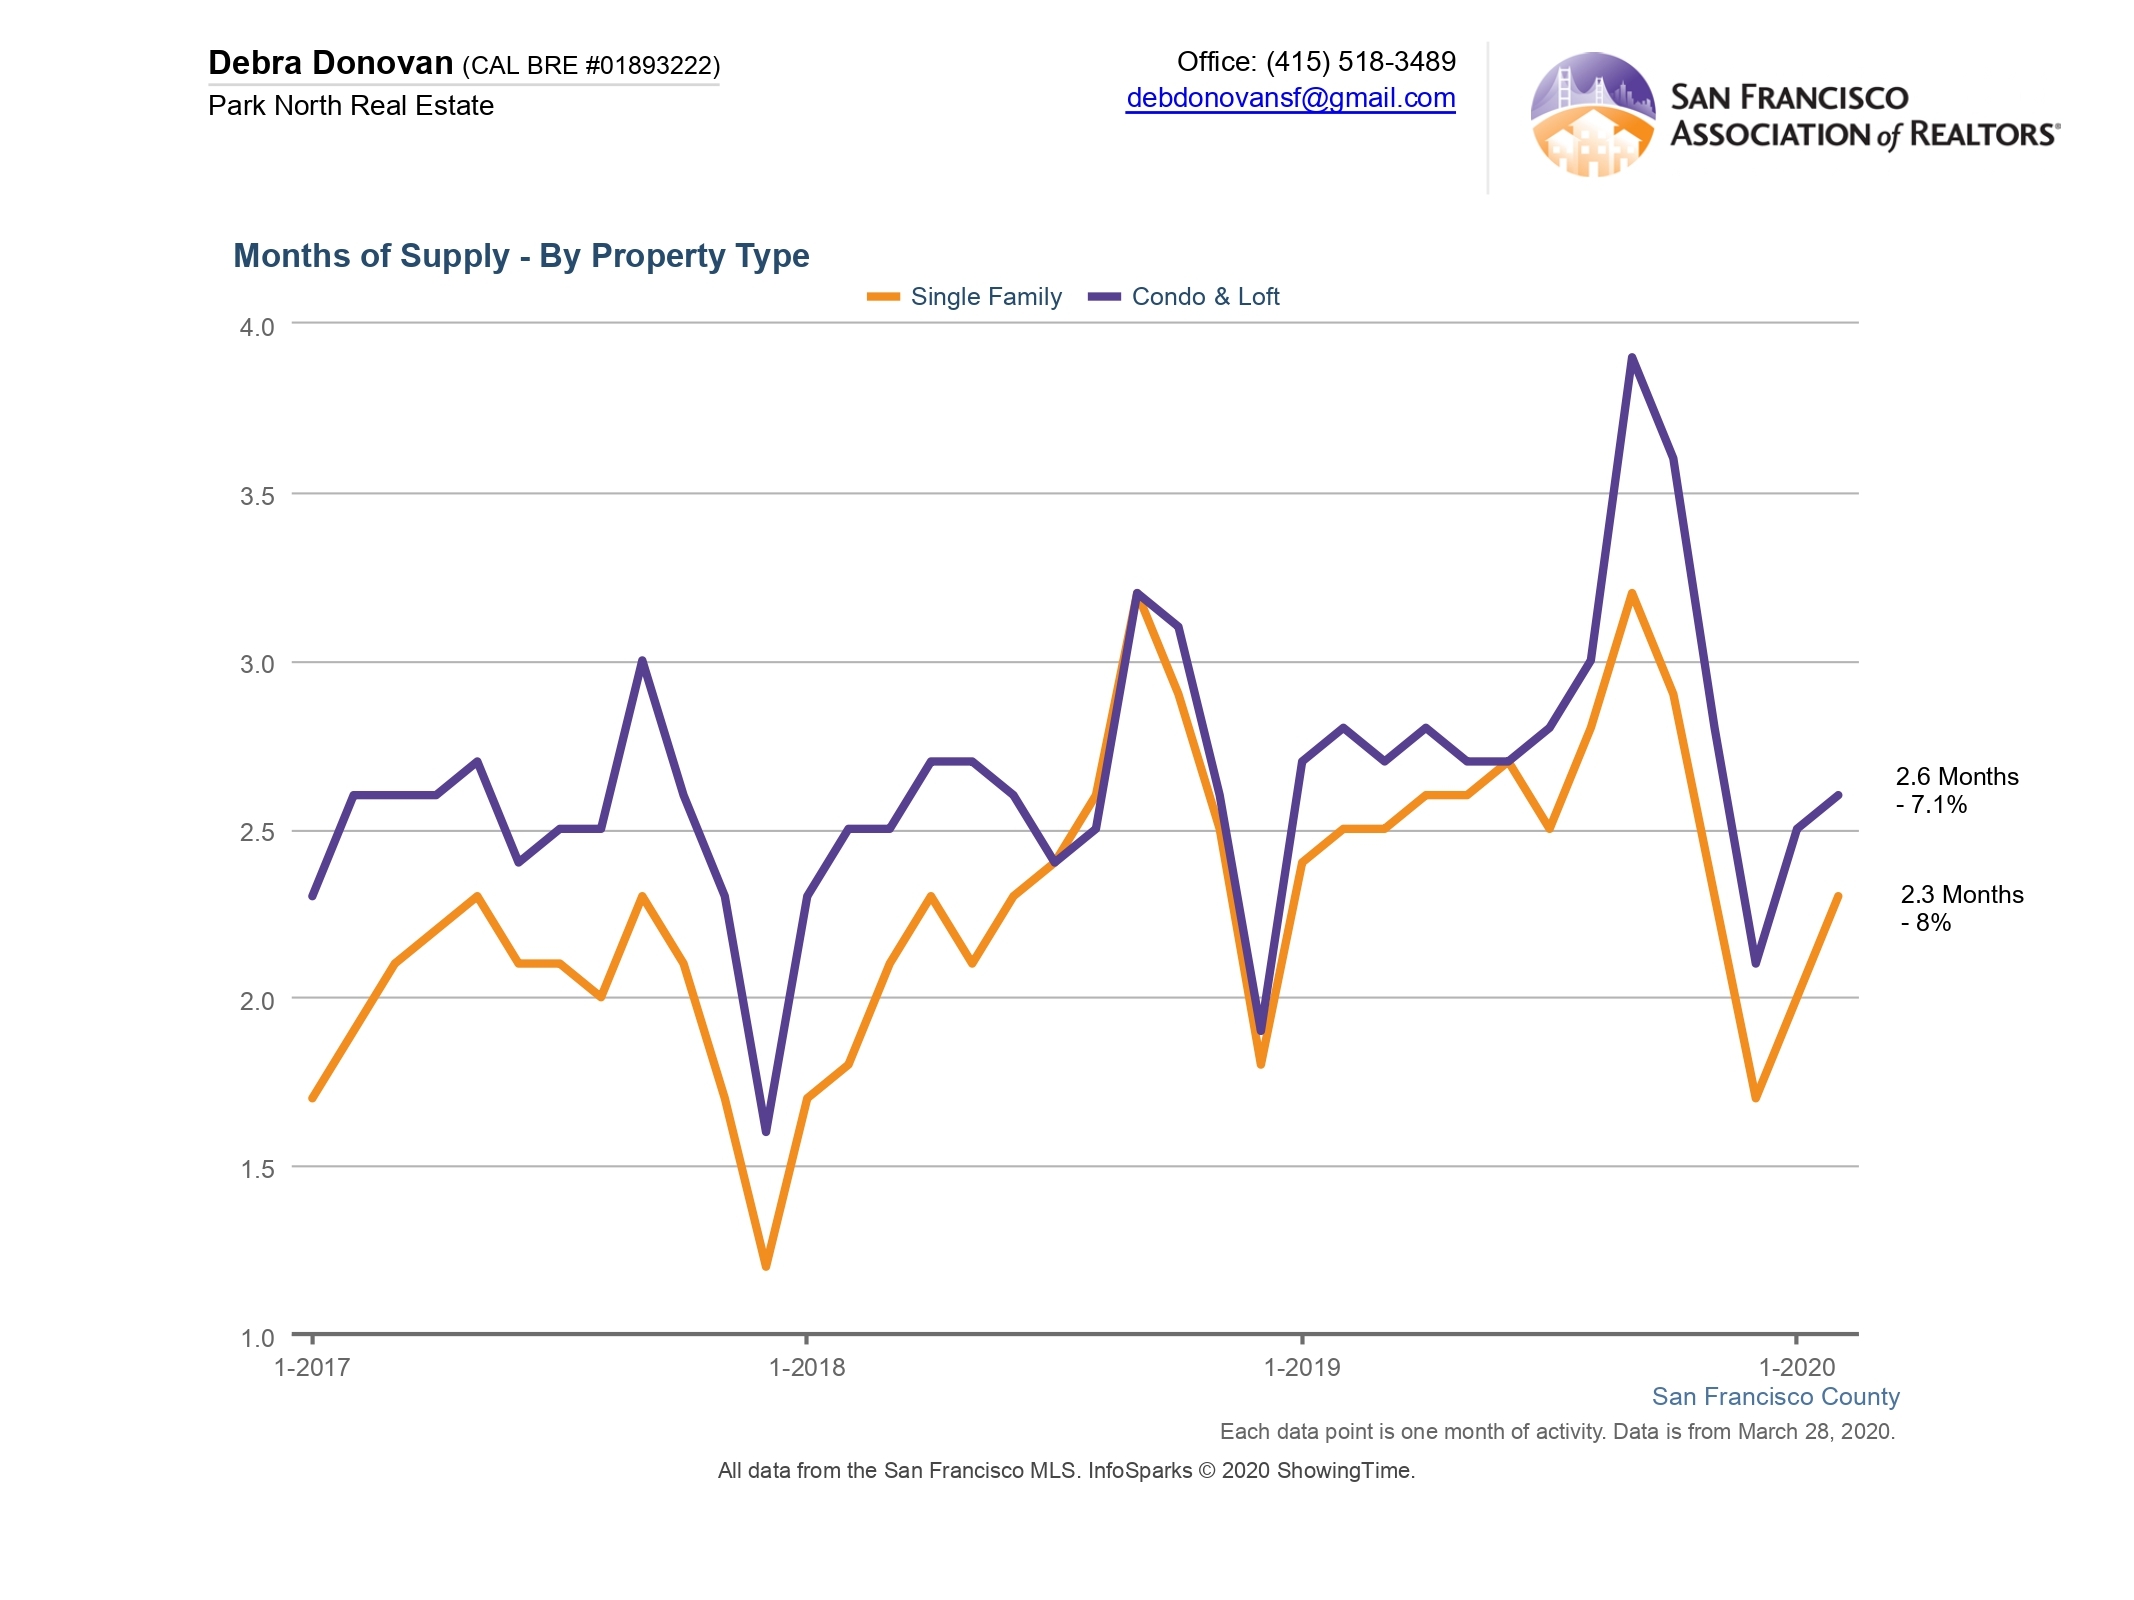
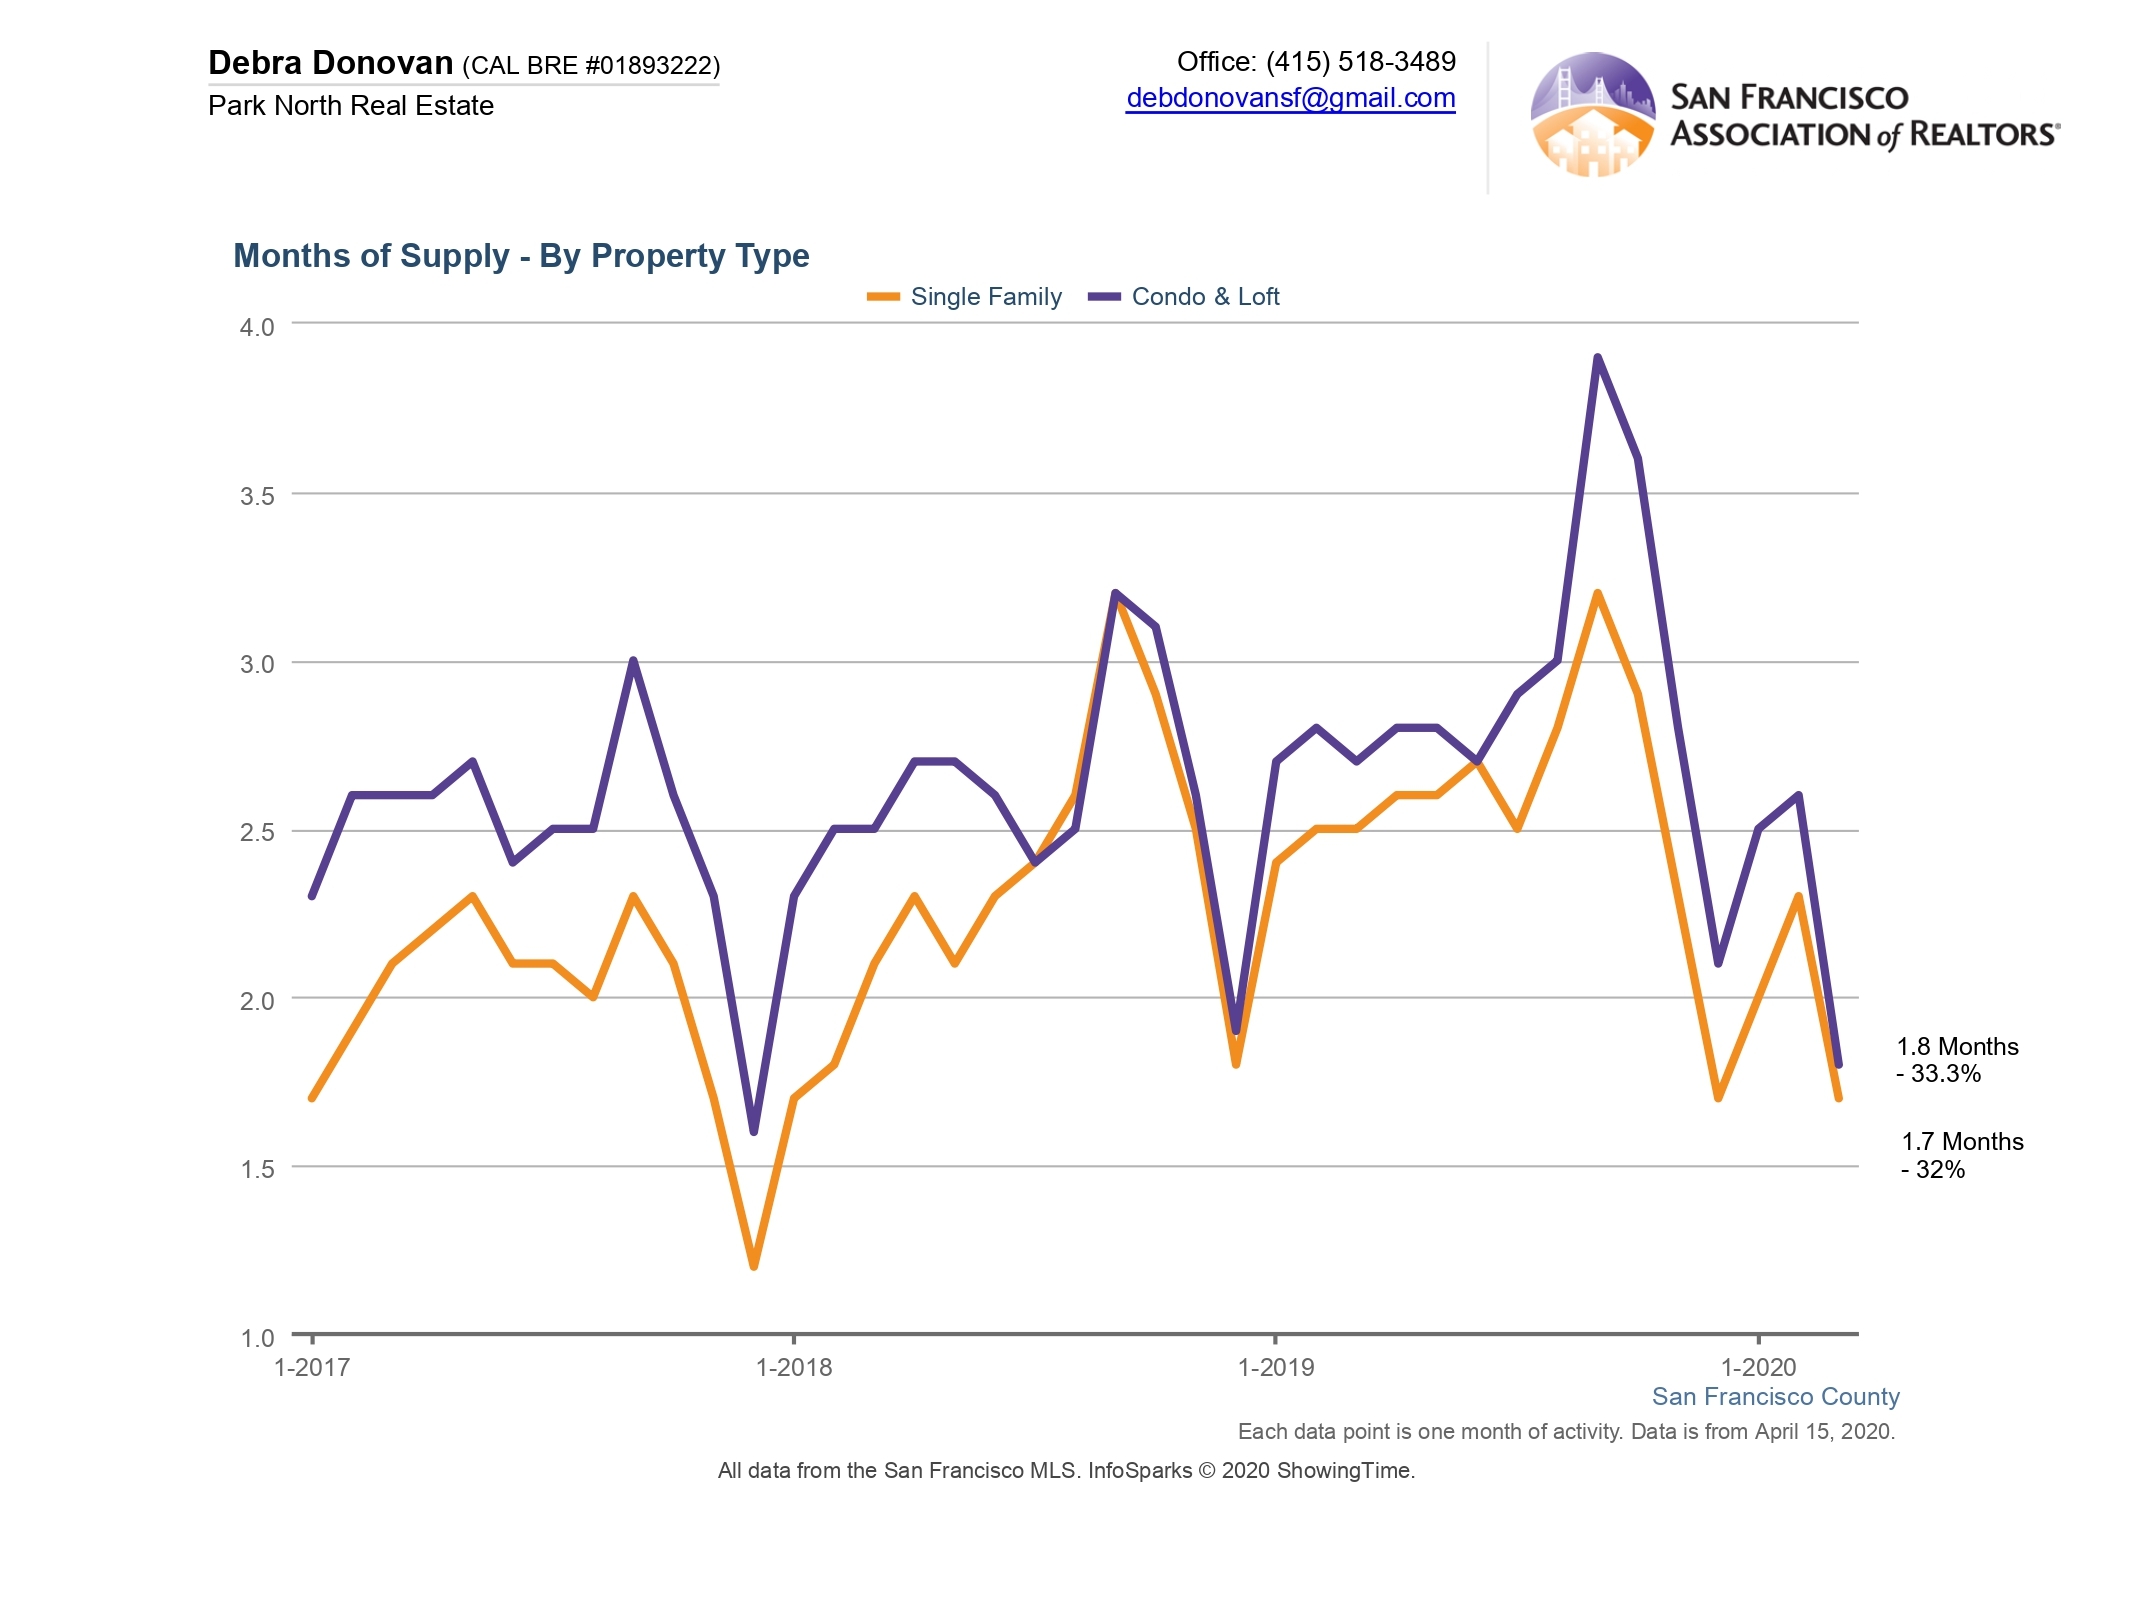
Months Supply of Inventory:
Again we see the shelter-in-place effect with MSI. By the end of March single family homes had only 1.7 months of inventory, down 32% compared to the same month last year and down from 2.3 months in February of this year. Condos and lofts had only 1.8 months of inventory, down 1/3 compared to the same month last year and down from 2.6 months of inventory in February 2020.
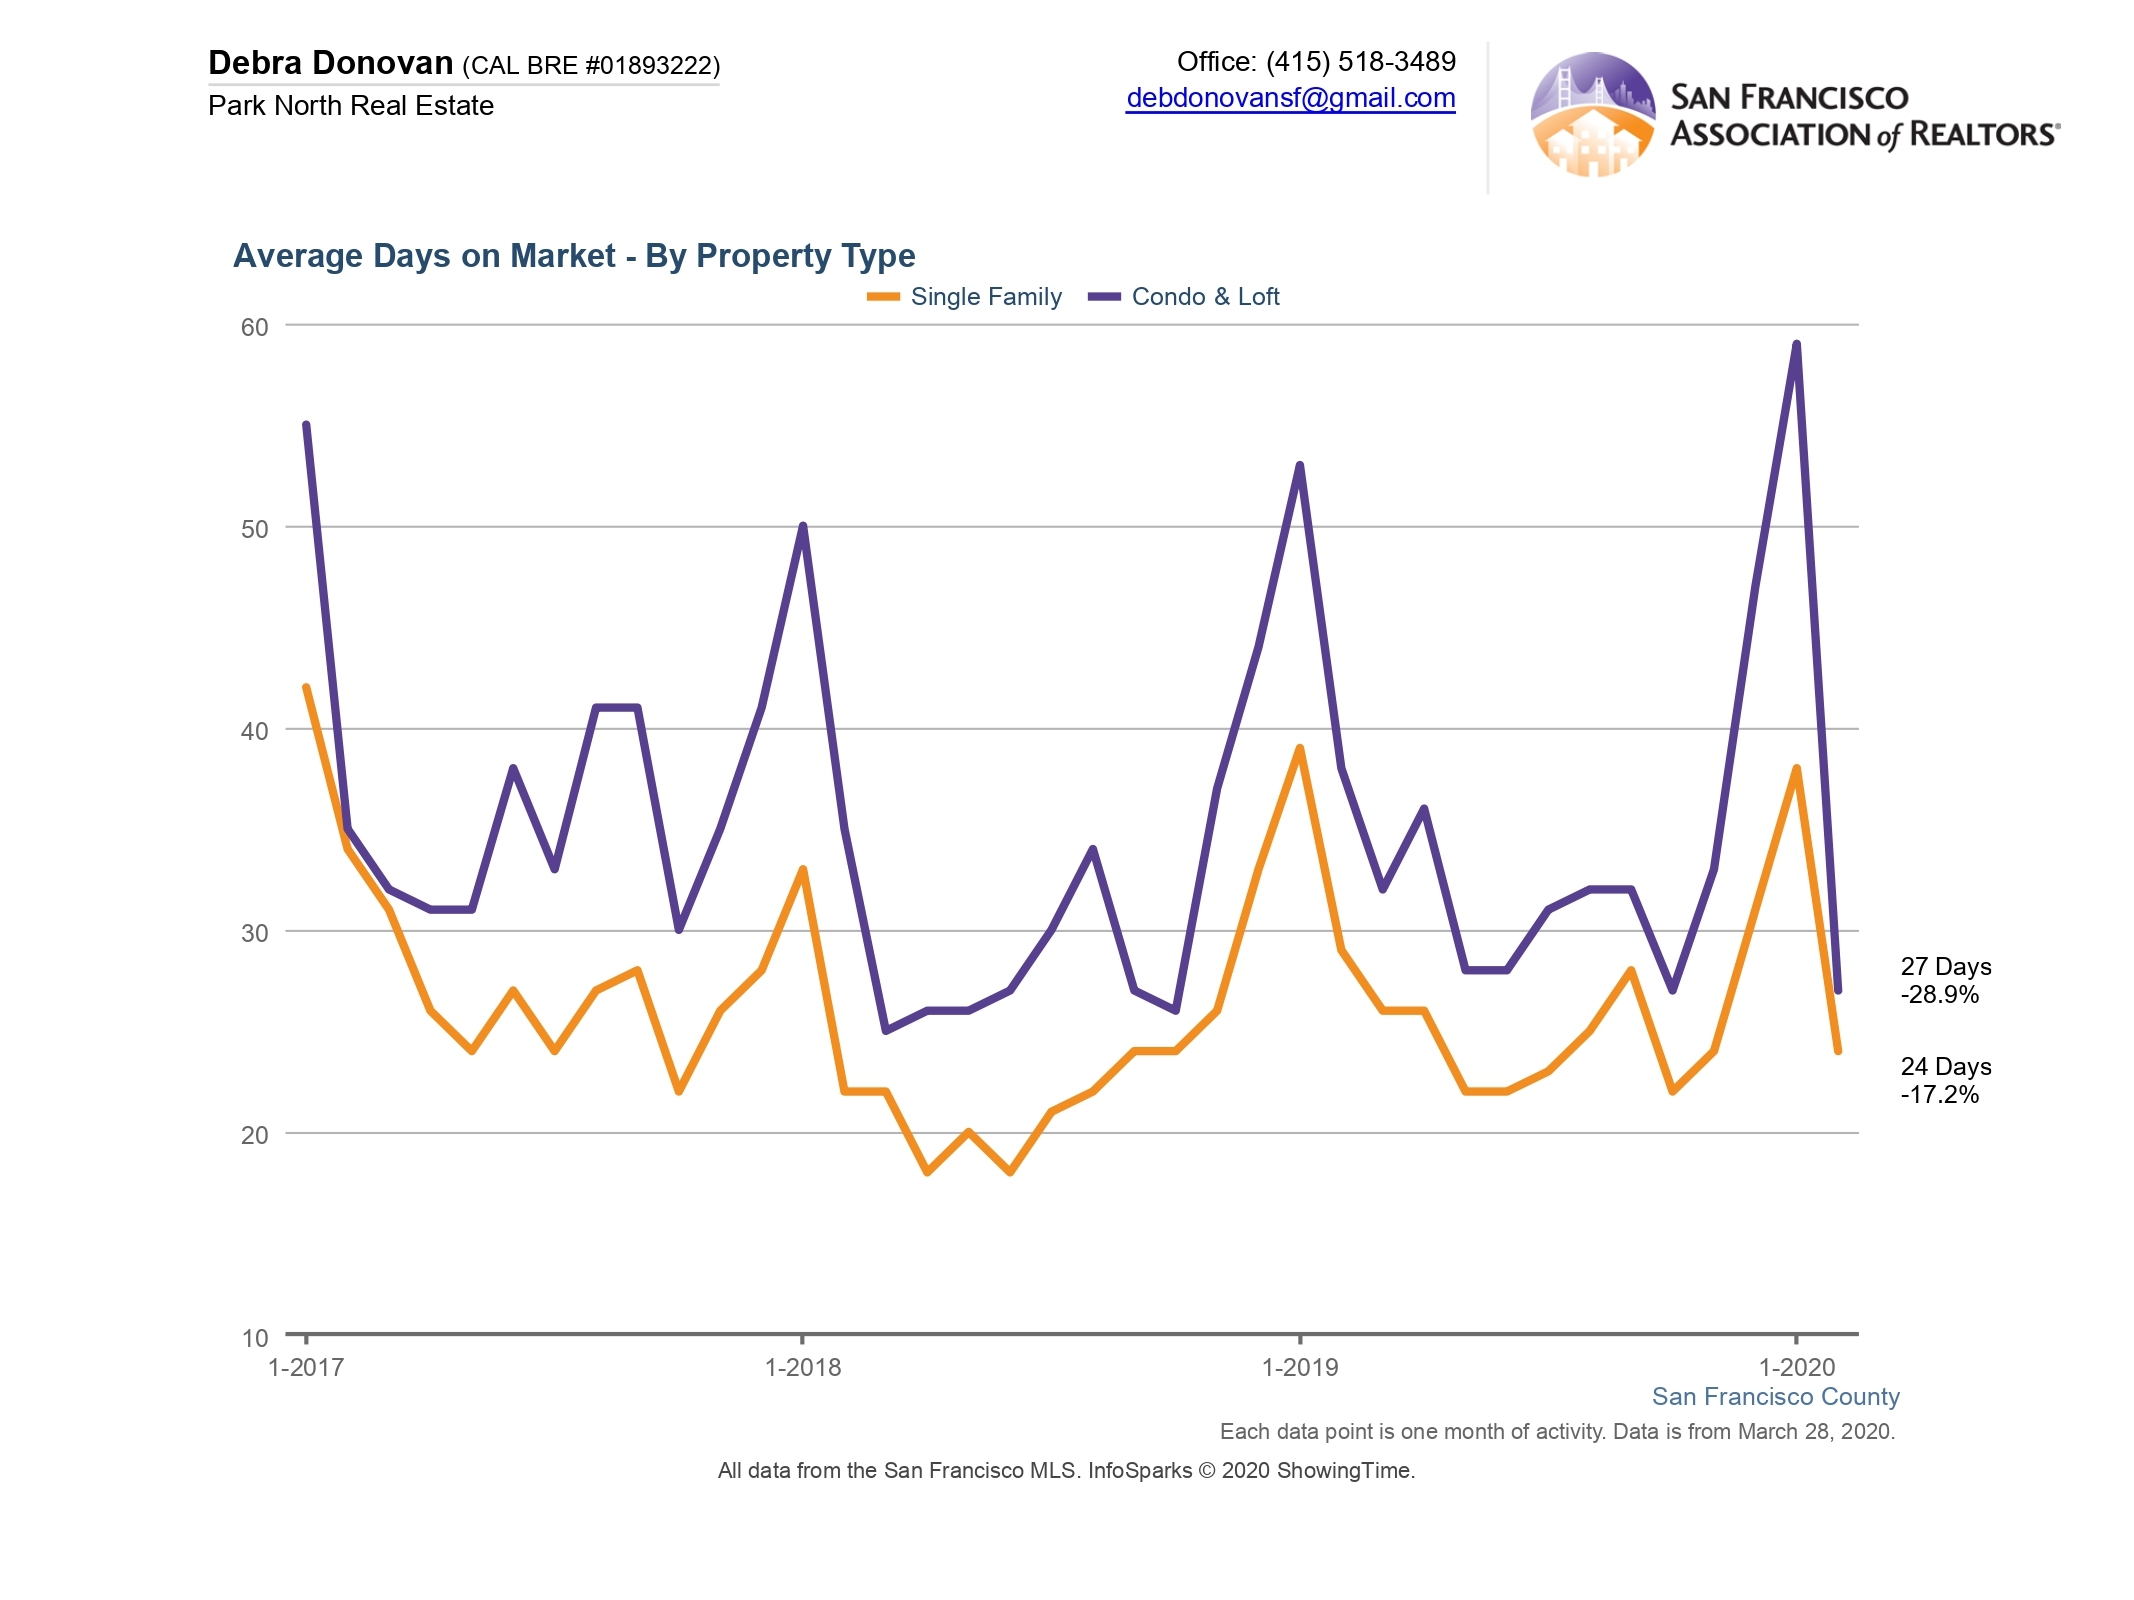
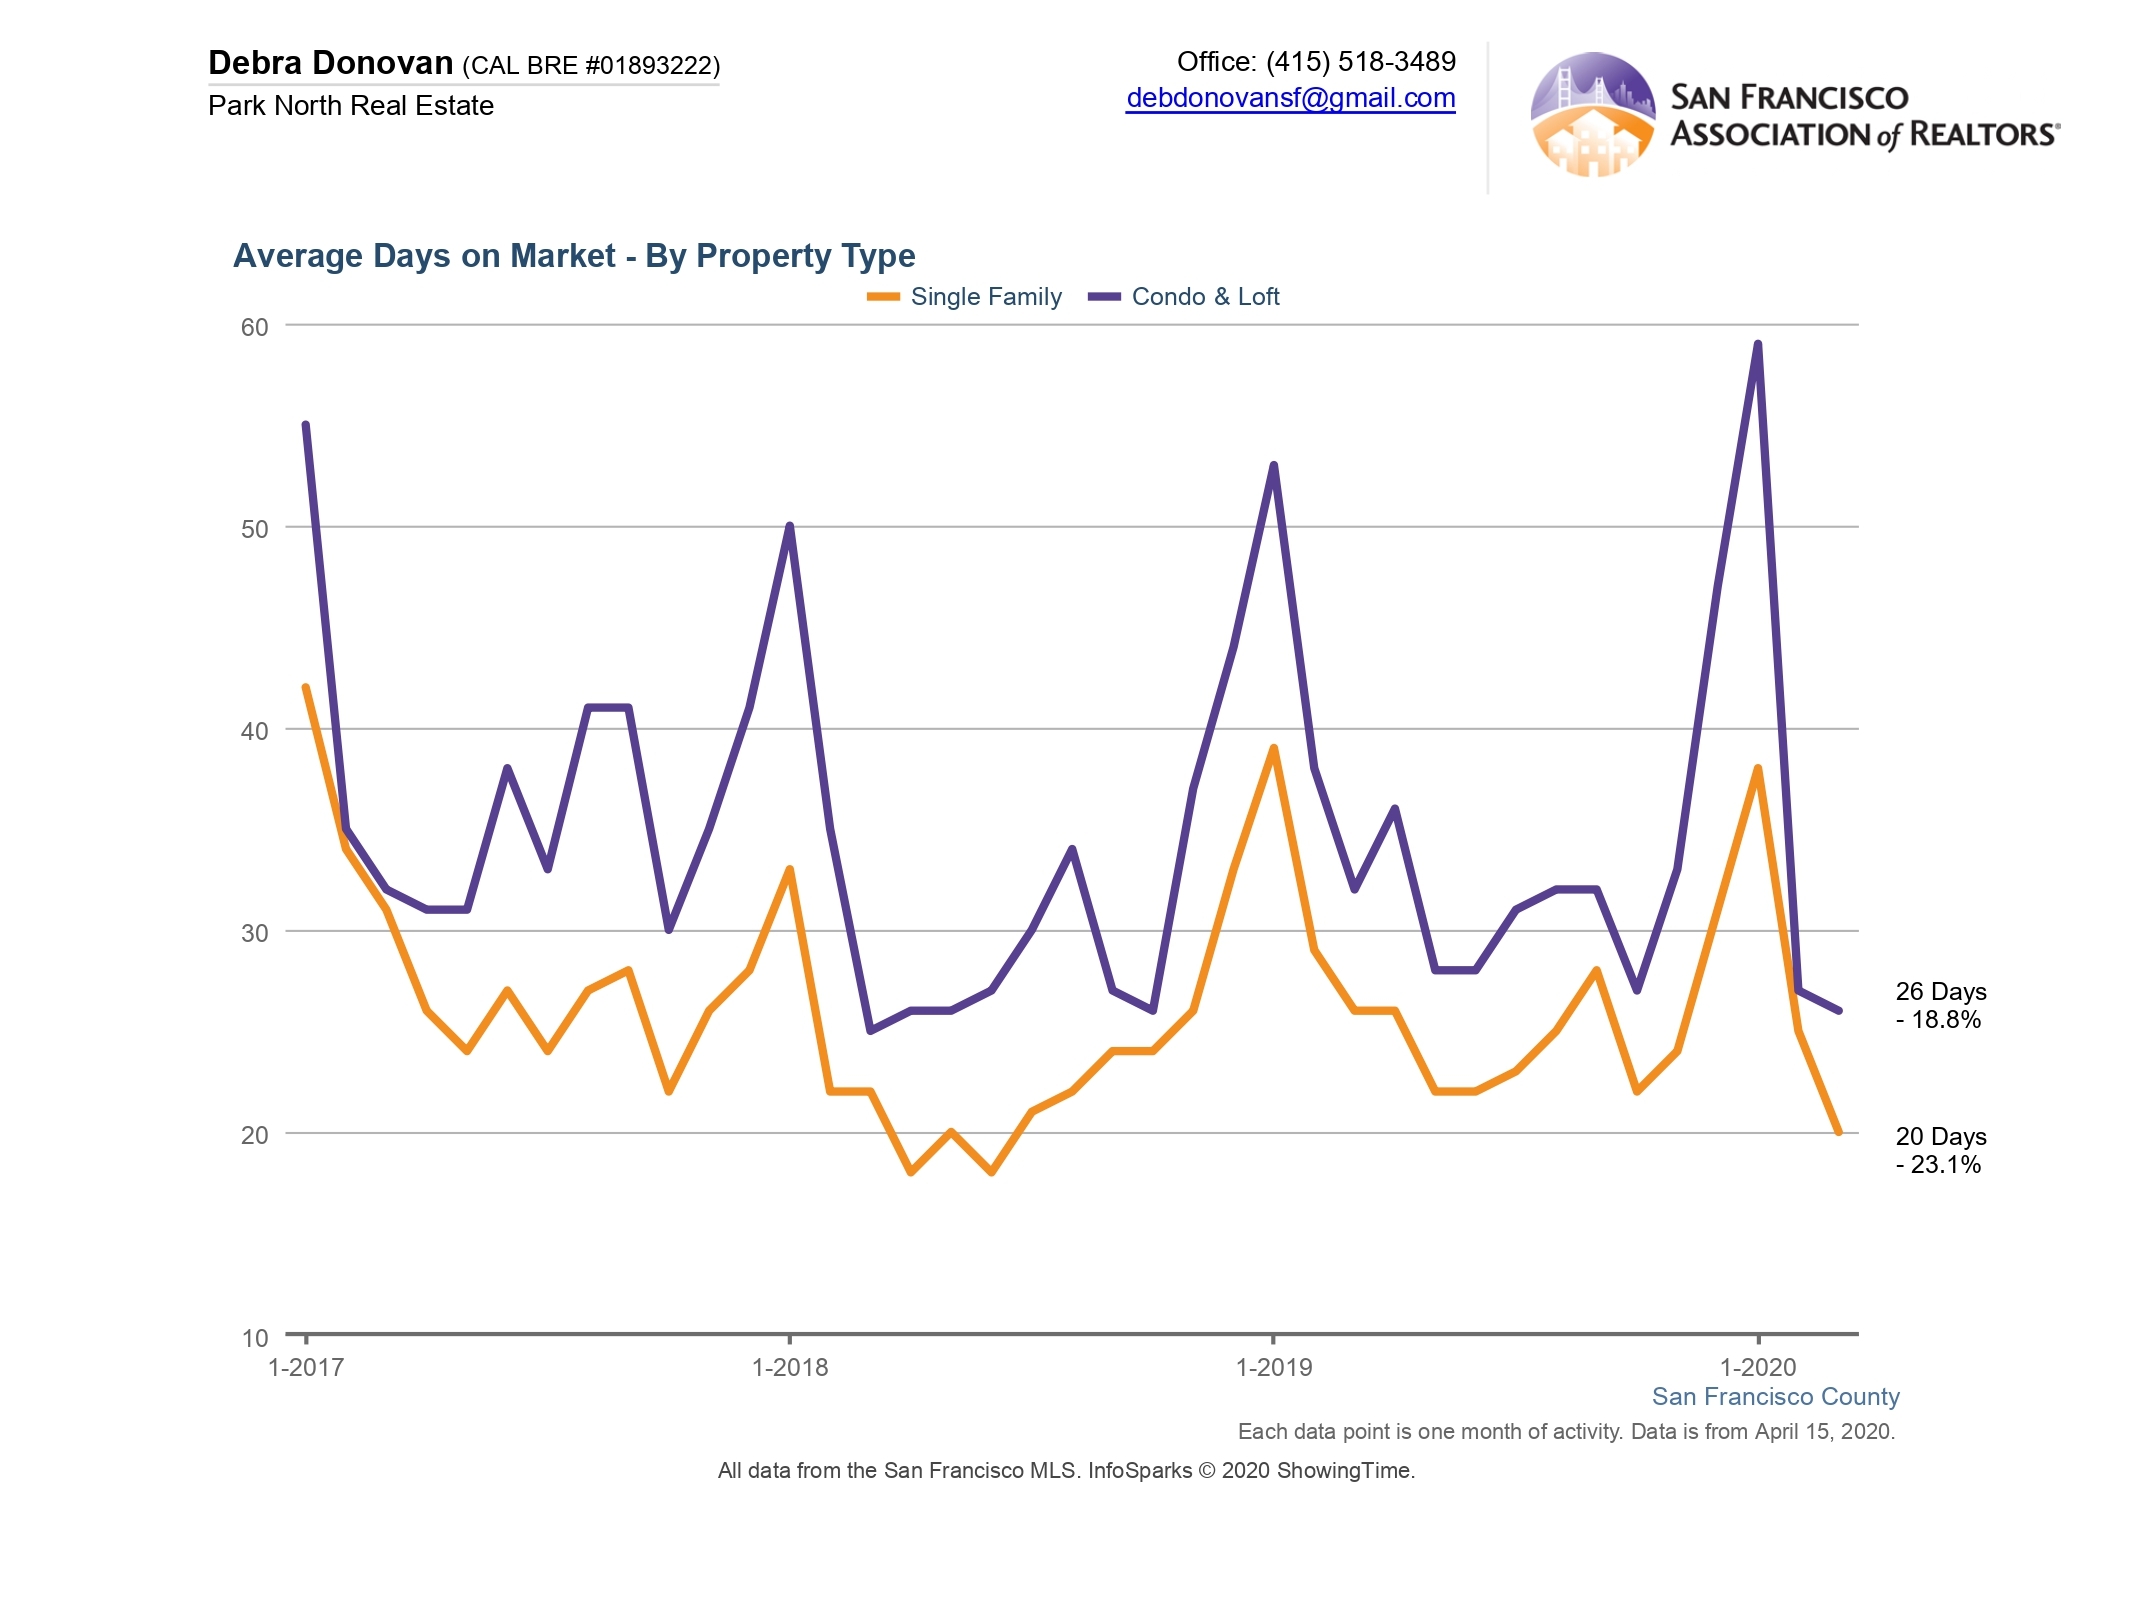
Average Days on Market:
Single family homes spent an average of 20 days on the market, down 23% compared to the same month last year. Condos and lofts spent an average of 26 days on the market, down 19% compared to the same month last year. Homes are continuing to sell quickly. Whether this will change post-shelter remains to be seen.
The fine print: All information deemed reliable but not guaranteed or warranted. Data comes from MLS so does not include off-market and most new construction condo sales. The San Francisco real estate market is dynamic so statistics can change on a daily basis. These statistics are meant to be a snapshot of the day and time they were pulled.