Unless you’ve been living under a rock, you’ve probably heard the alarm bells that the real estate market is cooling. Rising interest rates, falling stock prices and Bay Area companies not yet returning to the office have all contributed to a lessening of demand for local real estate. This, in turn, has caused prices to cool, inventory to stay on the market longer, and (great news for buyers)…less competition.
Daly City, too, is starting to experience this cooling. This summer, prices were only up minimally year-over-year, while sold listings and overbids were down slightly. Some properties are sitting on the market for longer than we are accustomed to. However, it’s perhaps not yet quite as dire as the media is making it out to be. Yes, prices are coming down and demand is slipping. But the majority of homes are still receiving over-asking offers and inventory is still low, staying in solid seller’s market territory.
Below are the market statistics for Daly City for Summer 2022 compared to Summer 2021.This includes June, July and August. A couple of things to keep in mind when reading this: First, due to the longer selling cycle of real estate, data for demand and prices are typically about 30 days behind. For example, properties that sold in June likely came onto the market in May when the market was more robust. Second, Daly City is a finite geographical area with a smaller sample size. So a shift of even 1-2 properties can make that seem a more significant percentage change than it really is.
If you have any questions regarding the Daly City real estate market, or if you’re thinking of buying or selling a home in Daly City, don’t hesitate to reach out. I’d be delighted to help you.
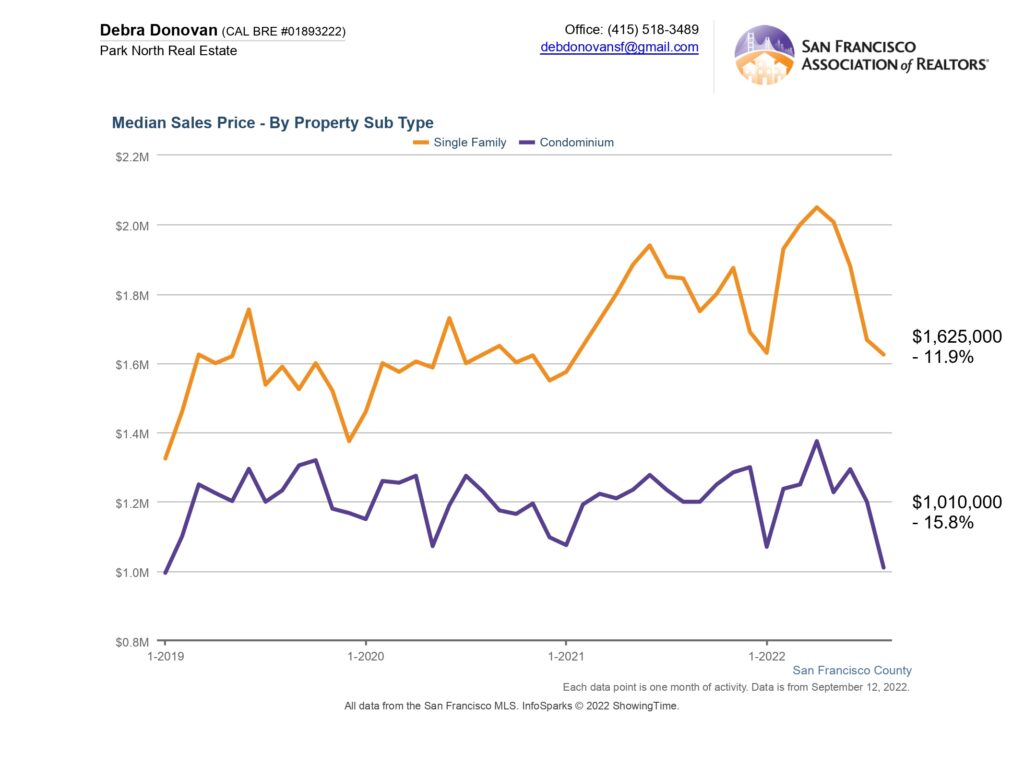
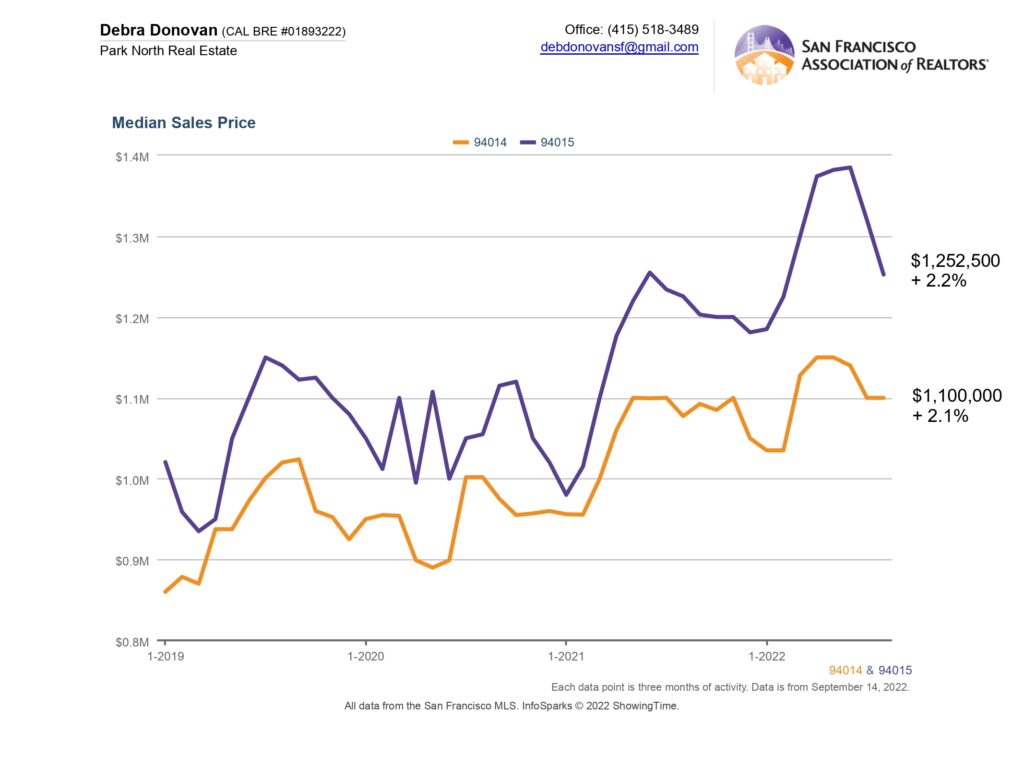
Median Sales Price:
The median sales price for homes in zip code 94014 increased 2% year-over-year to $1,000,000. Zip code 94015 saw a 2.2% increase to $1,252,500.
New Listings:
There was a dichotomy between zip codes in the number of new listings that came on-market this summer. Zip code 94014 saw 82 new listings, an increase of over 10%, while zip code 94015 new listings decreased 14% to 96 listings.
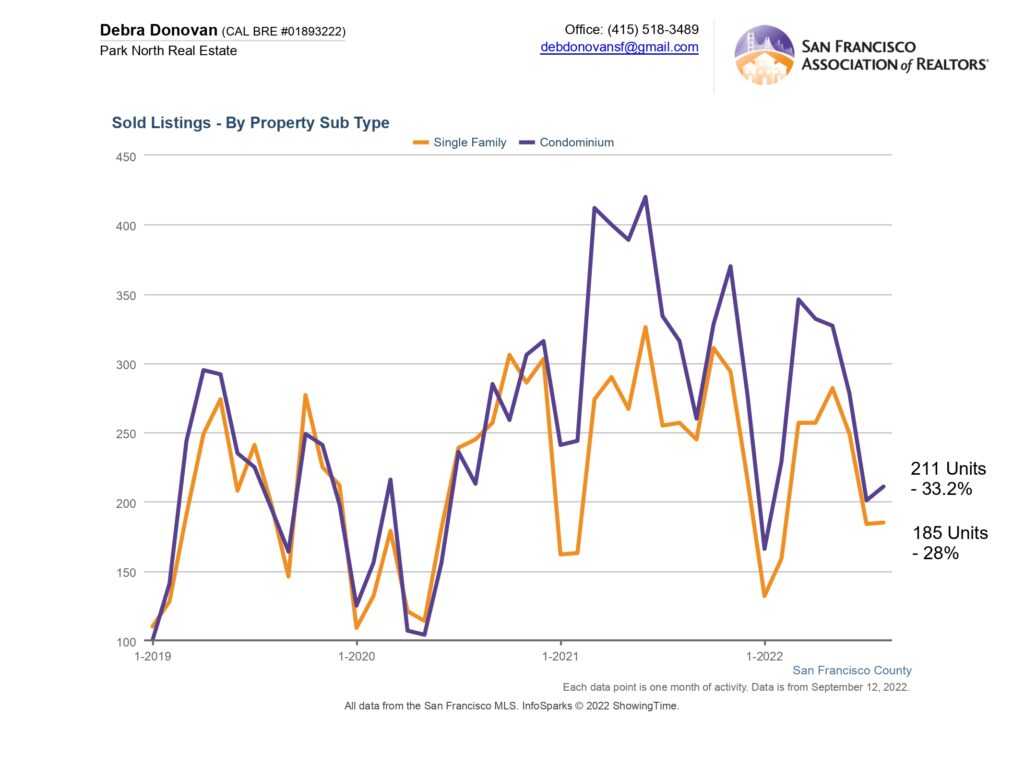
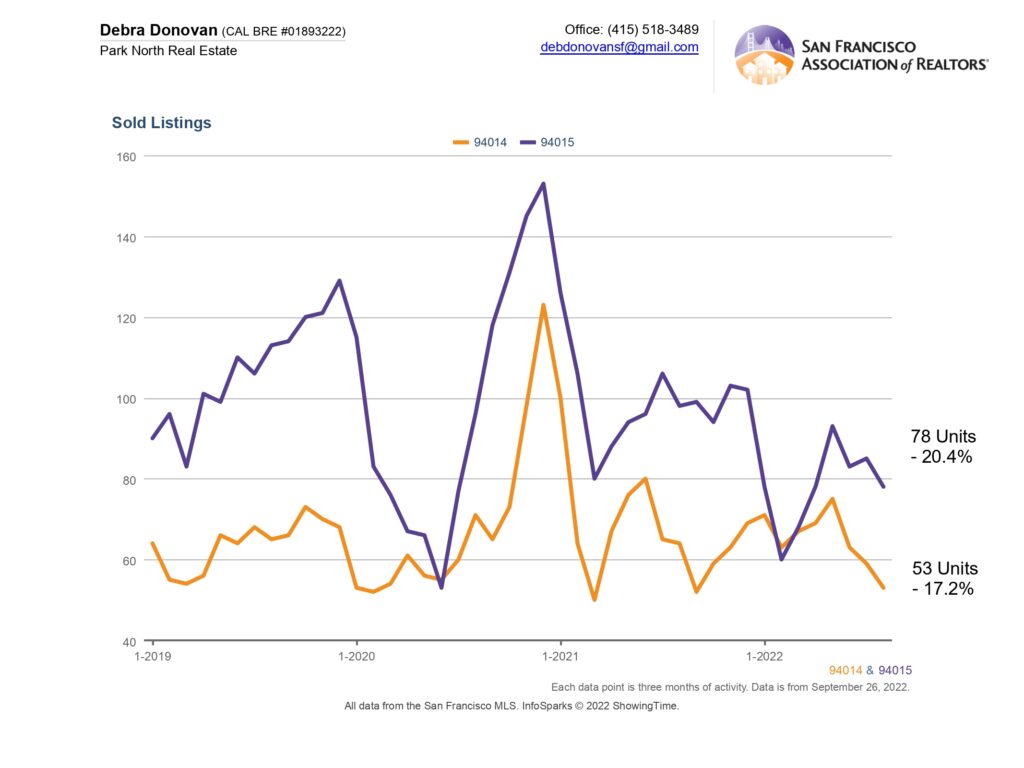
 Sold Listings:
Both zip codes 94014 and zip code 94015 experienced a decreased number of homes that sold over the summer, a result of the market cooling we’ve been experiencing. Zip code 94014 sold 53 homes, a decrease of 17% while zip code 94015 sold 78 homes, down over 20%.
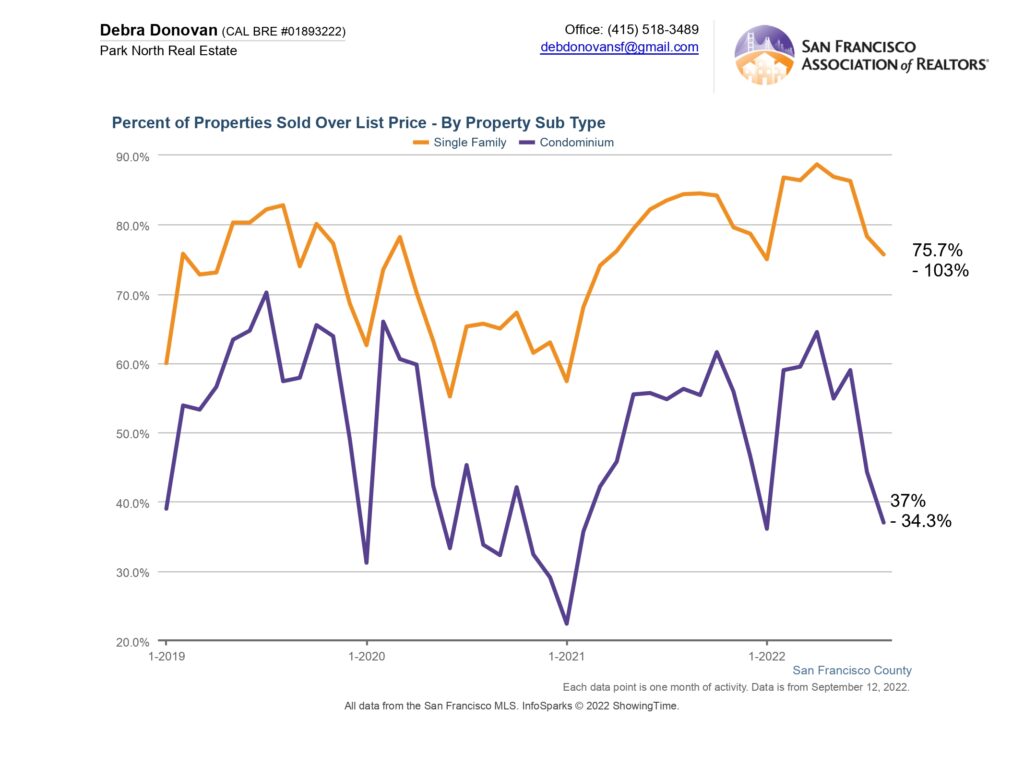
Percentage of Properties Sold Over List Price:
It stands to reason that with fewer sales there is less buyer competition and thus fewer homes selling over their list price. This is not across the board however. Very desirable homes are still selling quickly and well over their asking price. In fact, this is still the case for the majority of homes in Daly City. About 79% of homes in zip code 94014 sold for over their list price this summer, which was a decrease of 11% over last summer. Zip code 94015 also saw almost 80% of homes sold sell for over list price. That’s down almost 4% compared to summer 2021.

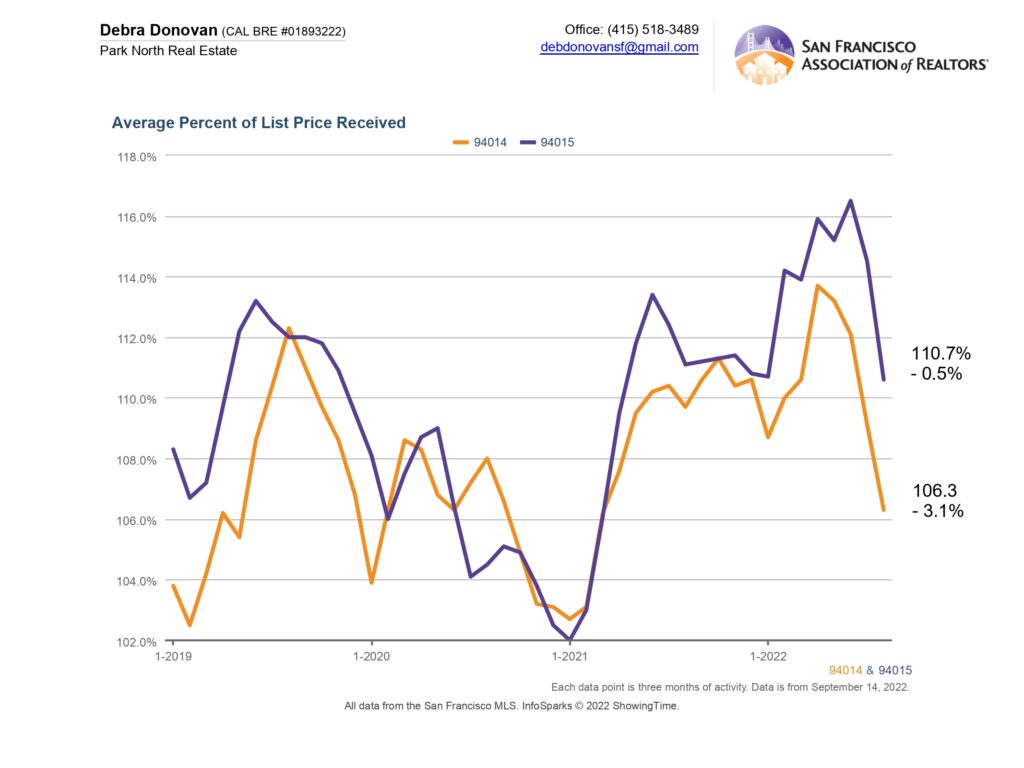
Average Percentage of List Price Received:
The average sales price for homes in Daly City also slipped this summer, though not markedly. The average percentage of list price received in zip code 94014 was 106%, down a little over 3%. Zip code 94015 homes sold on average 110.6% of their list price, down just .50% compared to last summer.
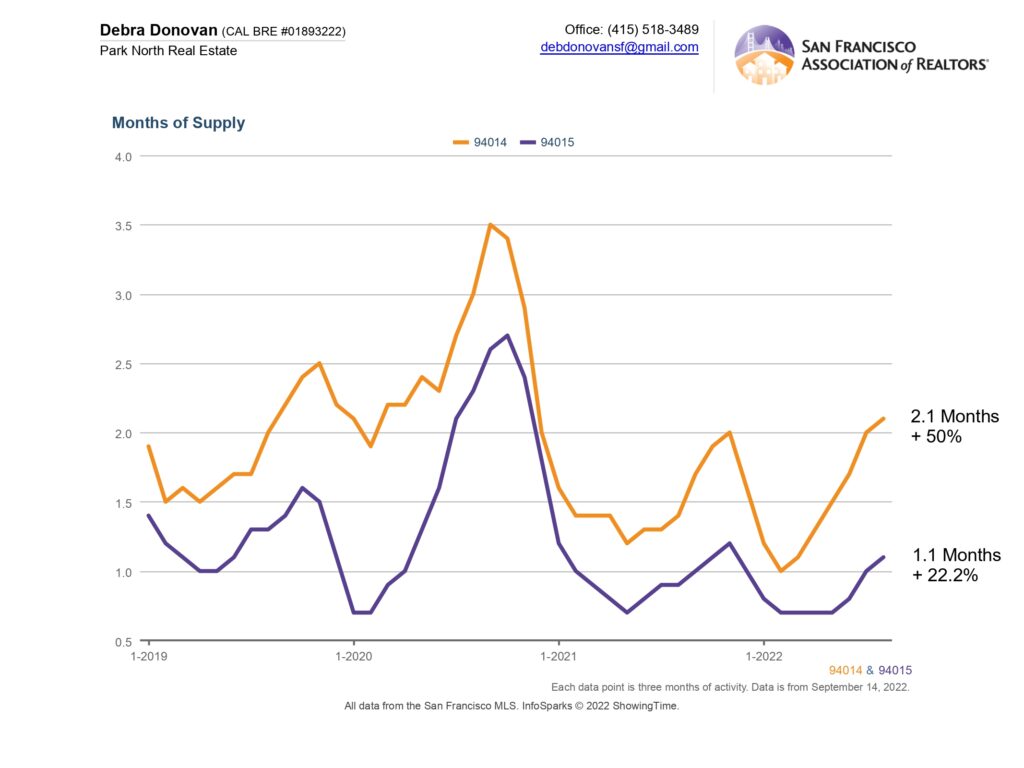
Months Supply of Inventory:
Months Supply of Inventory, or MSI, is an indication of how quickly homes are selling in a particular market. For many years Daly City has been a seller’s market, typically defined 5 months or less of inventory. A balanced market would be 6-8 months of inventory, while 9 or more months defines a buyer’s market. While MSI increased over the summer, Daly City continues to very much be a seller’s market. Zip code 94014 ended the summer with 2.1 months of inventory, up 50% compared to last summer. Zip code 94015 had 1.1 months of inventory, incredibly low but still up from summer 2021.
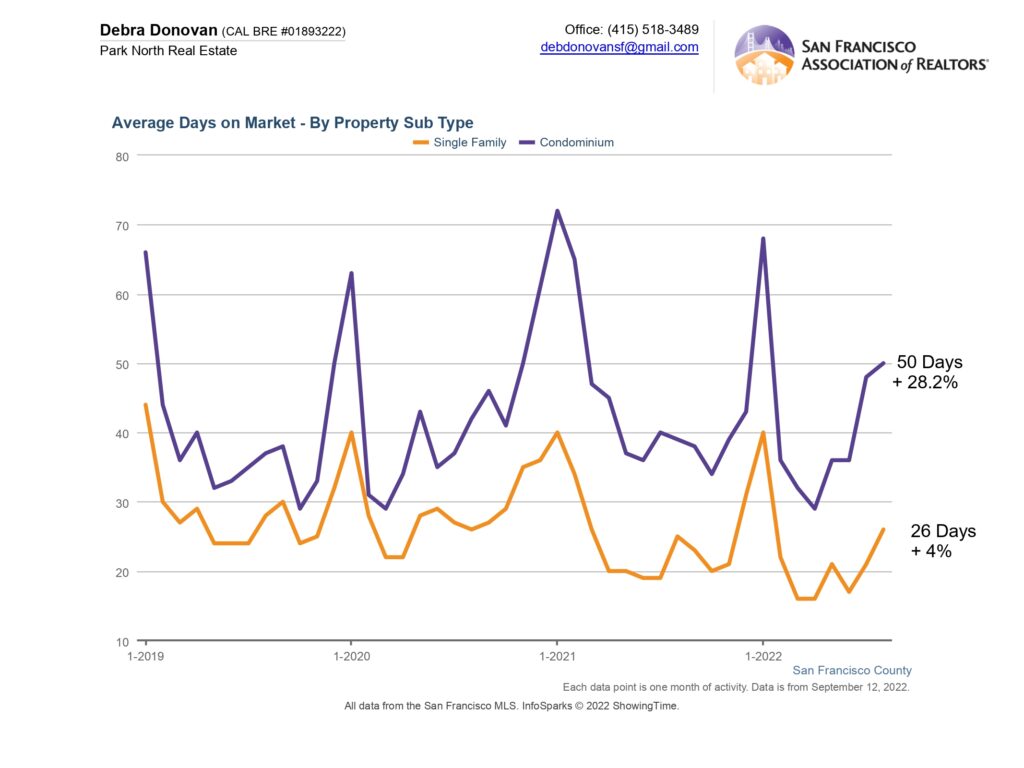
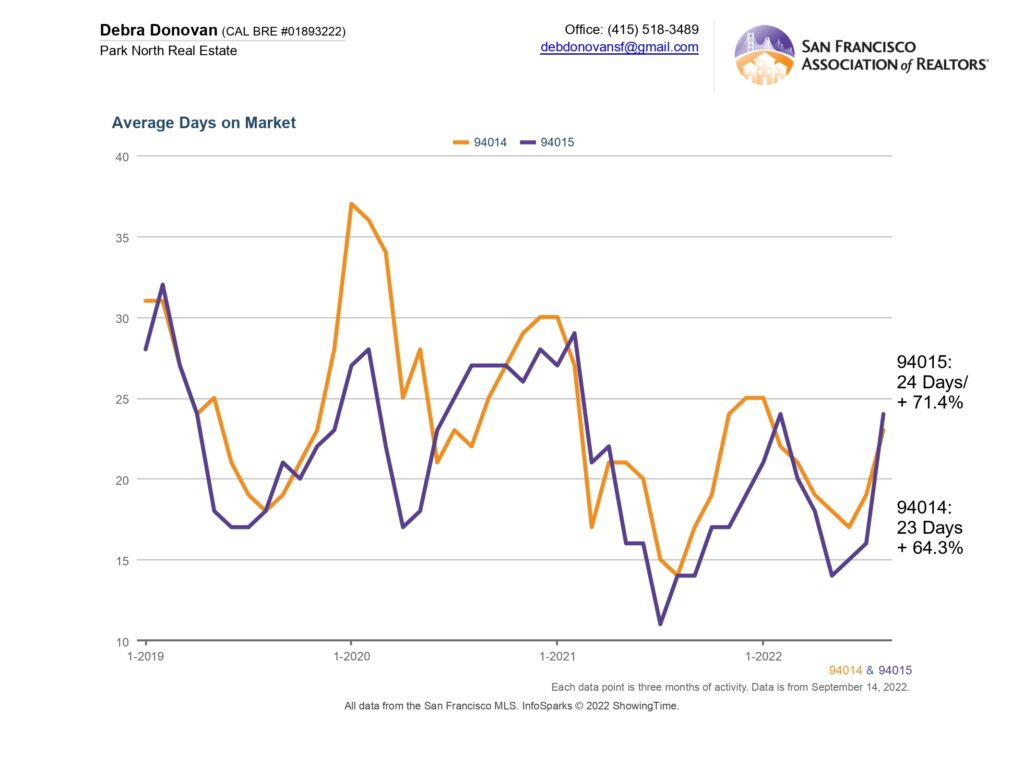
Average Days on Market:
Days on market indicated the number of days a property remains on the market before accepting an offer. This summer, homes in zip code 94014 spent an average of 23 days on the market, an increase of over 64% compared to last summer. Homes in zip code 94015 spent an average of 24 days on market, up over 70% compared to summer 2021.
The fine print: All information deemed reliable but not guaranteed or warranted. Data comes from the MLS so does not include off-market and most new construction condo sales. The Bay Area real estate market is dynamic so statistics can change on a daily basis. These statistics are meant to be a snapshot of the day and time they were pulled.