What’s that old expression about March coming in like a lion and going out like a lamb? That lion sure has been roaring! I hope you’ve kept safe and dry over the past couple of weeks. I’m definitely looking forward to some warmer, dryer weather.
The wet weather doesn’t seem to have slowed down the San Francisco real estate market though. In February the median sales price for single family homes spiked again, and with inventory still down double-digits, the vast majority of homes are selling quickly and for over their asking price. Here are the numbers:
Median Sales Price: A new high or just a blip?
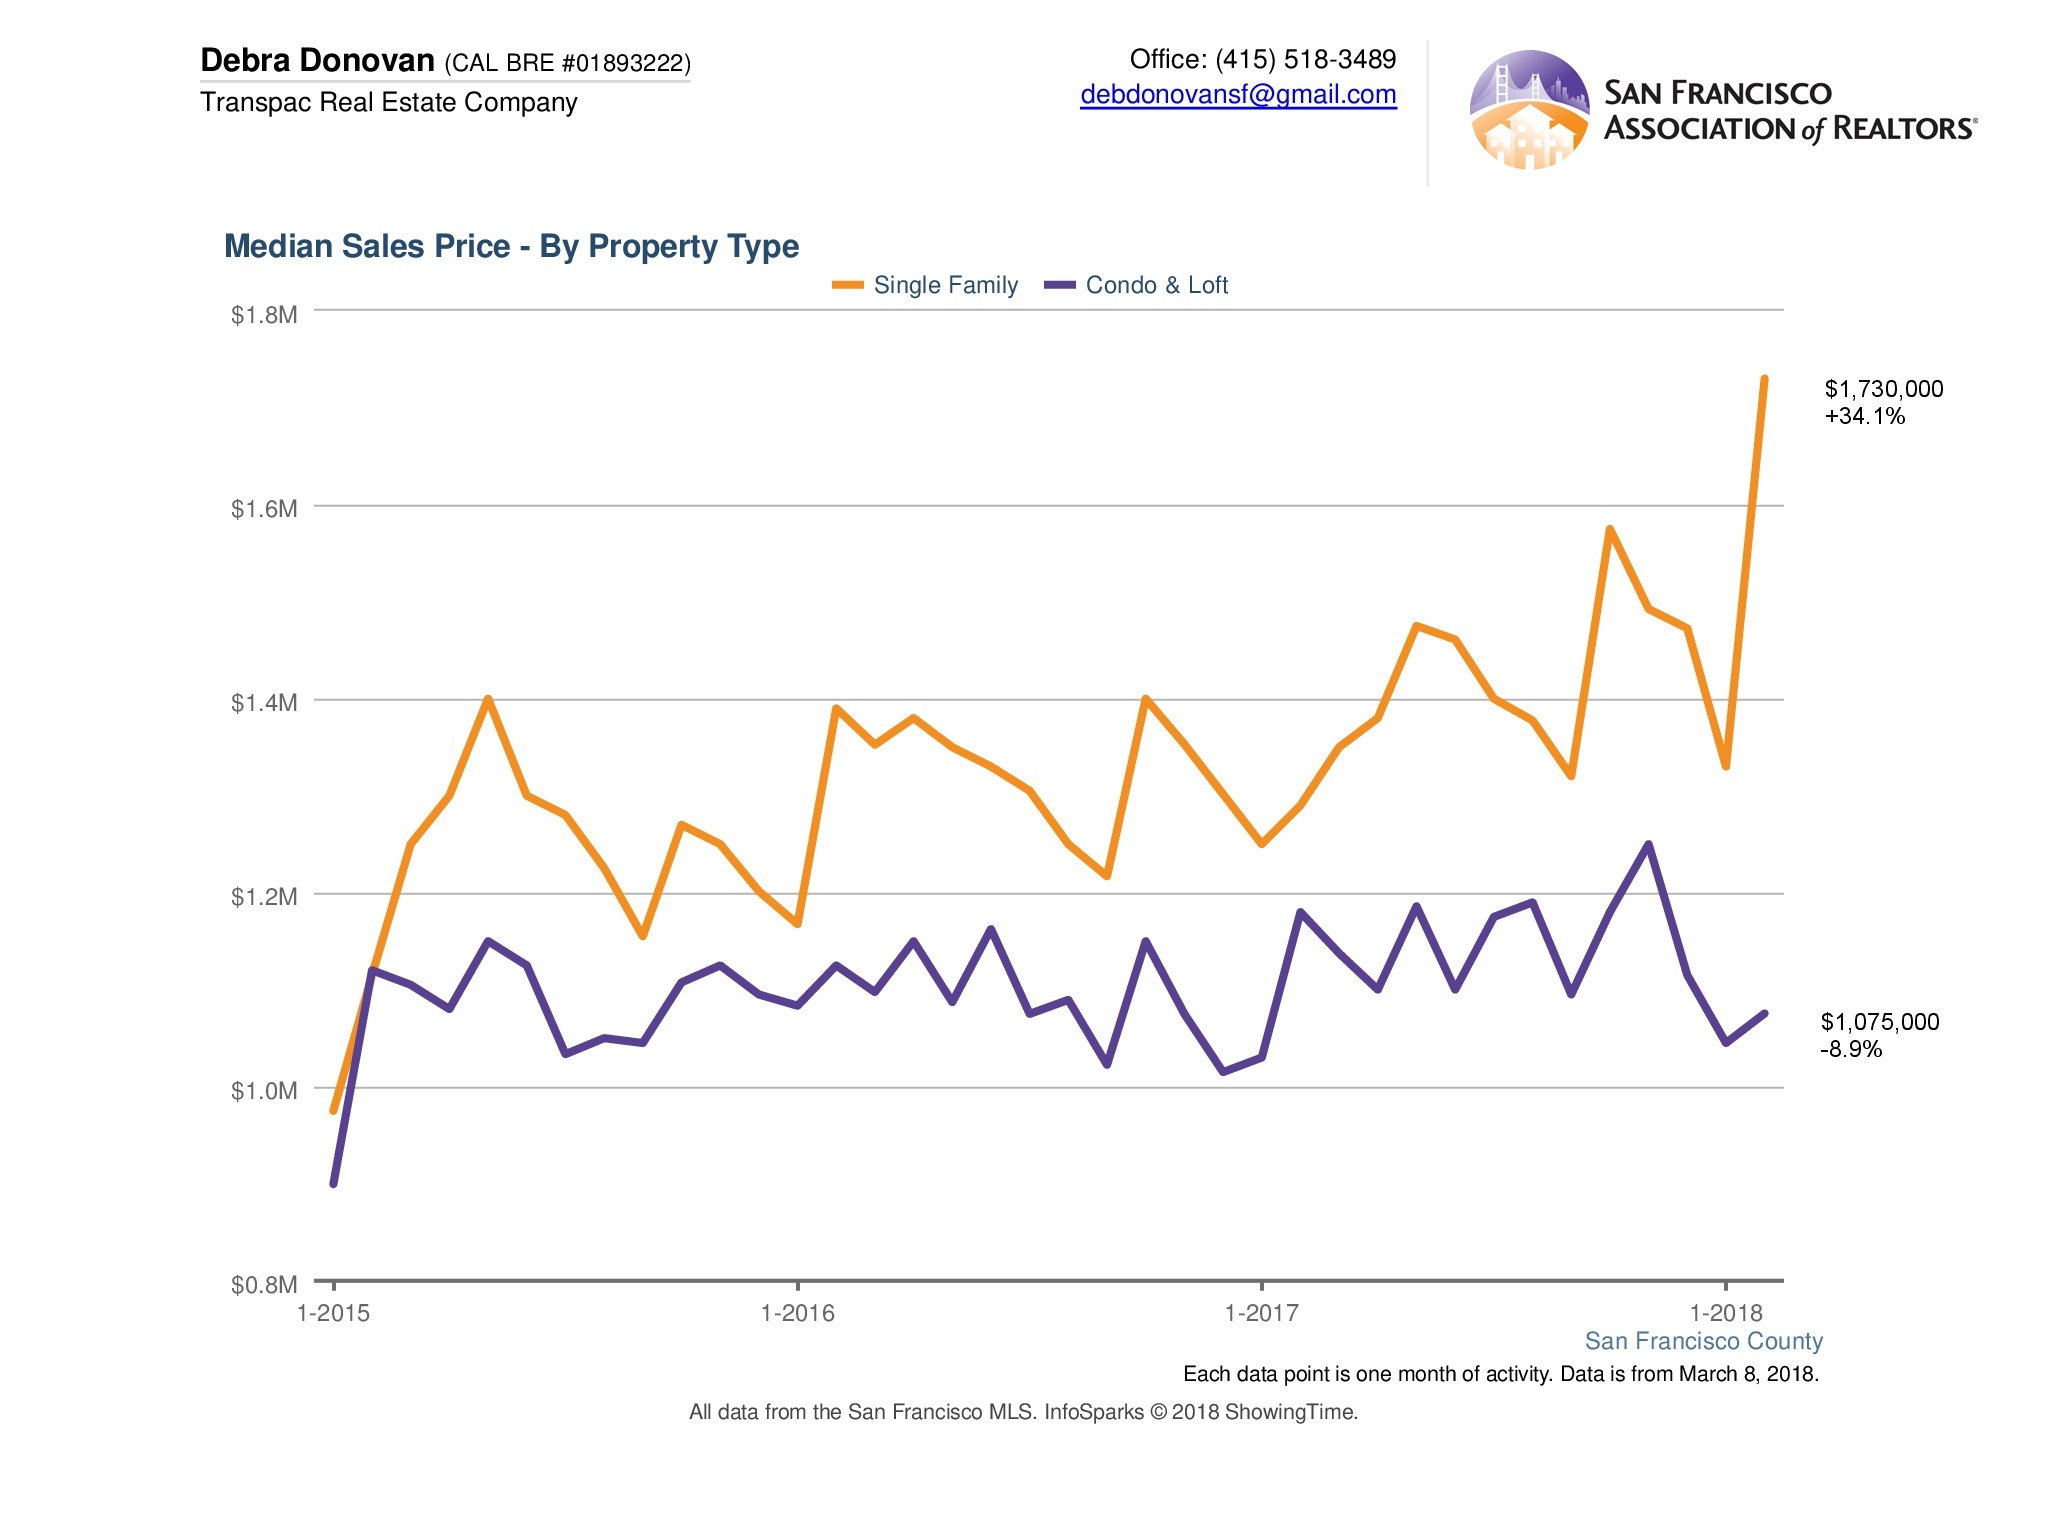
The median sales price for a single family home soared to $1,730,000. That’s up 34% over February of last year. Condo and loft prices, on the other hand, decreased almost 9% compared to the same month last year.
The South Side Rules:
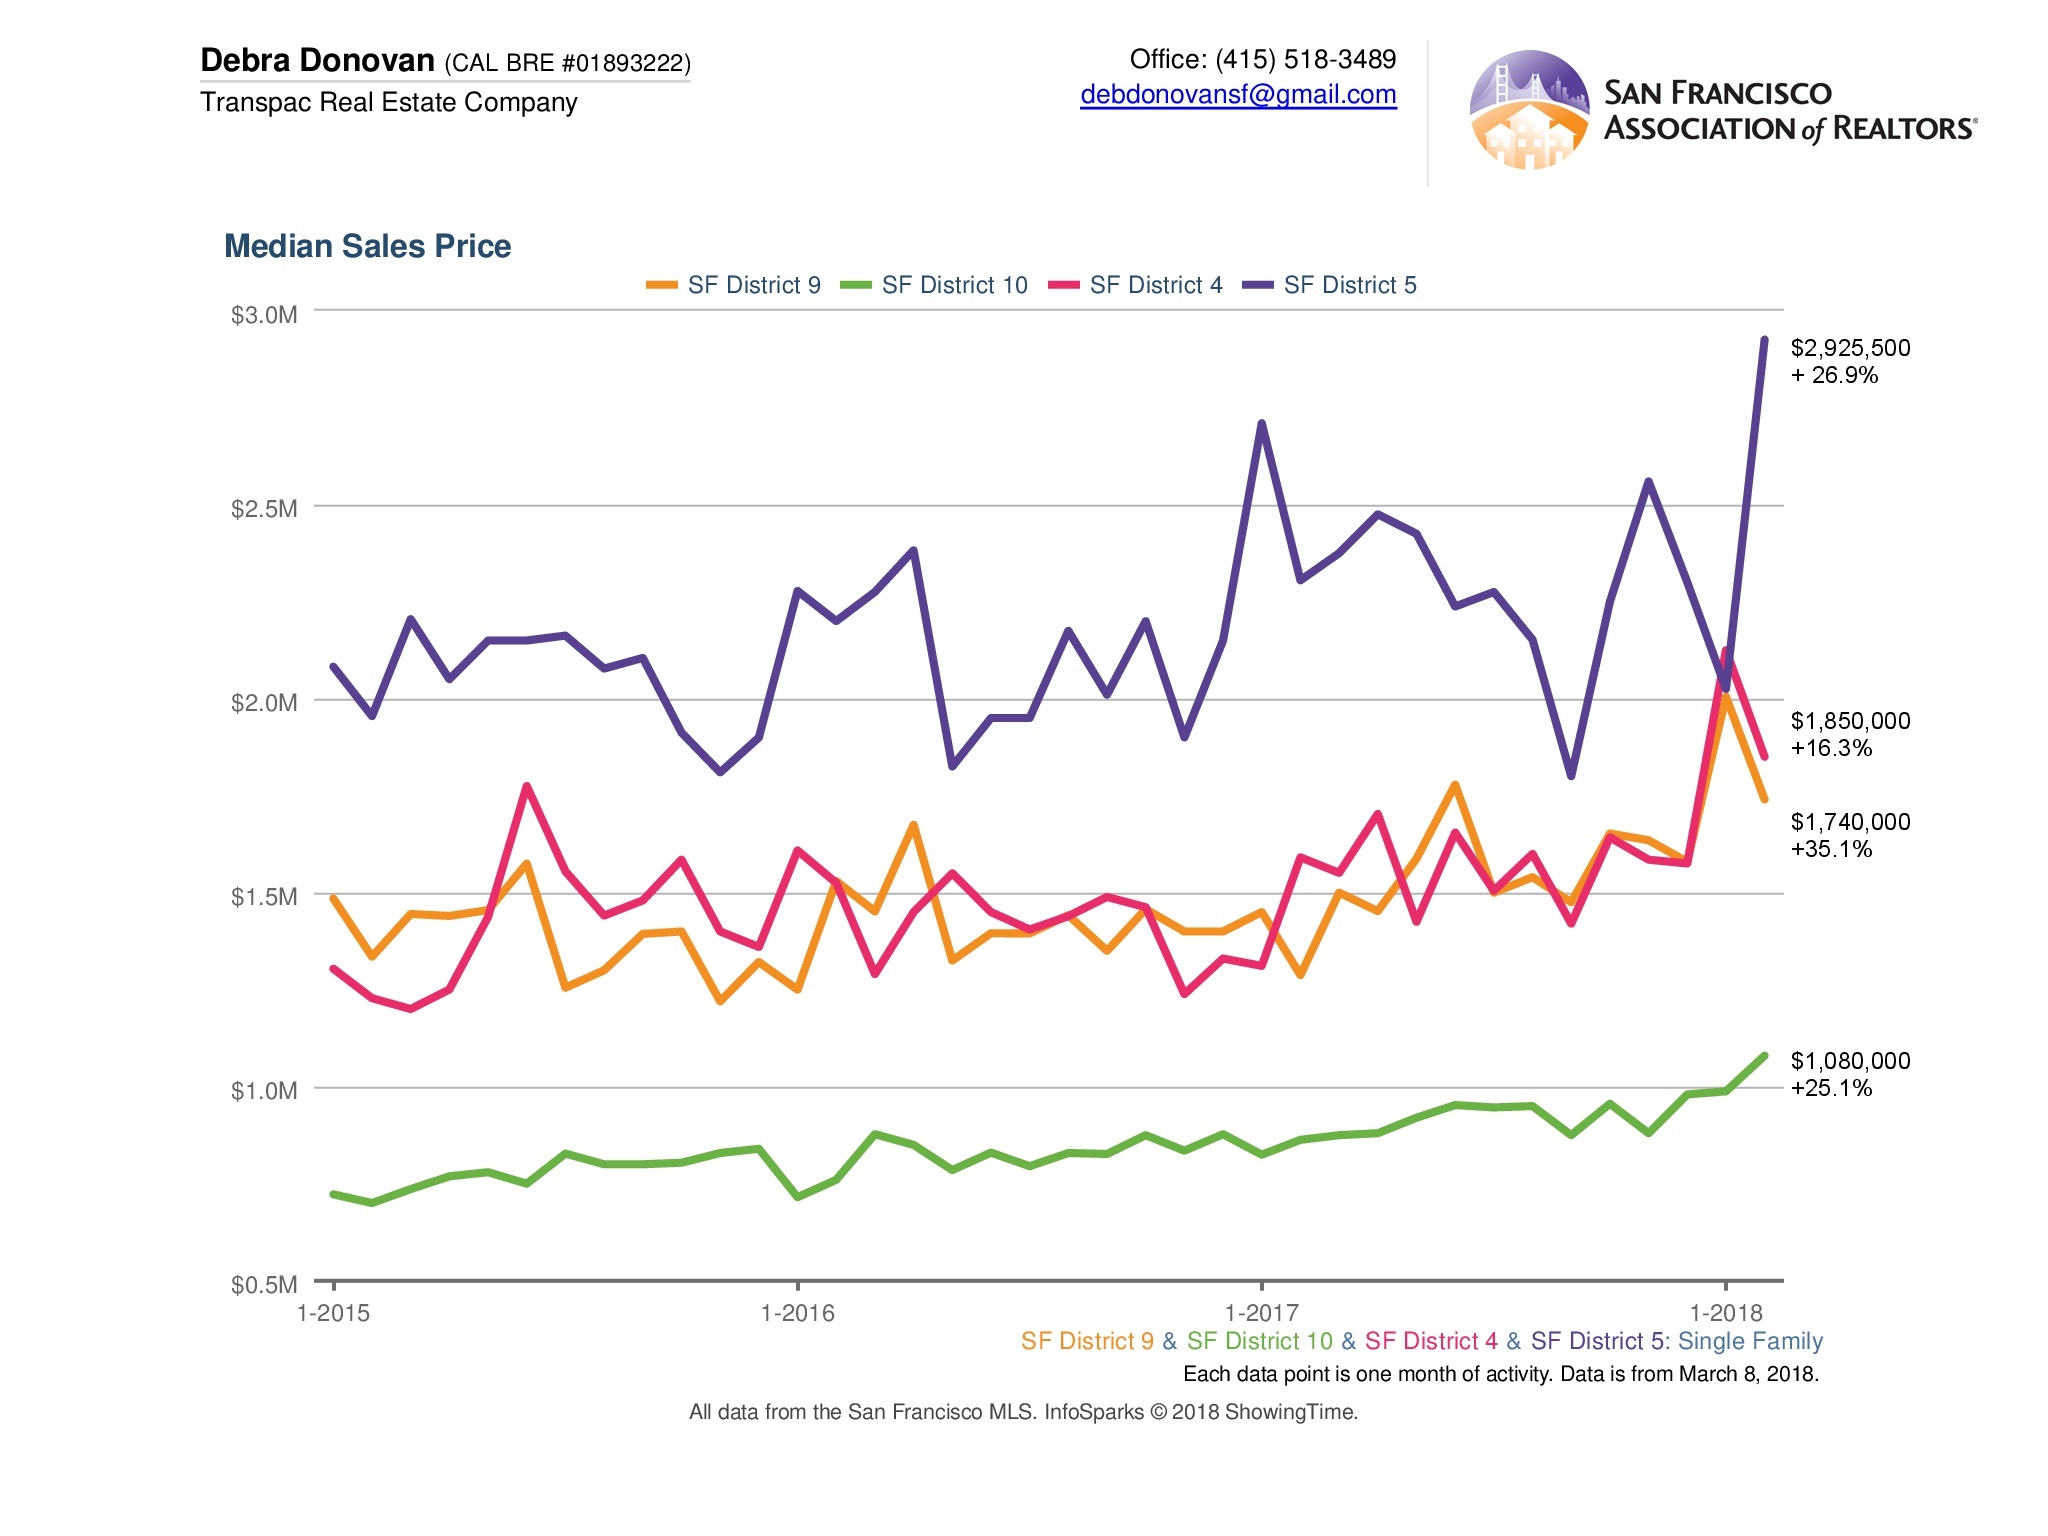
When breaking down that dramatic increase in median sales price by district, the districts with the largest increase in median price were all in the more southern parts of the city. District 9, which includes popular neighborhoods like Bernal Heights, Potrero Hill and the Inner Mission topped the chart with an overall 35% increase, followed by District 5 that encompasses Noe Valley and Glen Park. District 10, considered one of the last bastians of affordability in the city saw median single family home prices spike 25% while District 4 single family home prices rose 16% compared to the same month last year. District 4 includes popular neighborhoods like Sunnyside, Mira Loma and West Portal.
The Inventory Blues:
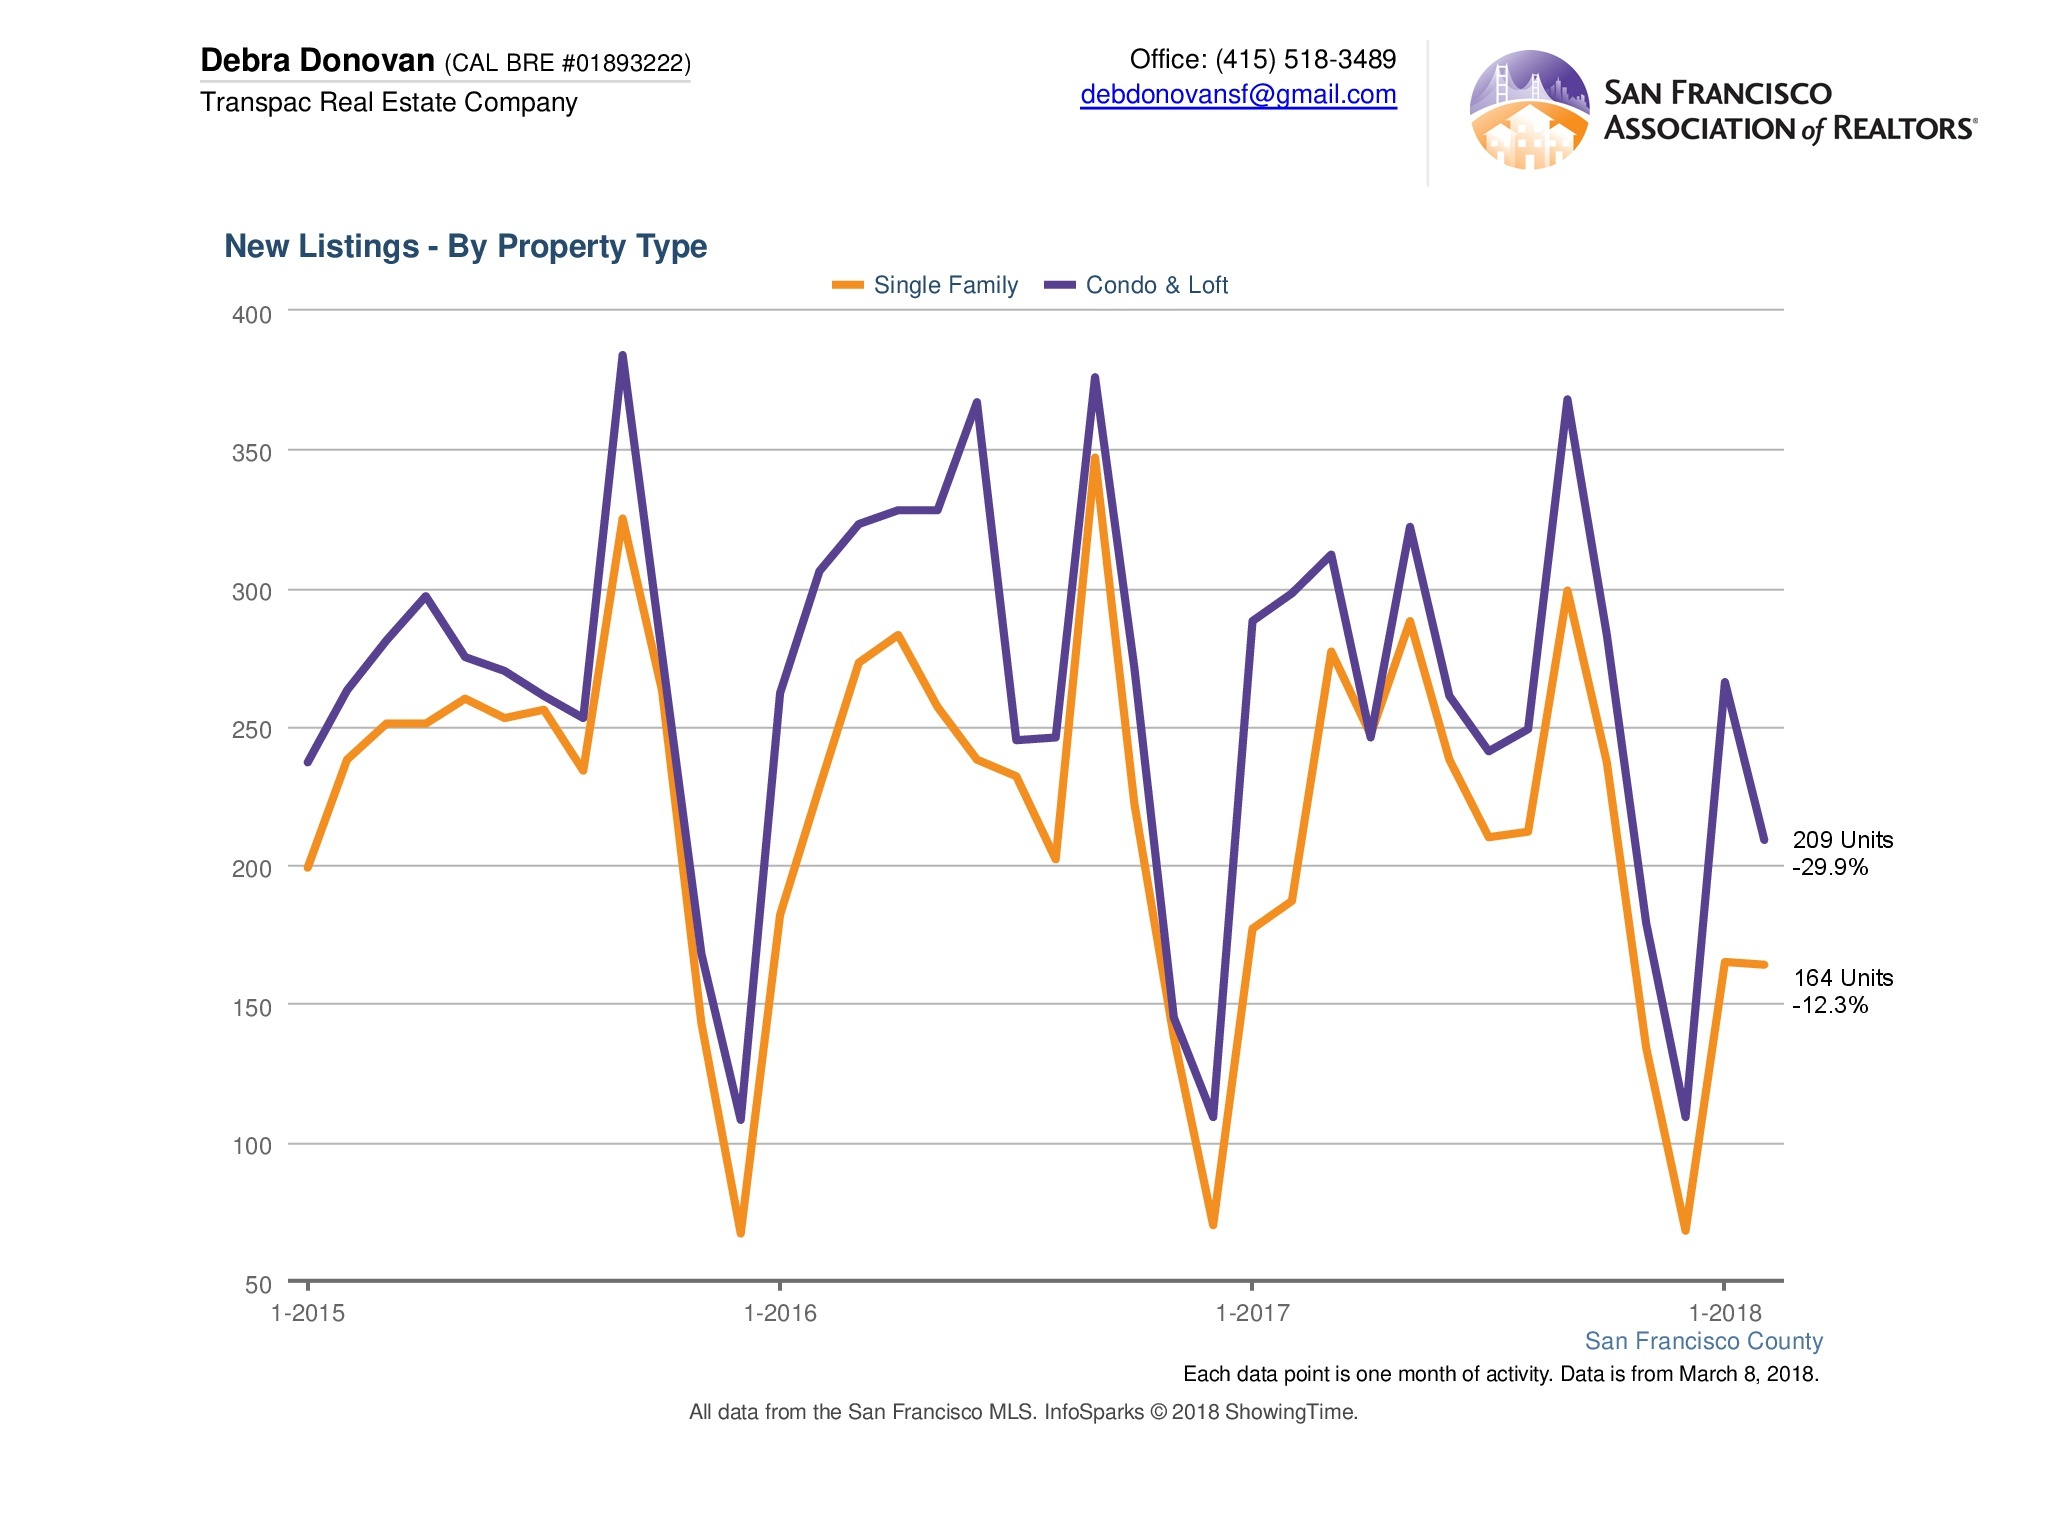
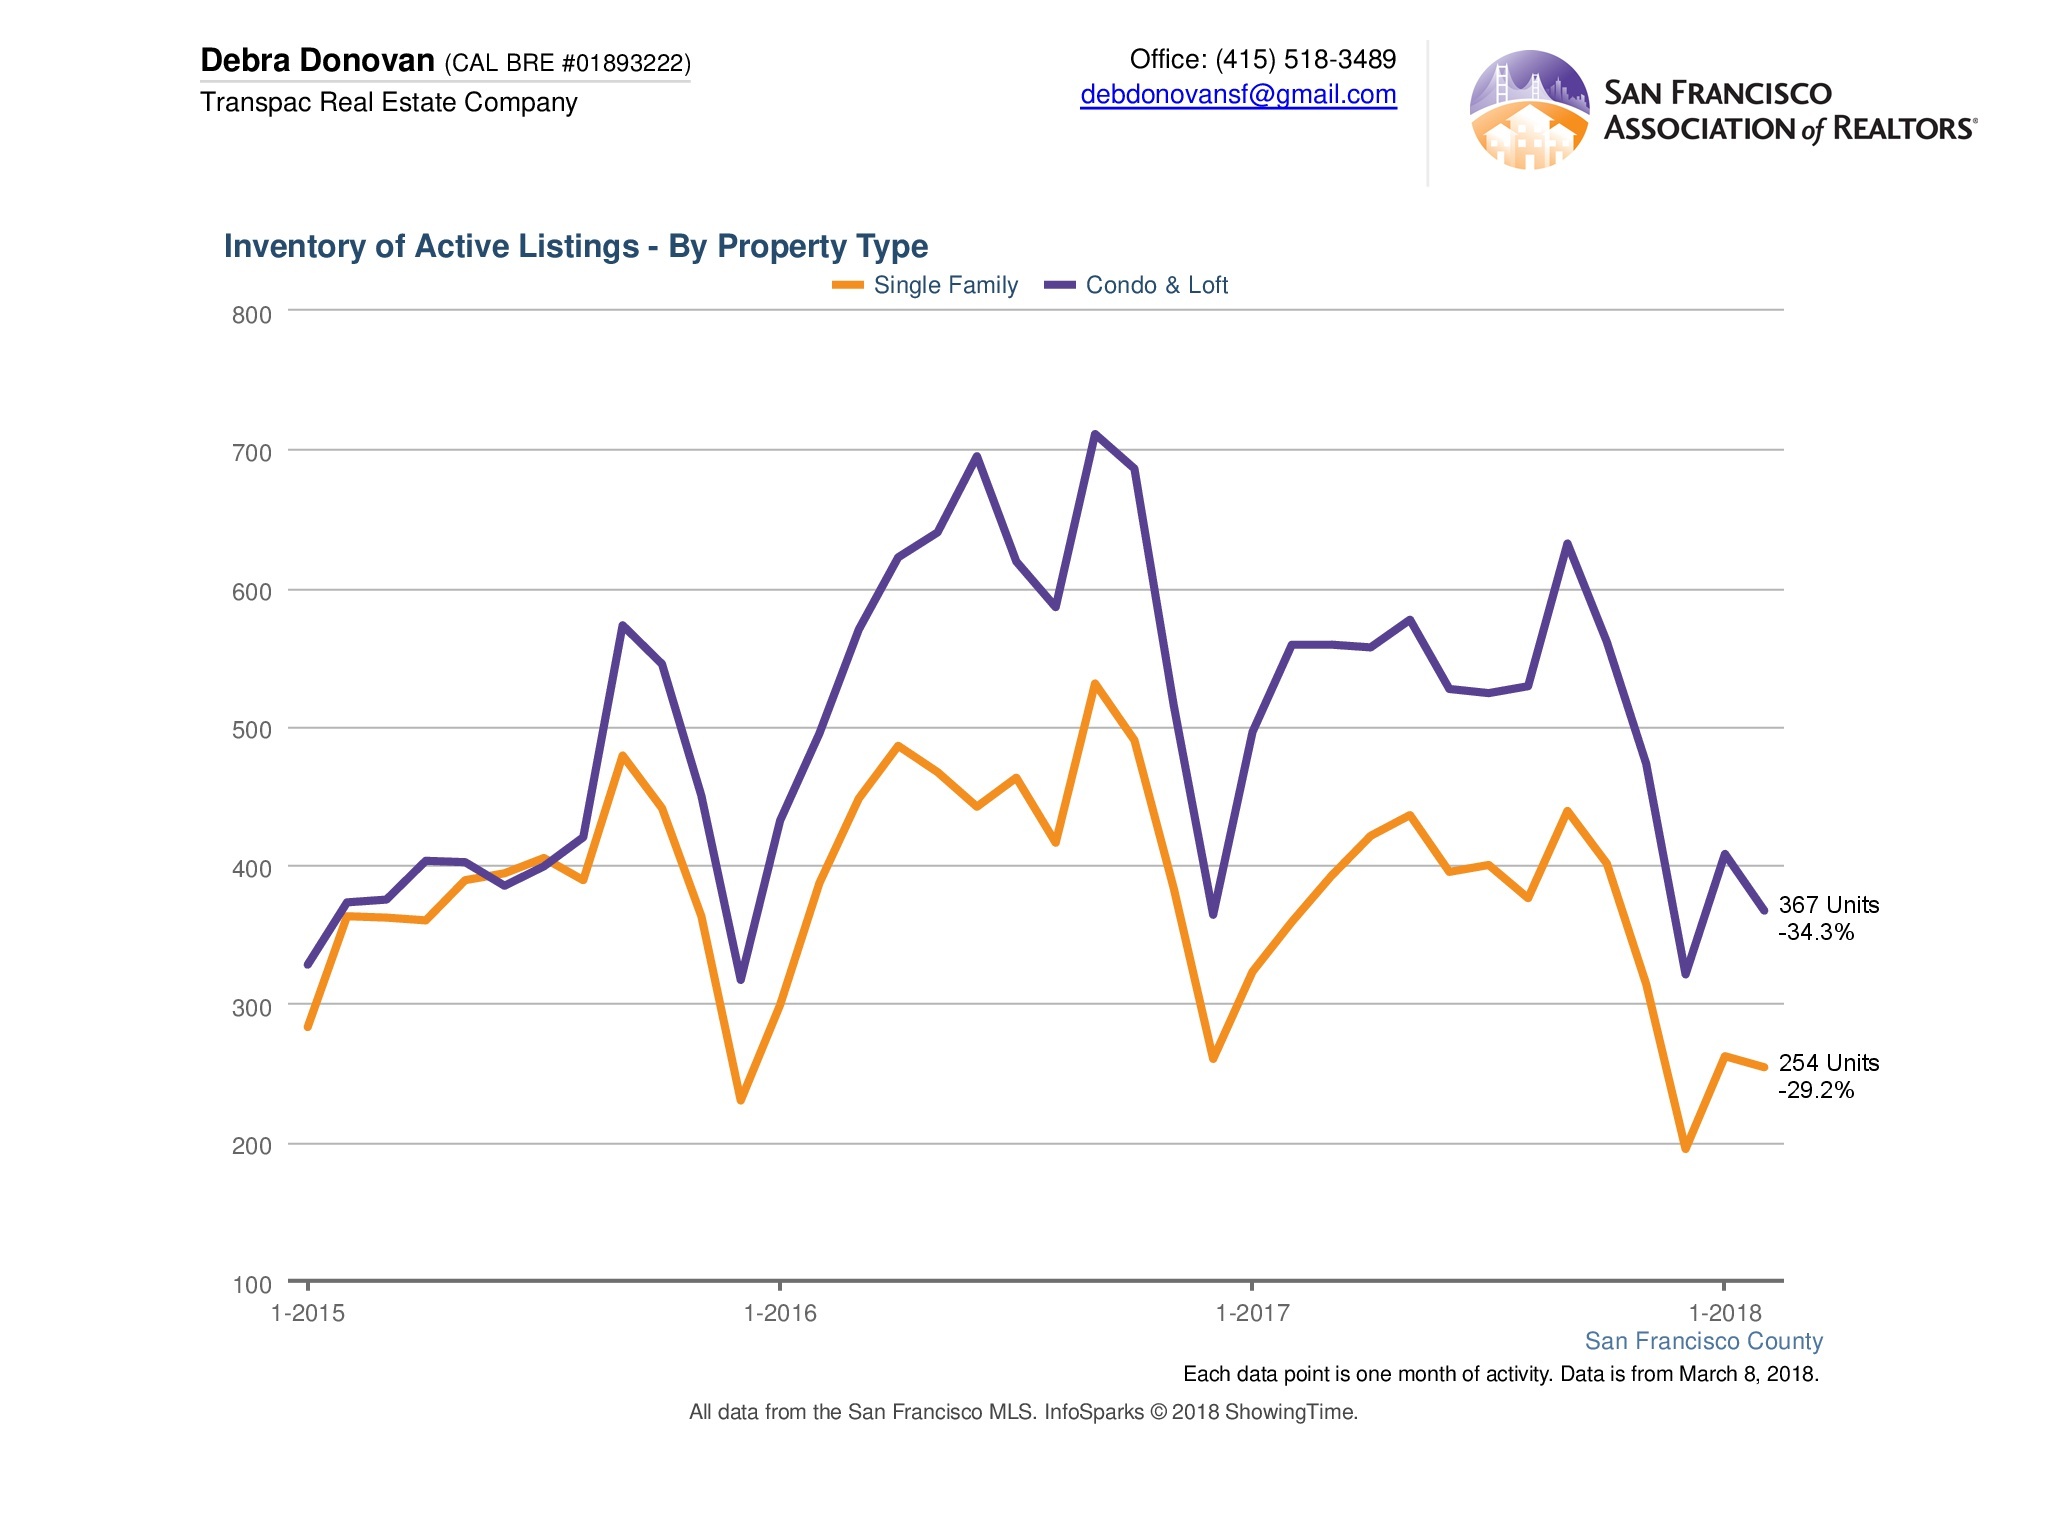
While it’s typical for the winter months to have fewer listings and sales, our inventory drought continues this month with 12% fewer new single family homes listings coming onto the market and condo/ loft new listings down almost 30% compared to last February. The number of overall active listings was equally grim with single family homes down 29% and condo/ loft active listings down 34%.
Percentage of Properties Sold Over List Price:
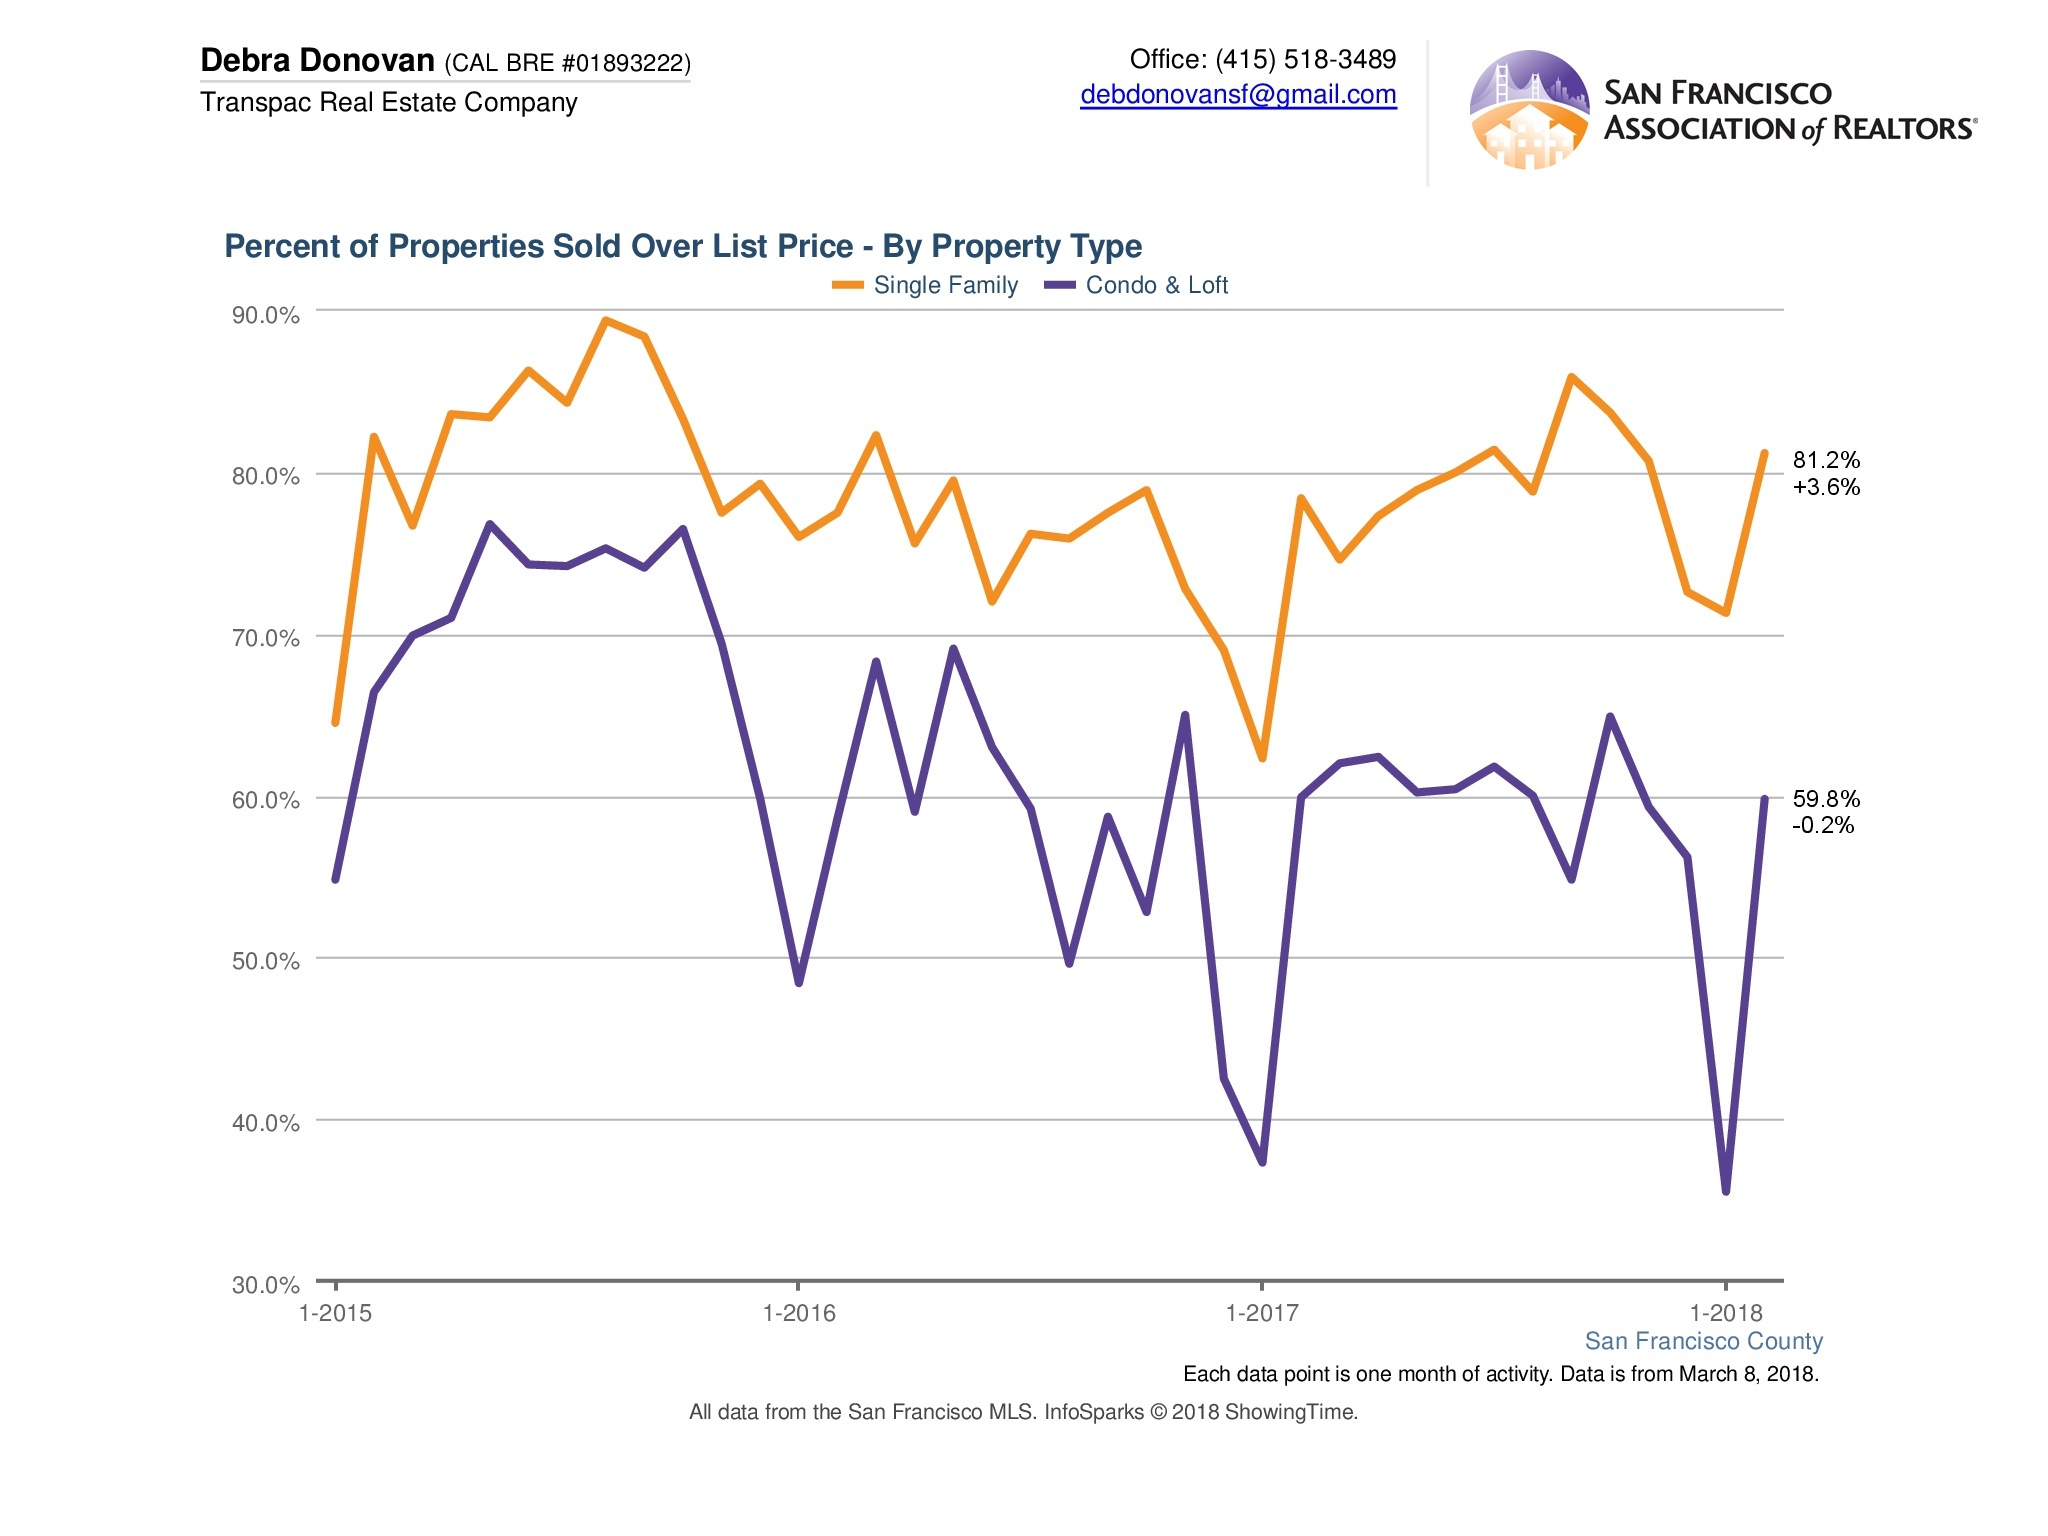
Given the dearth of inventory, it’s not surprising that over 80% of single family homes sold for over their asking price in February. Almost 60% of condo/ lofts did as well.
MSI:
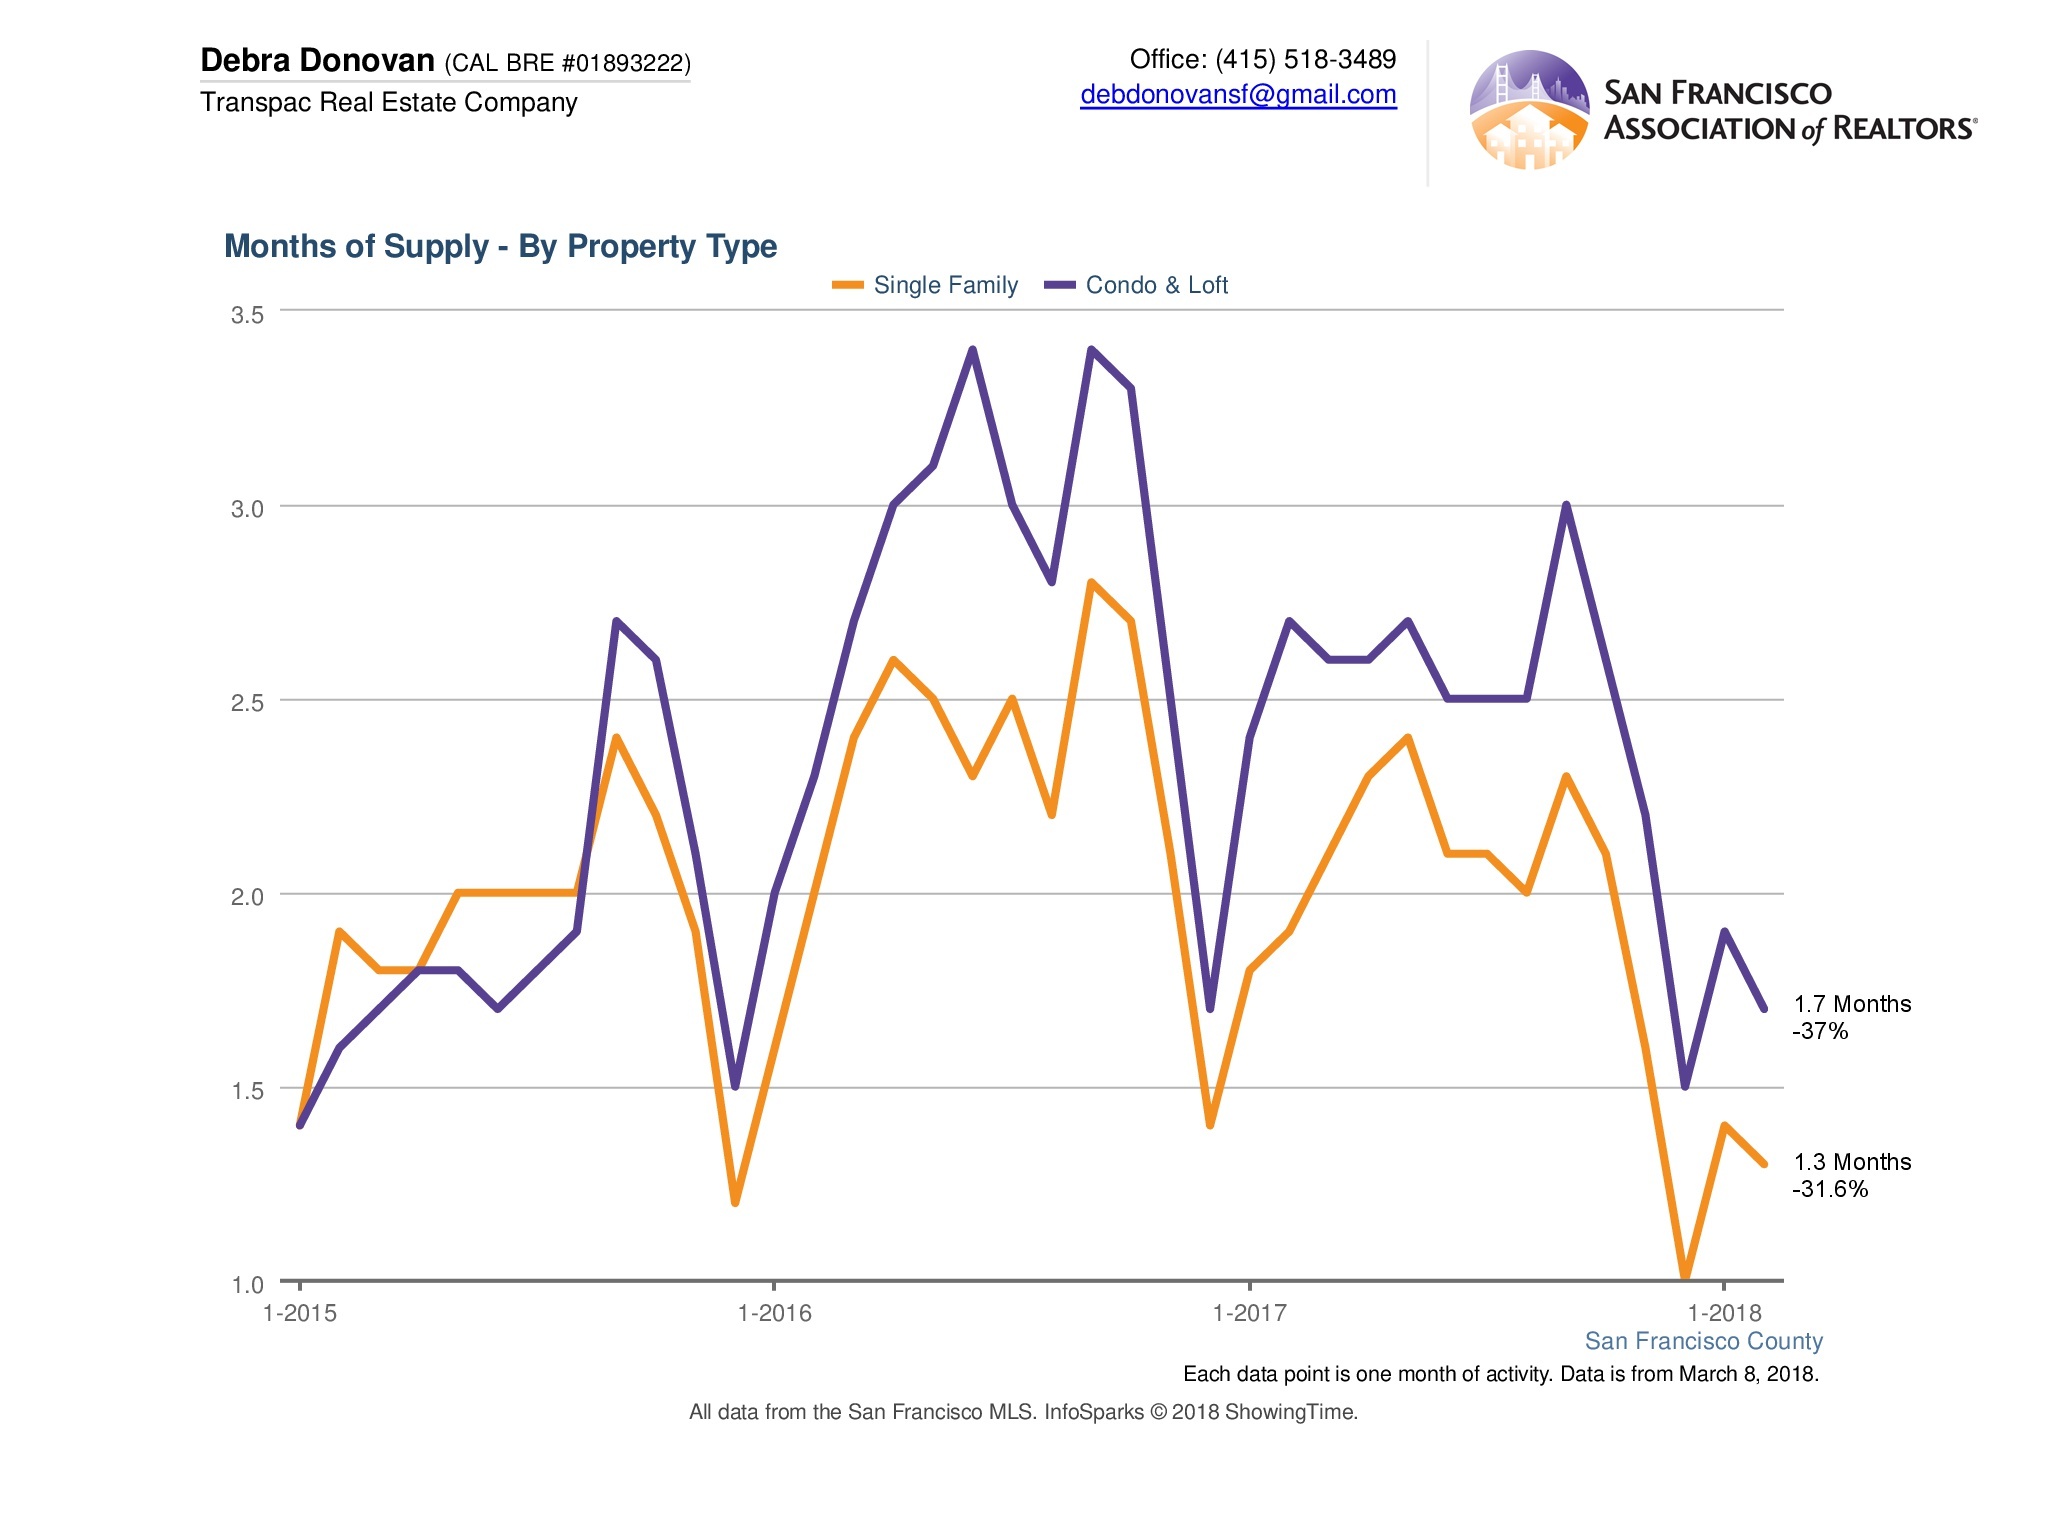
Months supply of Inventory stayed relatively the same as January at 1.3 months, down more than 31% compared to February of last year. Condo/ lofts dropped slightly to 1.7 months, down 37% compared to the same time last year. In general, between 4-6 months of inventory is considered a balanced market; less than that is a seller’s market and more is considered a buyer’s market.
Average Days on Market:
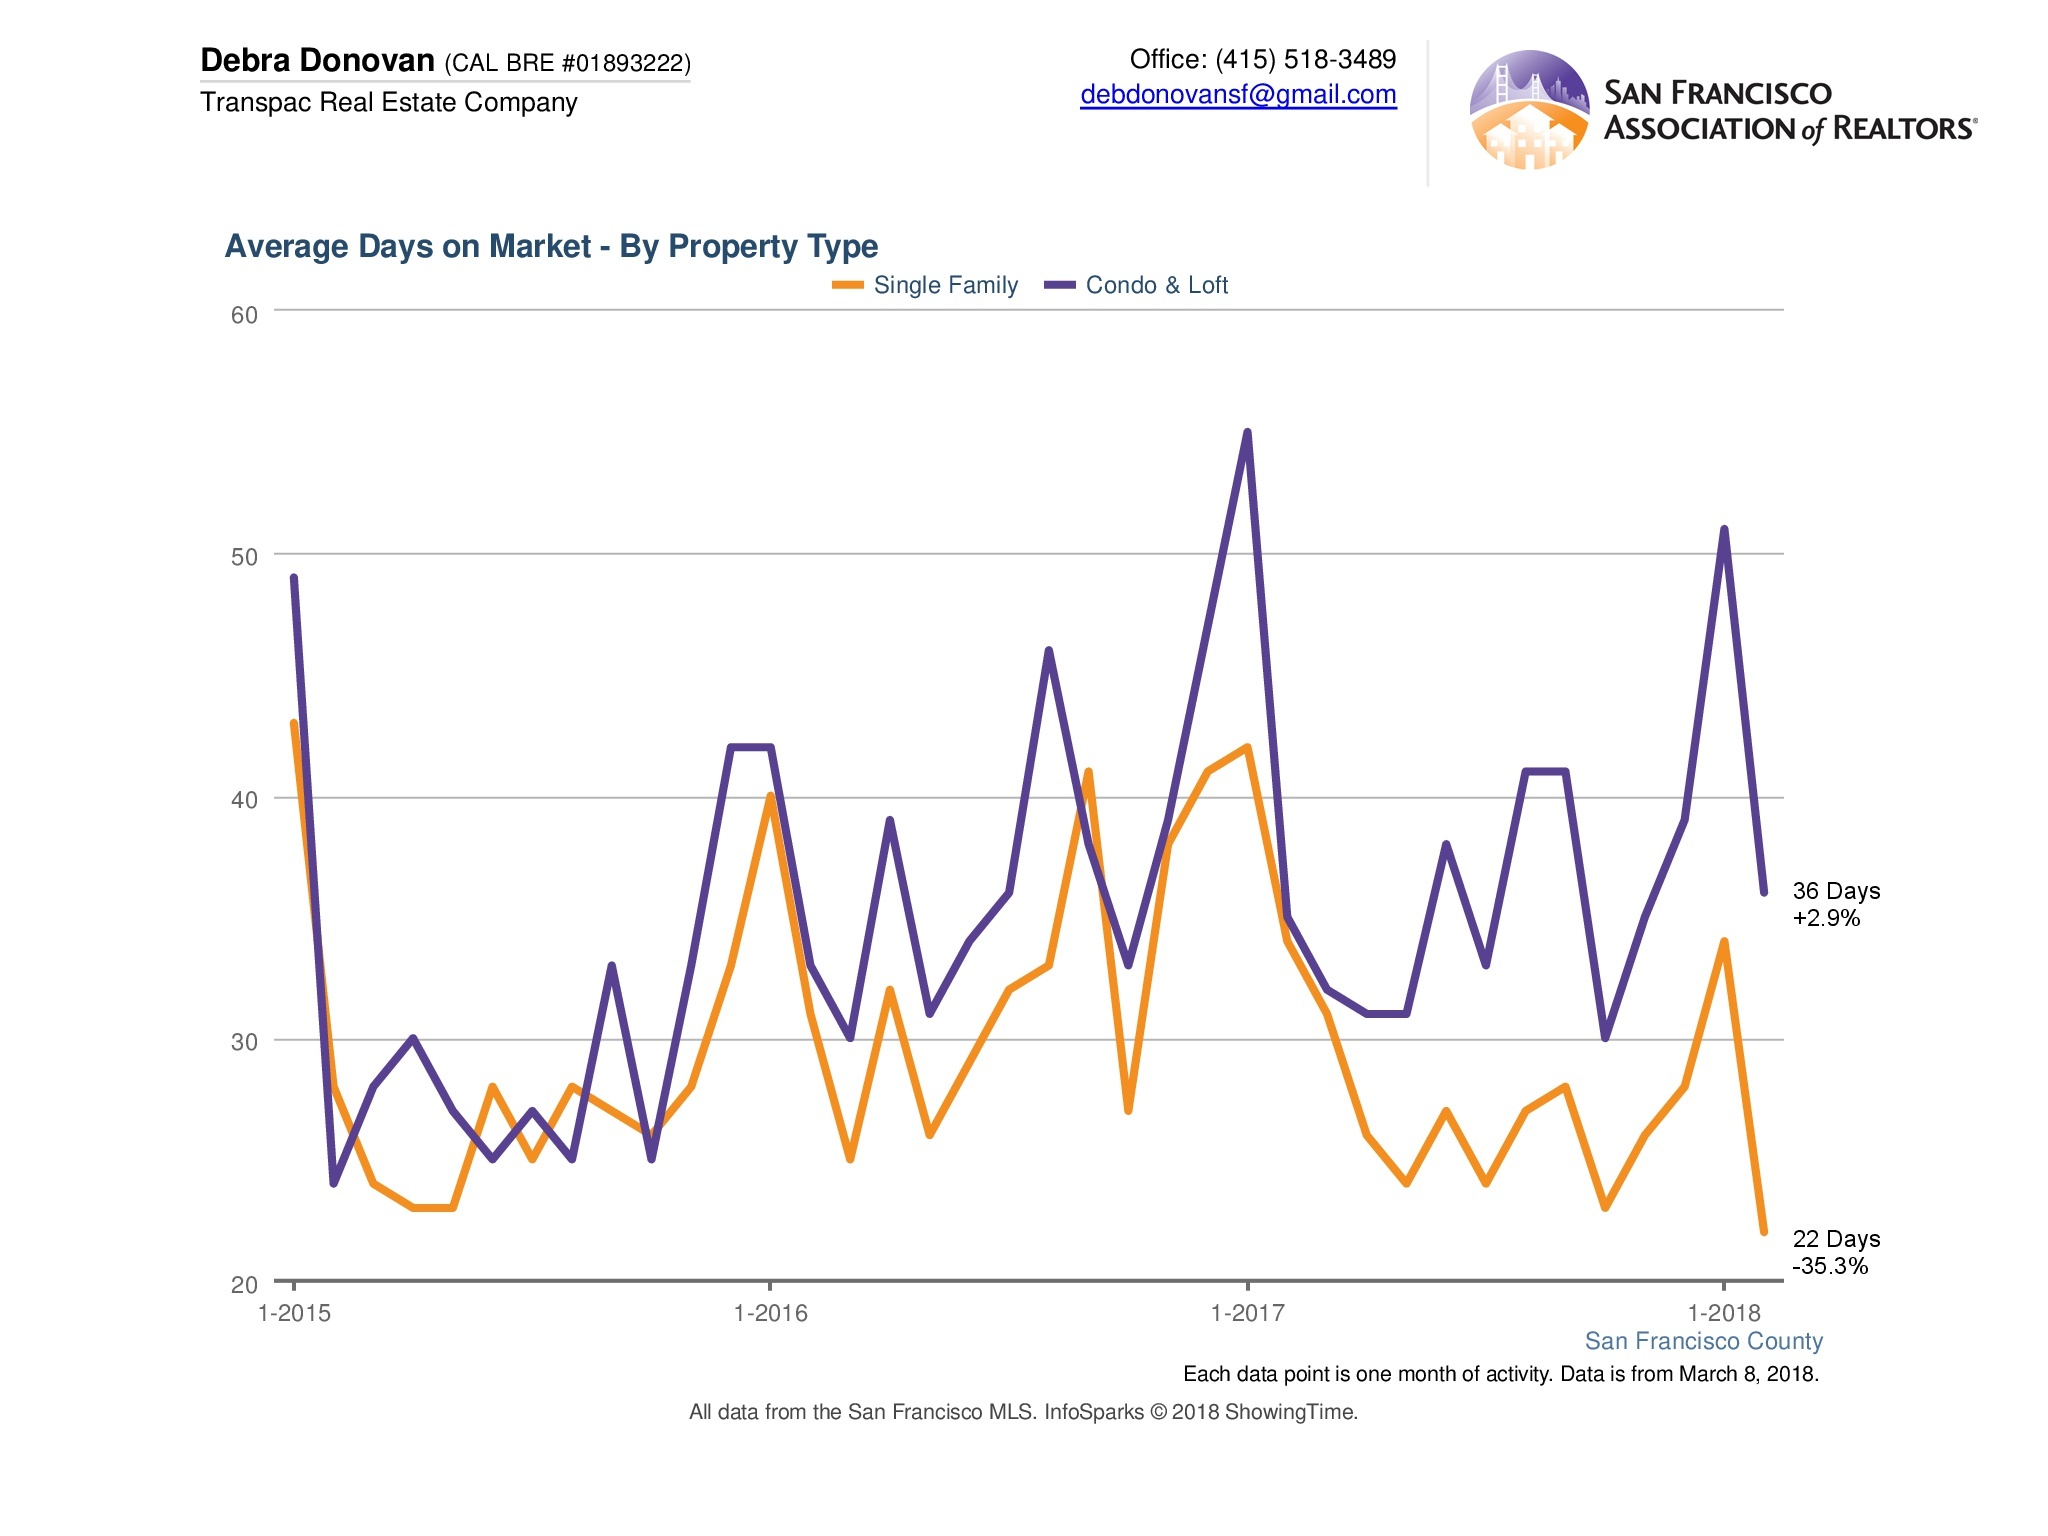
Single family homes sold in a zippy 22 days on average in February, a decrease of 35% compared to last year. Condos and lofts took slightly longer at 36 days, up 2.9% from last year.
The fine print: All information deemed reliable but not guaranteed or warranted. Data comes from MLS so does not include off-market and most new construction condo sales. The San Francisco real estate market is dynamic so statistics can change on a daily basis. These statistics are meant to be a snapshot of the day and time they were pulled.


