Q3 2022 San Francisco Real Estate Market
Rising interest rates and a volatile stock market shifted the San Francisco real estate market in the third quarter. Buyer demand waned as their spending power fell while interest rates rose. Seasonality may also have played a role because the summer months are typically slow.
Meanwhile home sales slowed a bit and properties took longer on the market to get into contract compared to the same quarter last year. Even so, we are still in sellers’ market territory here in San Francisco.
Median Price:
The median price for a single family home slipped almost 9% percent in the 3rd quarter compared to the same quarter last year. Condo prices dropped 5% to $1,147,500.

New Listings:
New listings for single family homes and condos were also down for the quarter. There were fewer than 850 new single family home listings in Q3, down 16%. Fewer than 1100 condos came on the market in Q3, down 22.7%.

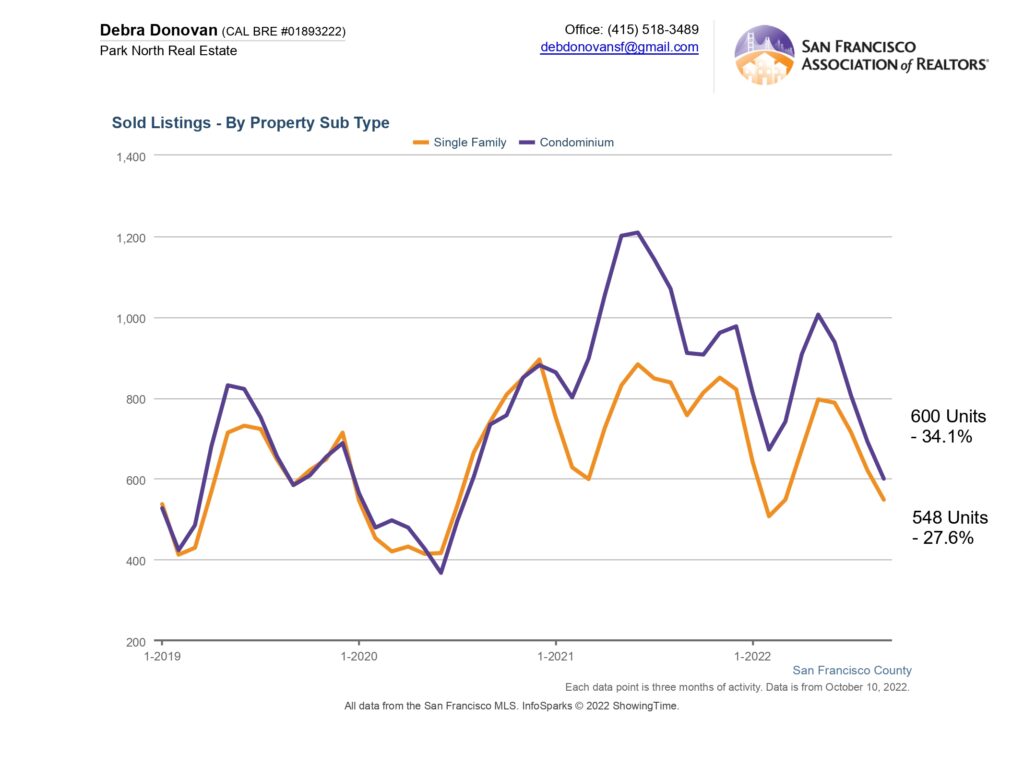
Sold Listings:
Sold listings decreased for both single family homes and condos. Single family home sales were down about 28% while condos sales were down 34%.
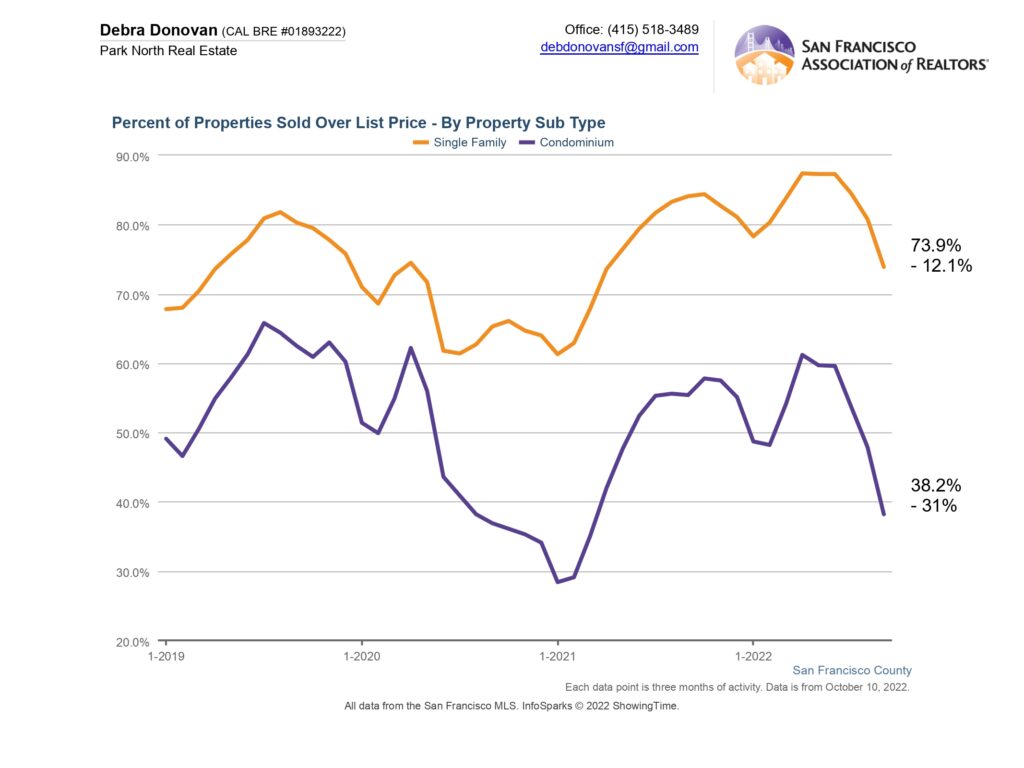
Percentage of Properties Sold Over List Price:
As demand slows and home options for buyers pick up, we are seeing fewer bidding wars for properties, resulting in the percentage of properties selling over their list price to decrease. Just 74% of single family homes sold for over their asking price, down 12% compared to the 3rd quarter 2021. Just 38% of condos sold for over their list price, down over 30%. Seasonality can play a role in this as the summer is typically quieter.
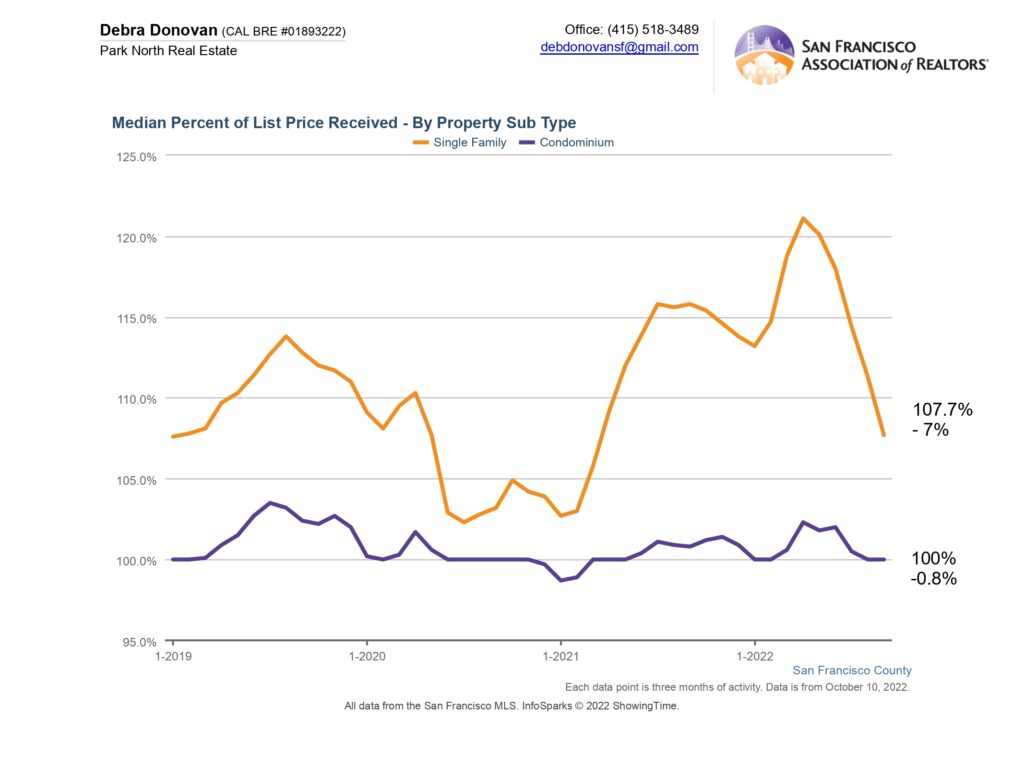
Average Percentage of List Price Received:
The average percentage of list price received in the third quarter for single family homes was 107.7%, down 7% compared to last year’s third quarter. Condos sold on average 100% of their list price, down less than 1% of what they sold for in 2021.
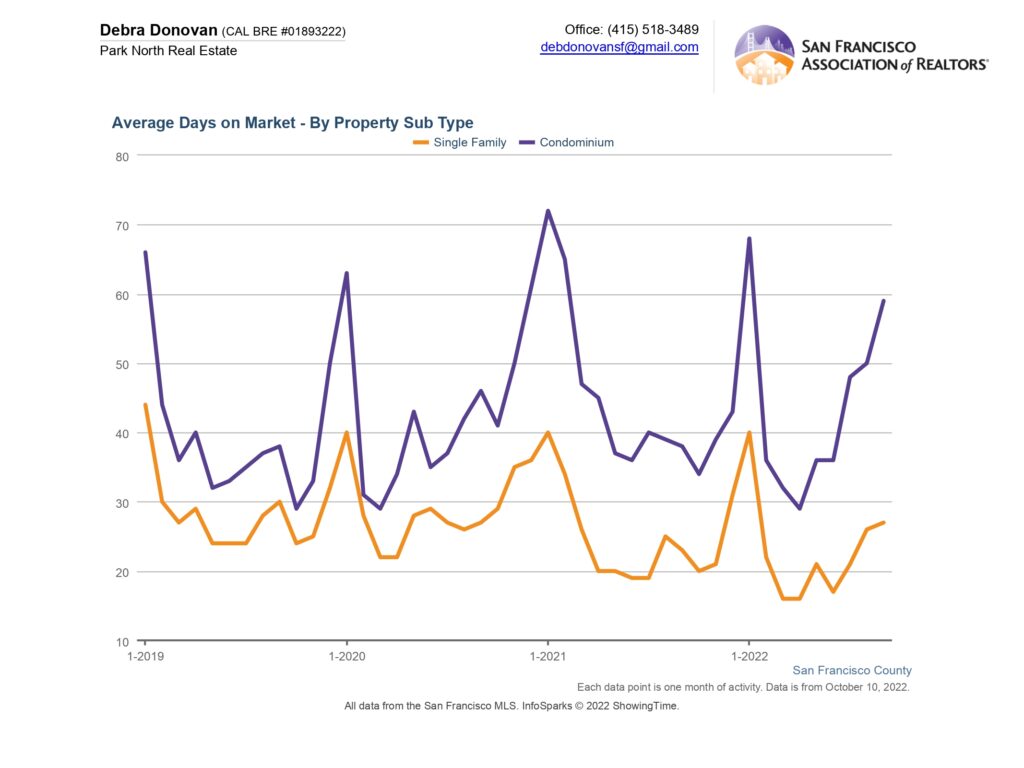
Average Days on Market:
Another indication of the slowing market is homes staying on market longer before accepting an offer. Single family homes spent an average of 25 days on the market in the third quarter, up almost 14% compared to Q3 2021. Condos averaged 52 days on the market, up a third compared to last year.
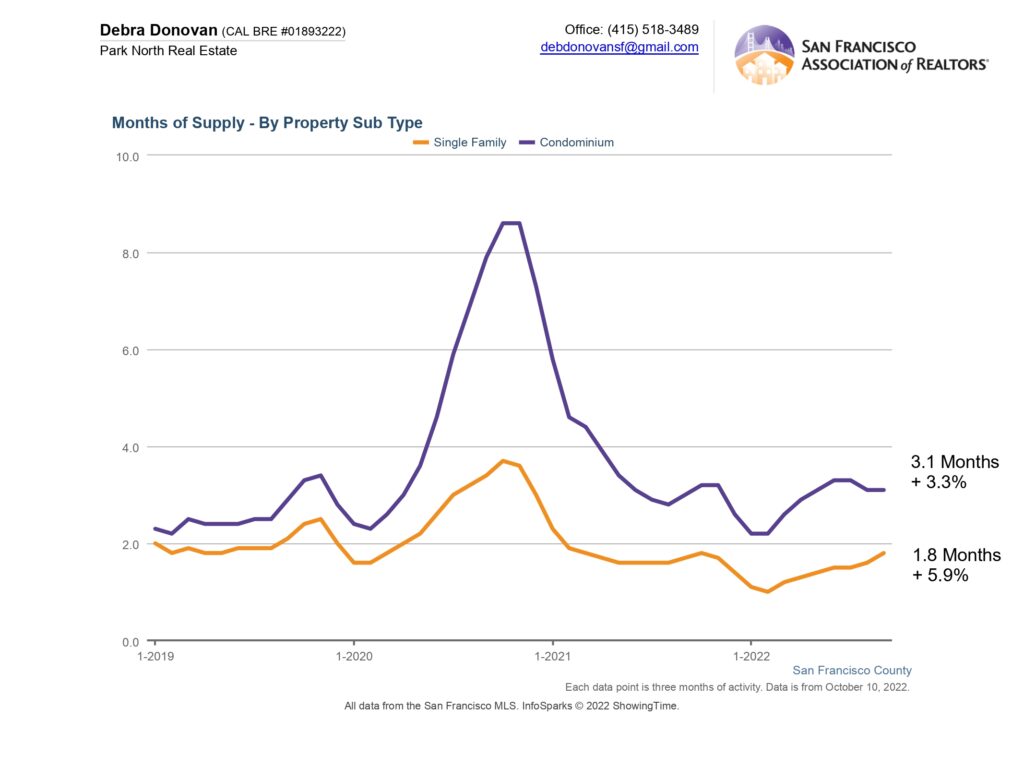
Months Supply of Inventory:
While the months supply of inventory, which illustrates how long it would take for the existing homes to sell through based on current demand, has increased for both single family homes and condos, it remained in seller market territory in the 3rd quarter.
The fine print: All information deemed reliable but not guaranteed or warranted. Data comes from the MLS so does not include off-market and most new construction condo sales. The Bay Area real estate market is dynamic so statistics can change on a daily basis. These statistics are meant to be a snapshot of the day and time they were pulled.