December 2021
November 2021 was very different from November 2020. In 2020, Covid and the ensuing lock downs in March meant that there wasn’t a very brisk Spring season for San Francisco real estate. While there were still buyers buying and sellers selling, many chose to wait it out. By July inventory started to rise, and by November there was 4-1/2 months of single family home supply and 10 months of condo inventory!
I mention this to help put into perspective the data below. While the San Francisco real estate market continued to experience a very healthy year so far, comparing data from 2020 month to month is a bit skewed as typical seasons were off in 2020.
Median Sales Price:
The median sales price for a single family home grew 17% year-over-year to $1,900,000 in November. The median price for a condo in San Francisco grew almost 8% to $1,290,000. For both types of properties, the biggest gains were in the higher end of the market, above $1,750,000.

New Listings:
New listings were down significantly for both single family homes and condos in November. Again, this is due to the off year on seasonality in 2020. New single family home listings were down over 50%, while new condo listings were down 30%.
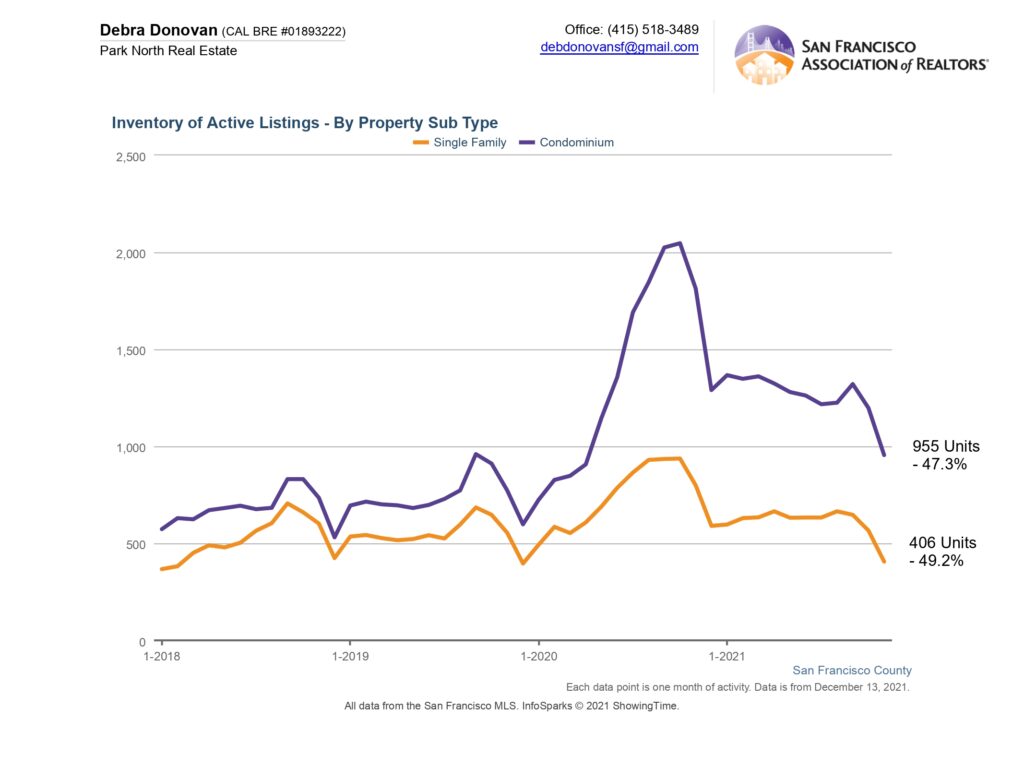
 Active Listings:
Active listings, listings that remain on the market at the end of a given month, were also down for both single family homes and condos in November. This speaks both to the inventory shortage that we continue to experience, as well as that there were so many listings on the market in general in November 2020. Active listings for single family homes were down 49% while condos were down 47% year-over-year.
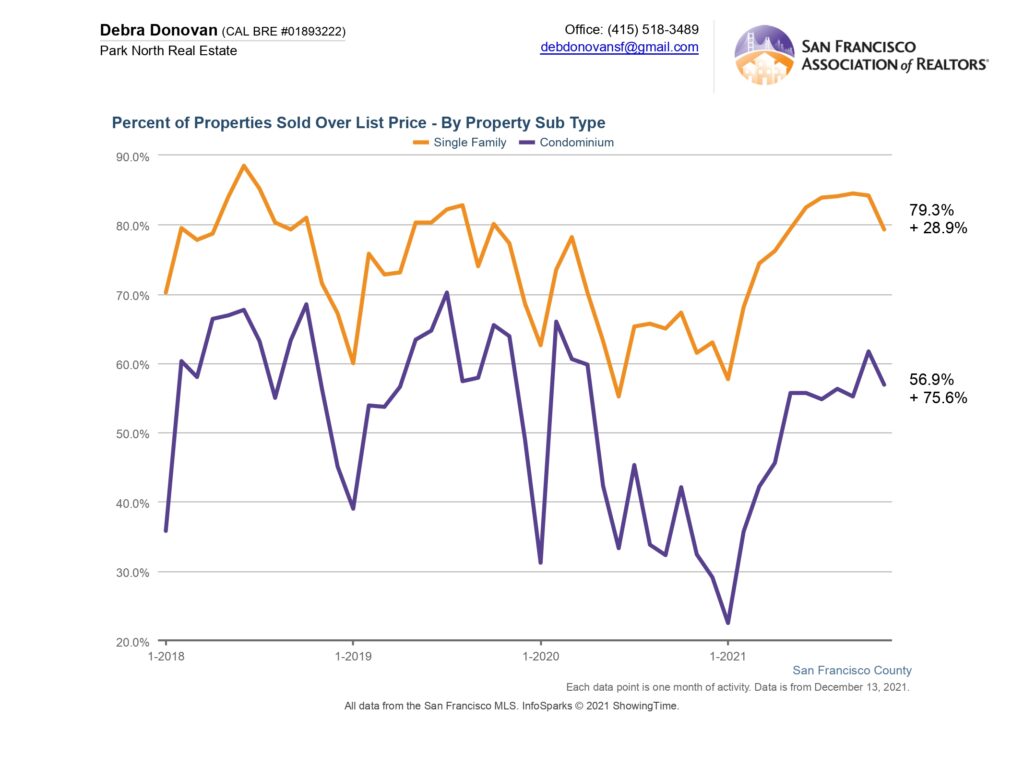
Percentage of Properties Sold Over List Price:
Since January of 2021 there has been a steady rise in the number of properties sold over list price. Over 79% of single family homes sold for over their list price in November, a 29% increase year-over-year. Almost 57% of condos sold for more than their asking price, up over 75% compared to November last year.
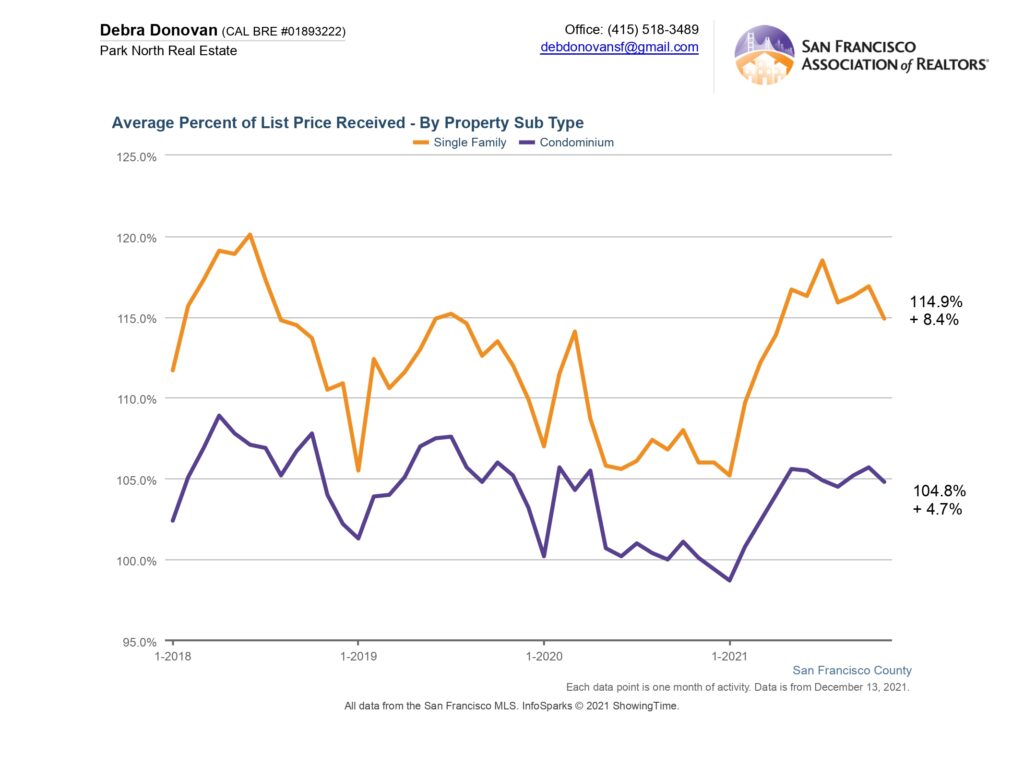
Average Percentage of List Price Received:
Single family homes sold for an average of almost 115% in November, an over 8% increase compared to the same month last year. Condos sold for an average of almost 105%, up almost 5% year-over-year.
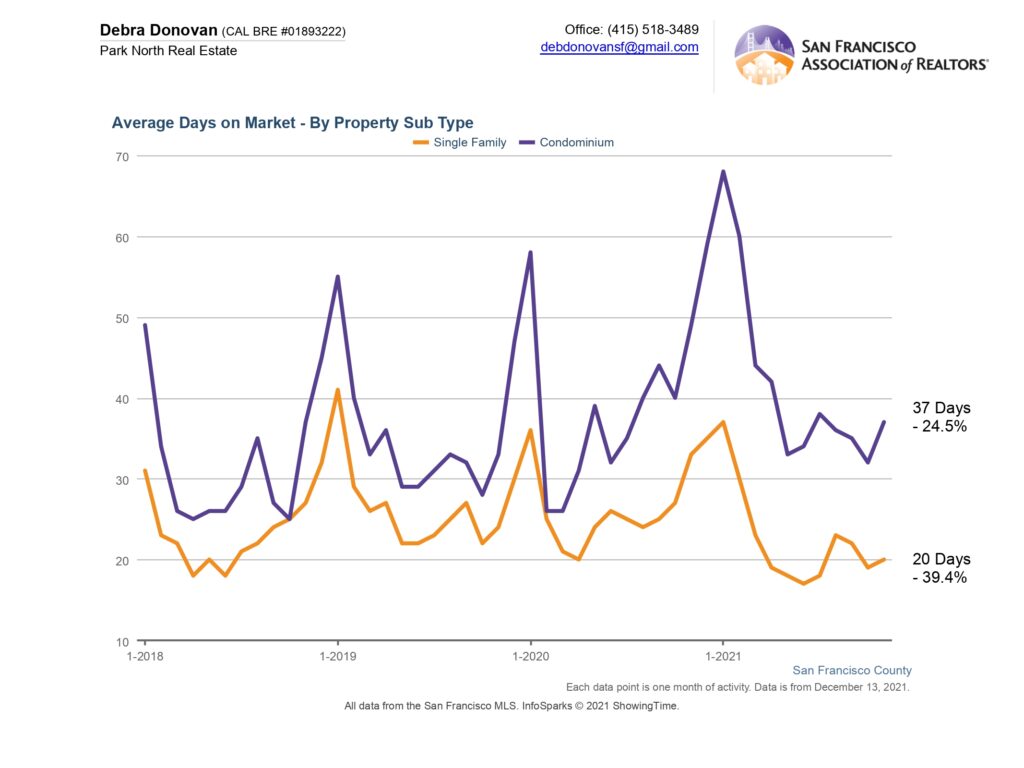
Average Days on Market:
Single family homes spent an average of 20 days on the market before accepting an offer, down over 39% year-over-year. Condos spent an average of 37 days on the market, down almost 25%
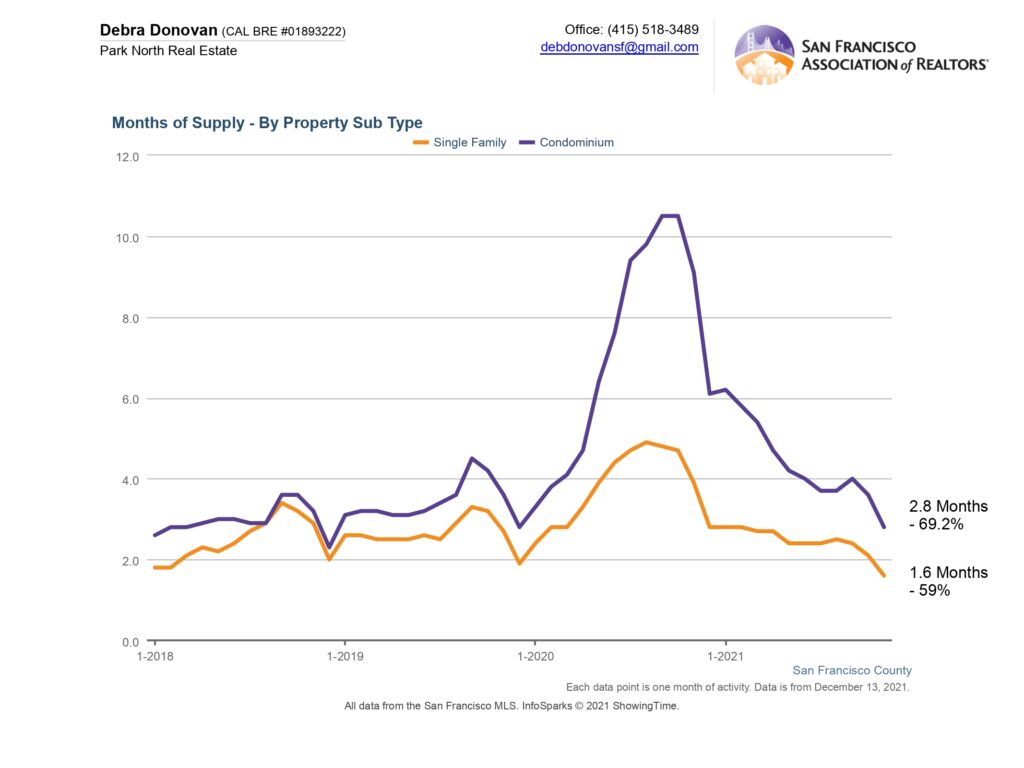
Months Supply of Inventory:
Given the difference in inventory this November when compared to November 2020, it’s no surprise that it’s fallen precipitously year-over-year. Single family homes had just 1.6 months of inventory in November, down 59%. Condos had less than 3 months of inventory, down over 69%.
The fine print: All information deemed reliable but not guaranteed or warranted. Data comes from the MLS so does not include off-market and most new construction condo sales. The Bay Area real estate market is dynamic so statistics can change on a daily basis. These statistics are meant to be a snapshot of the day and time they were pulled.