Home prices remained restrained and inventory scarce through the first half of 2023. It’s important to keep in mind for context that the first half of 2022 was exceptional, with prices soaring higher and higher. What we’ve seen for the first half of 2023 is median prices closer to pre-pandemic prices. How long that will continue remains to be seen. We also have record lows of new inventory. As interest rates continue to rise, it can seem impractical for homeowners to sell if they bought or refinanced in previous years and now enjoy a very low interest rate. So up-sizers and down-sizers alike are choosing to either stay put or rent their current home instead of selling it as is more the norm. And yet, in spite of all fo the doom and gloom you’ve been reading, there are many anecdotal stories of homes selling well over list price with many multiple offers recently.
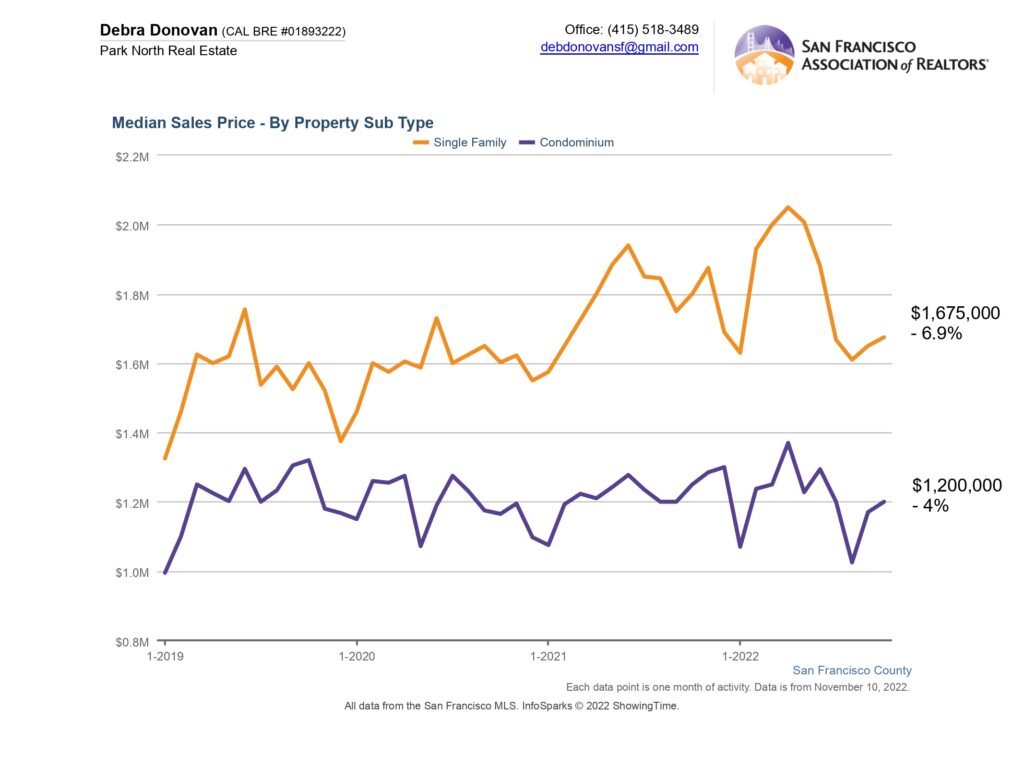
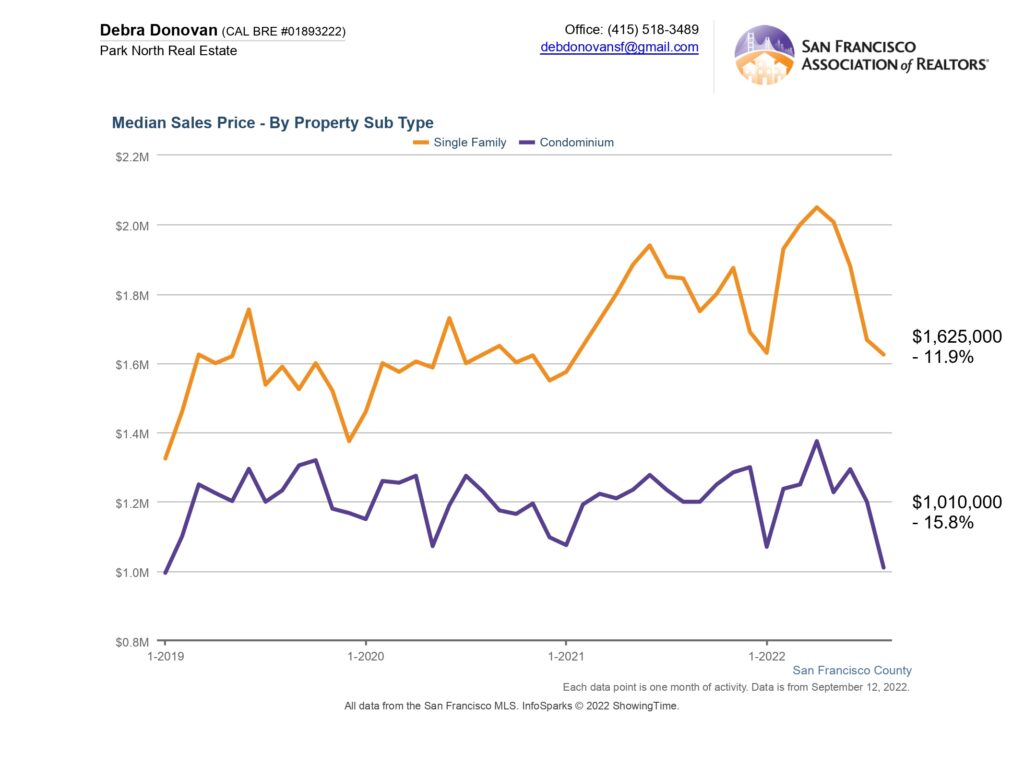
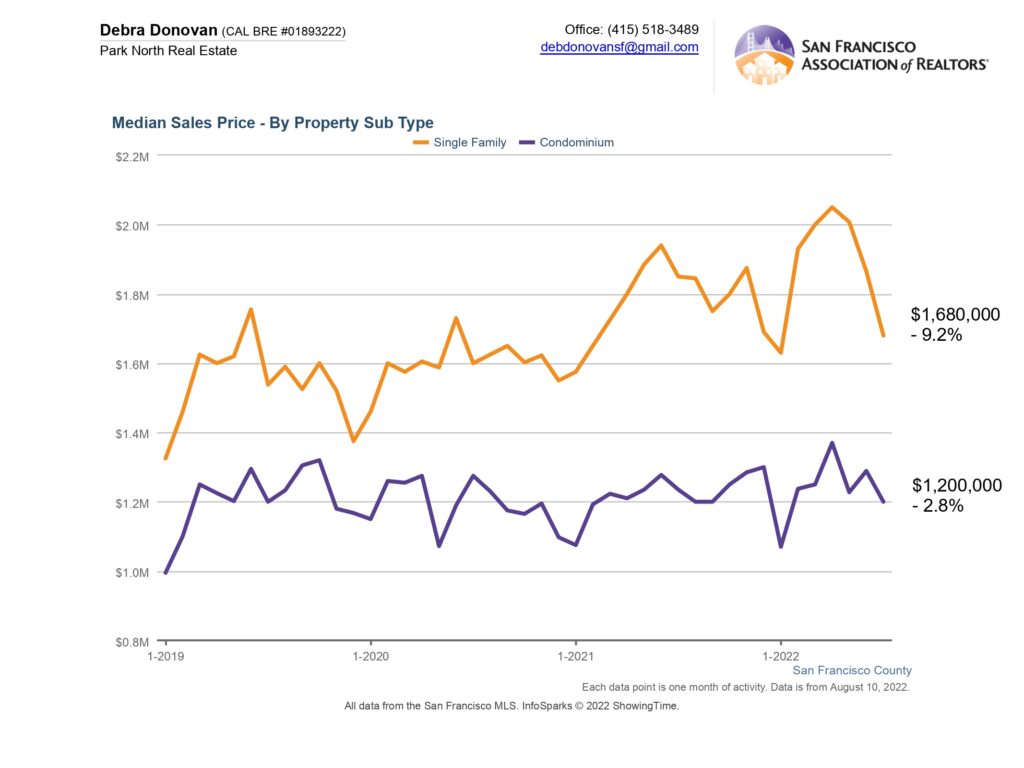
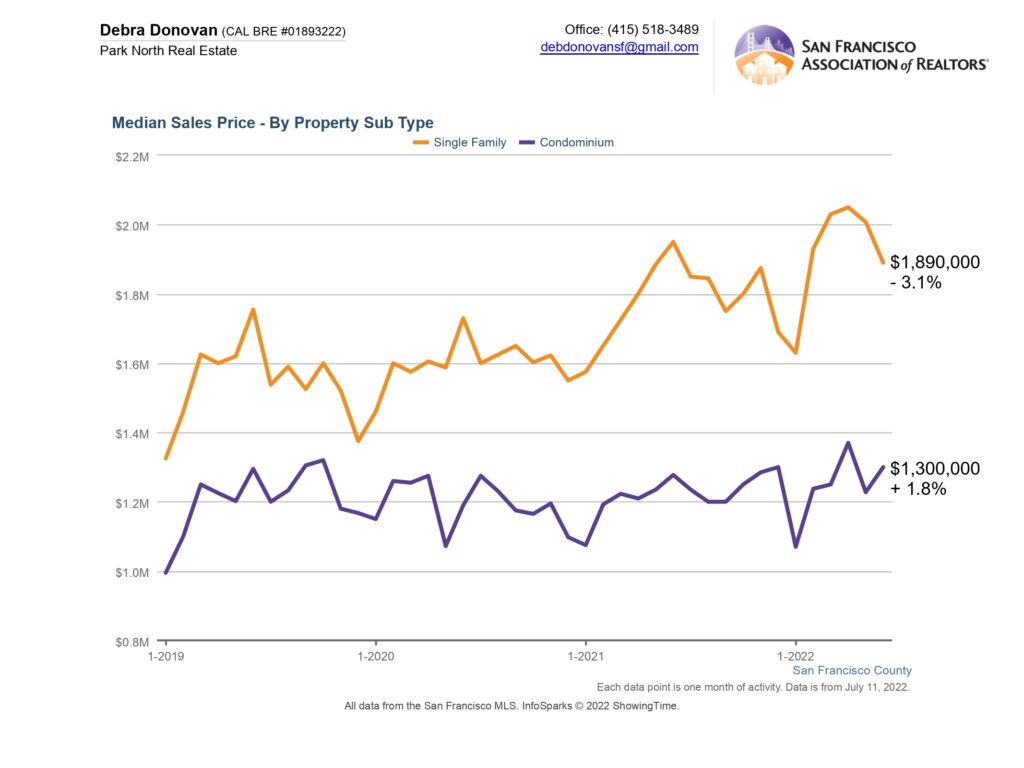
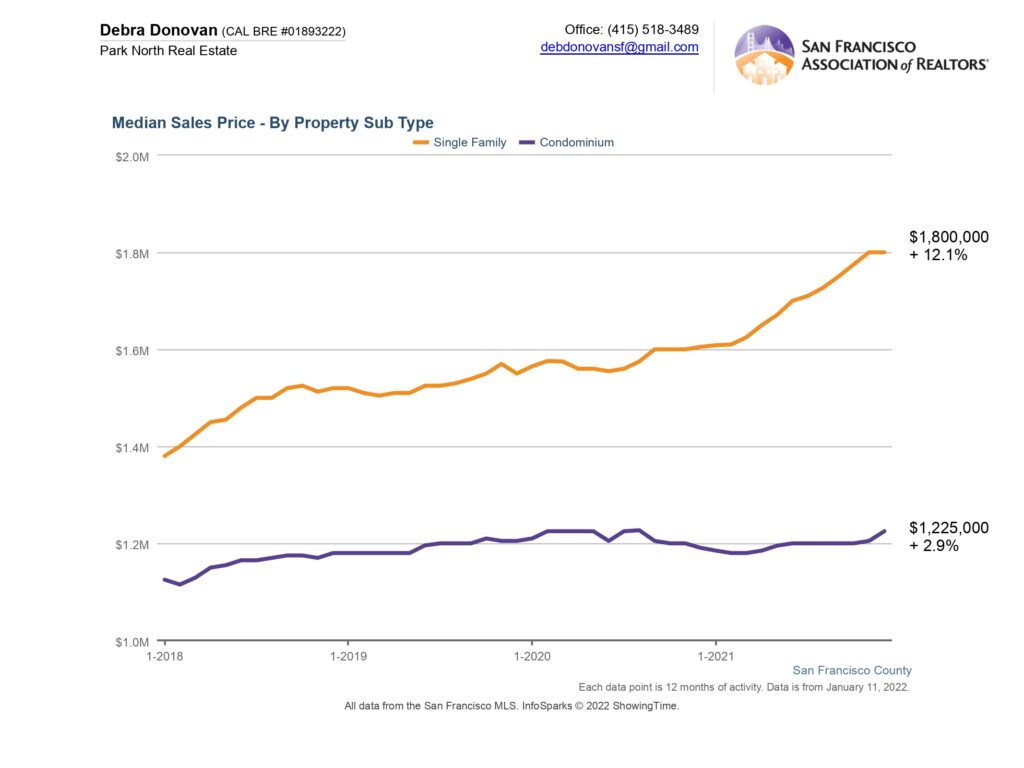
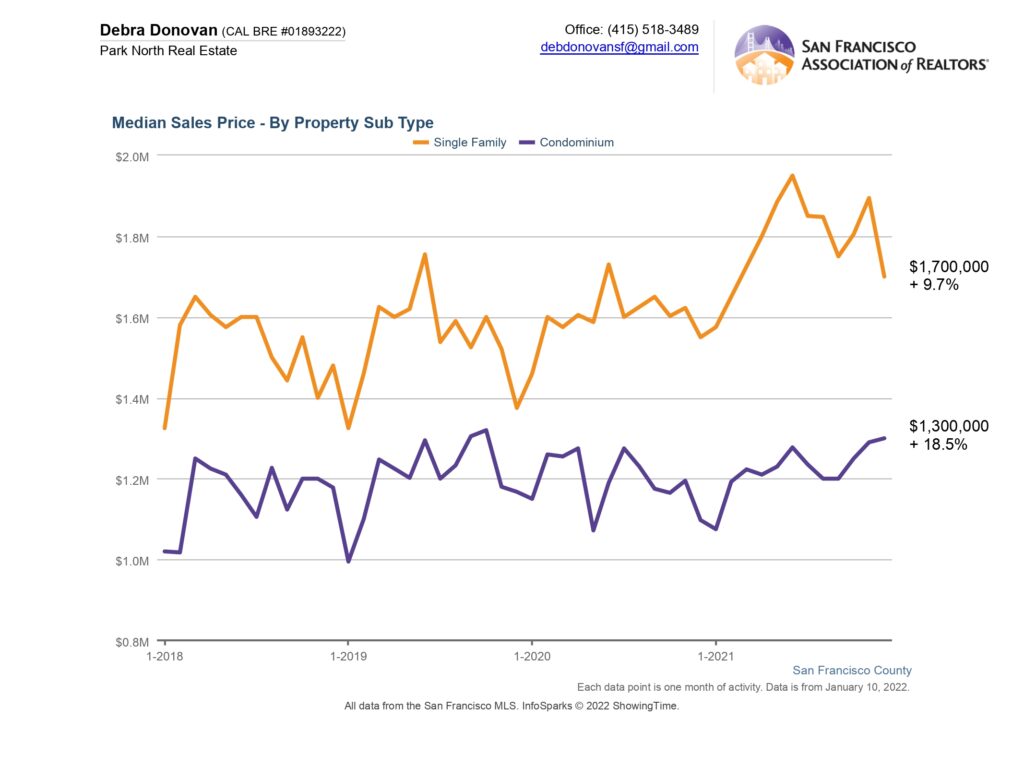
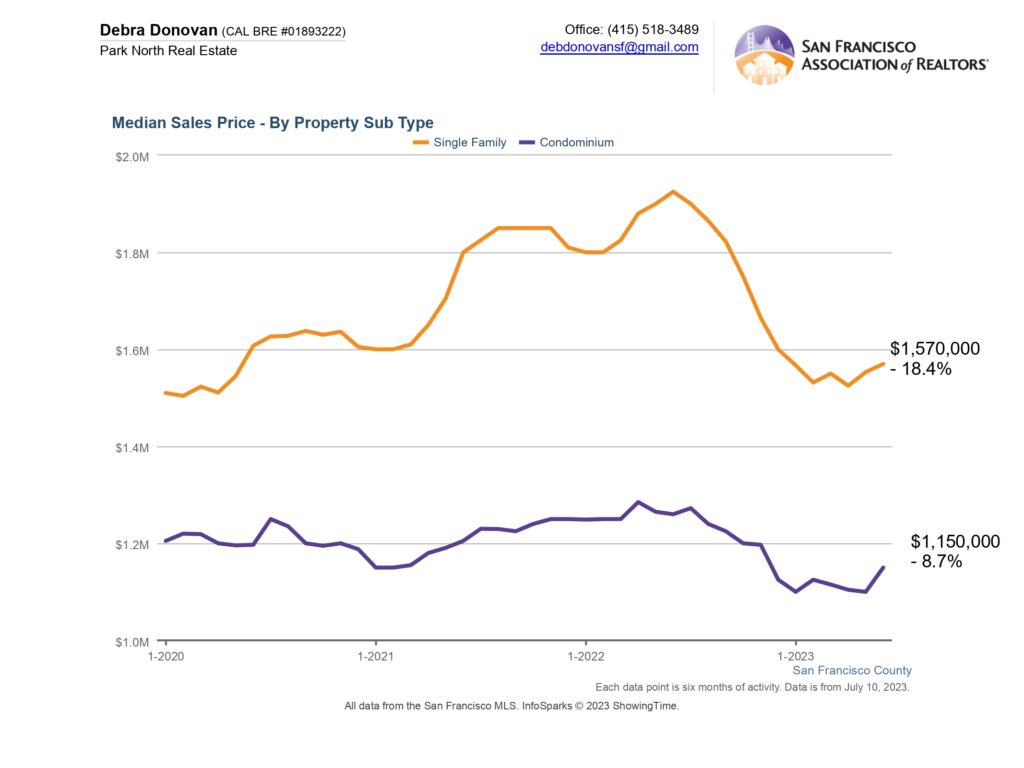
Median Price:
Median prices for the first half of 2023 were down double-digits for both single family homes and condos. Single family homes saw an over 18% decrease to $1,570,000 while condo prices dropped almost 9% to $1,150,000
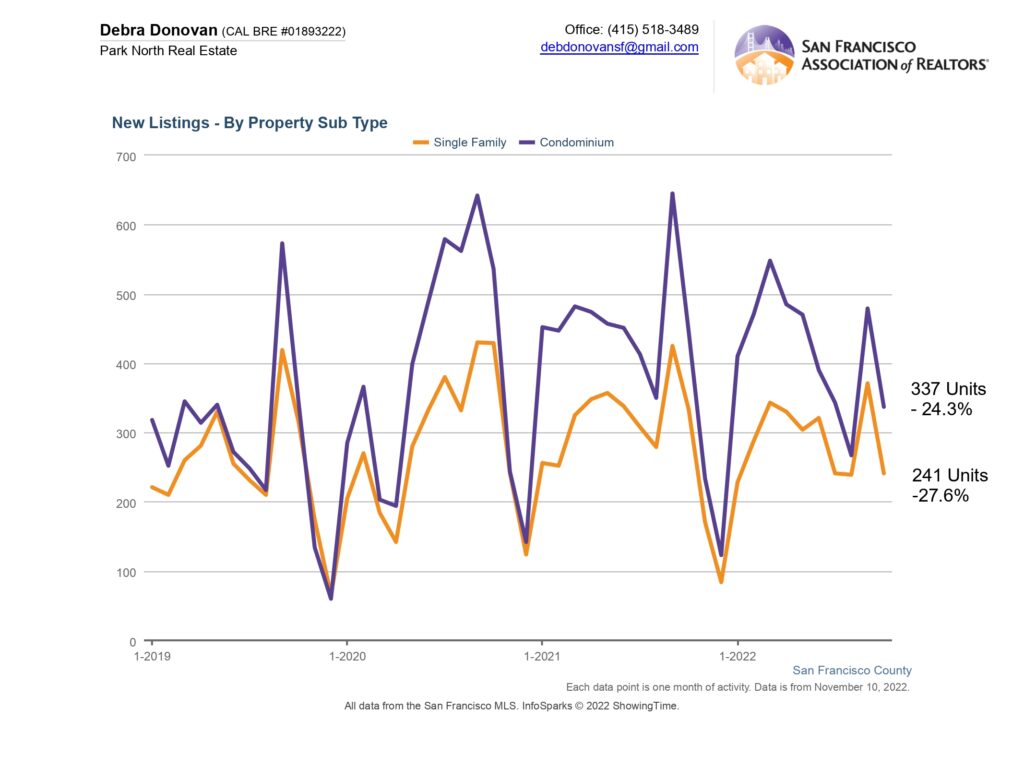
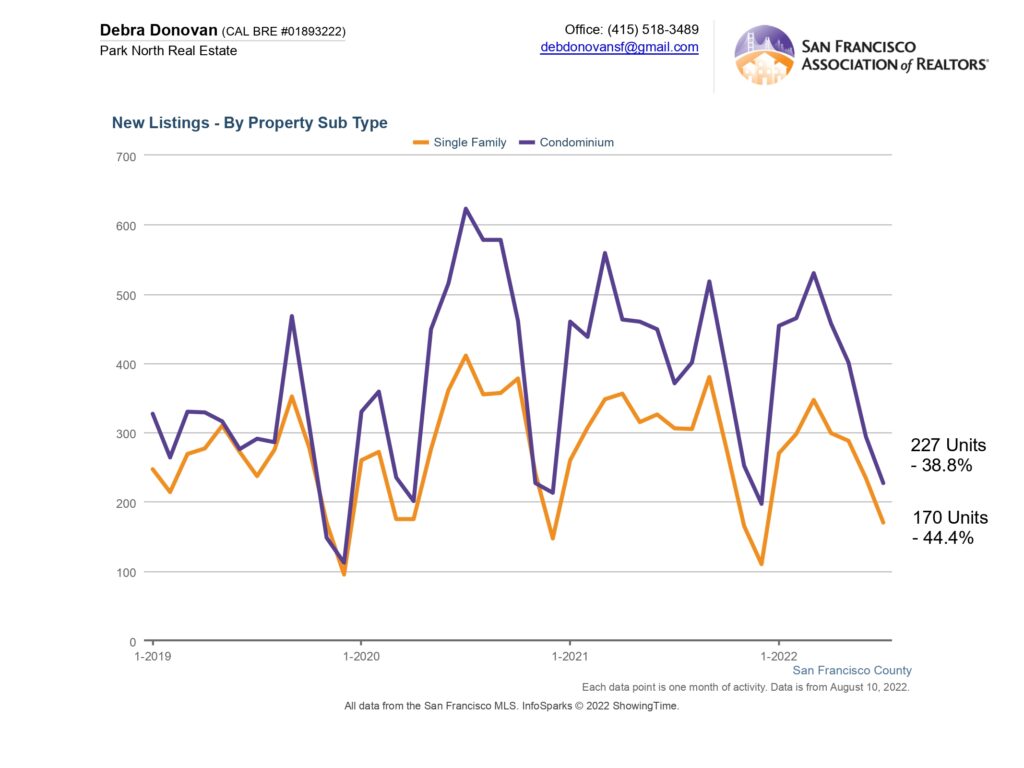
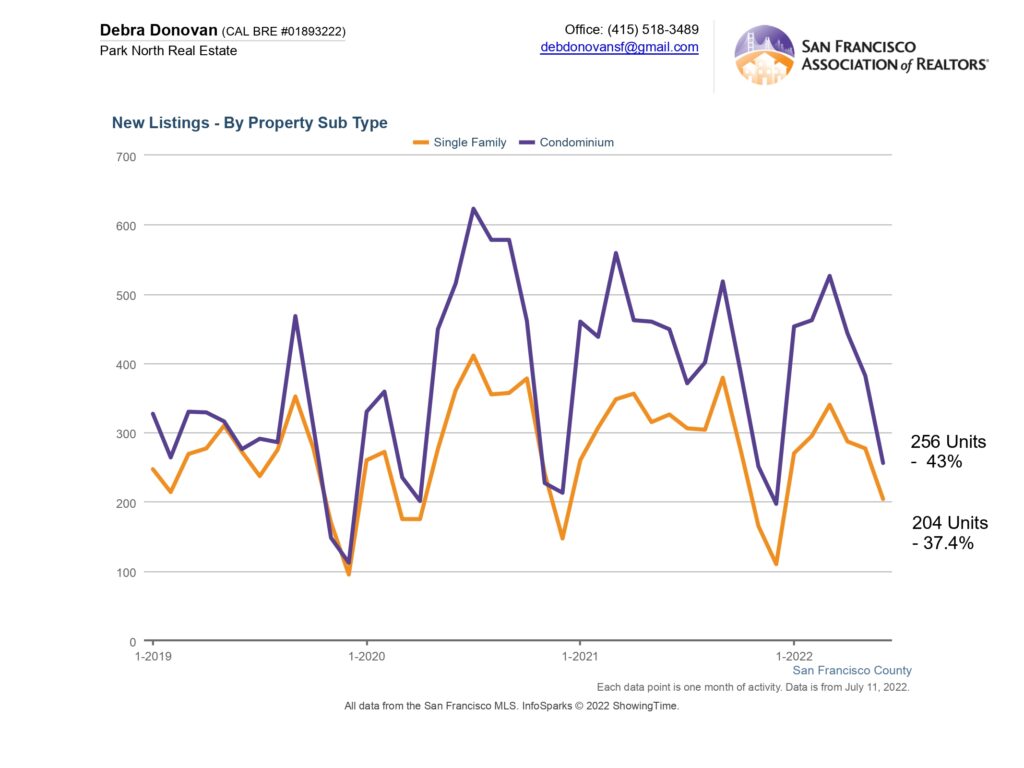
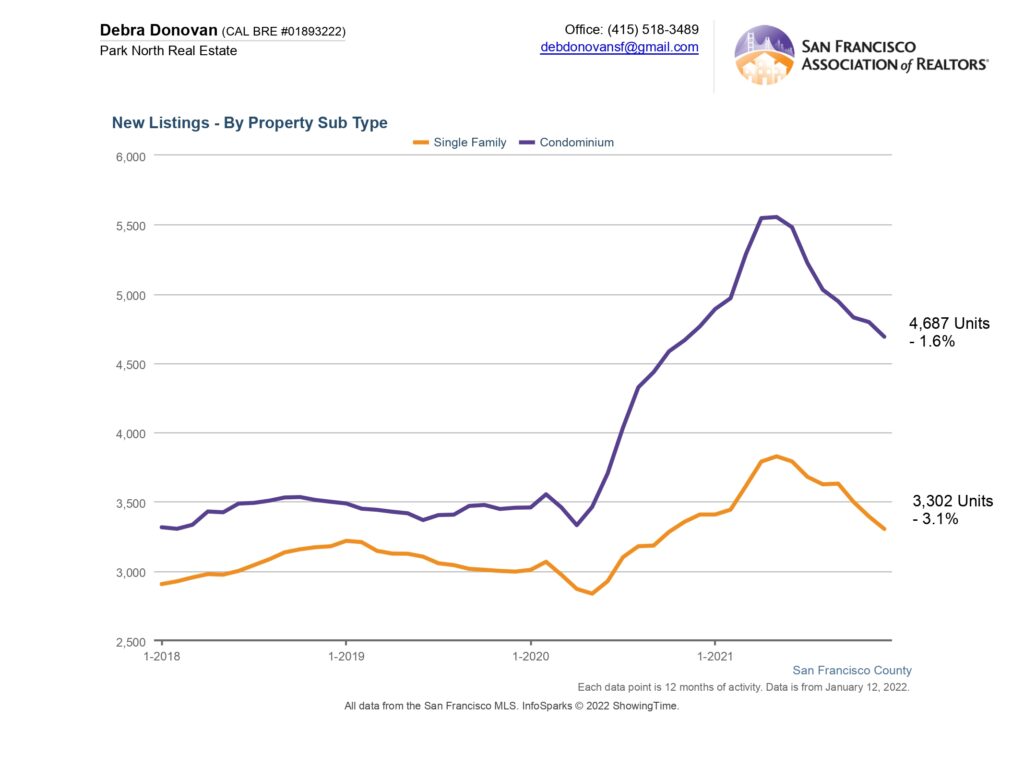
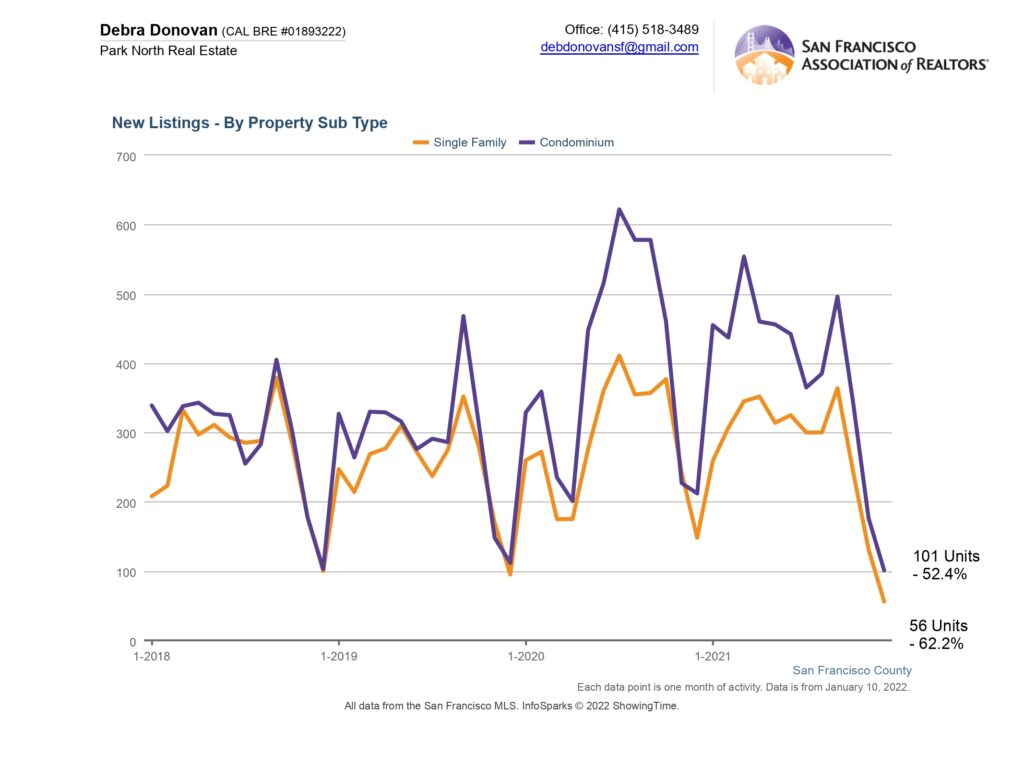
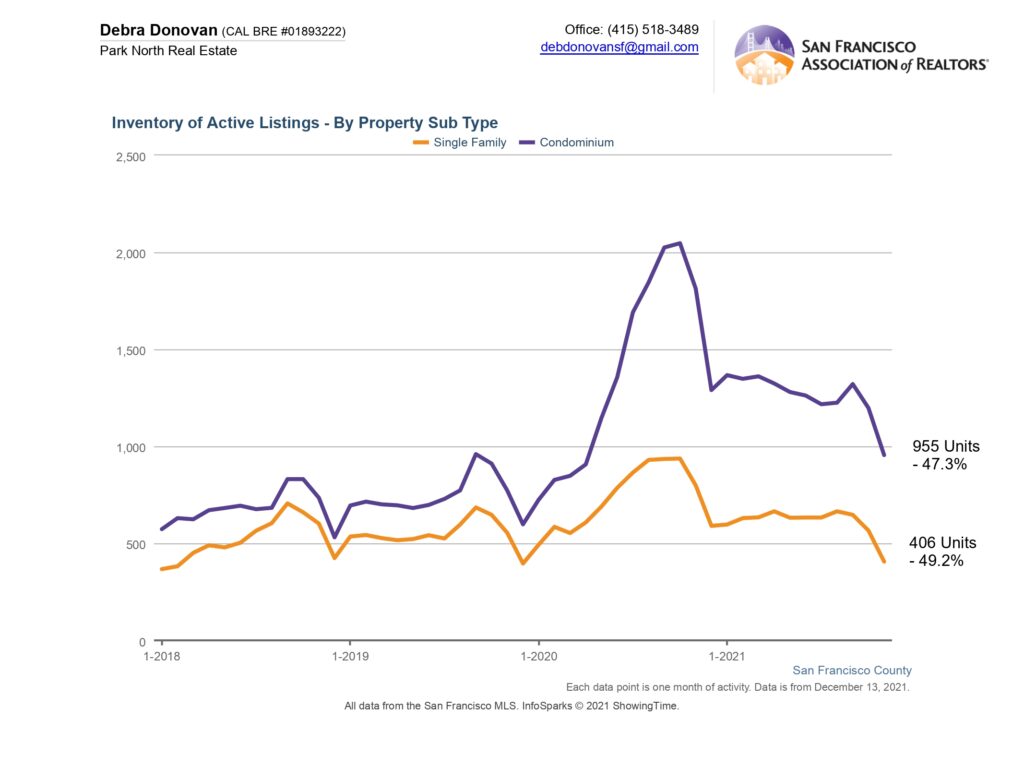
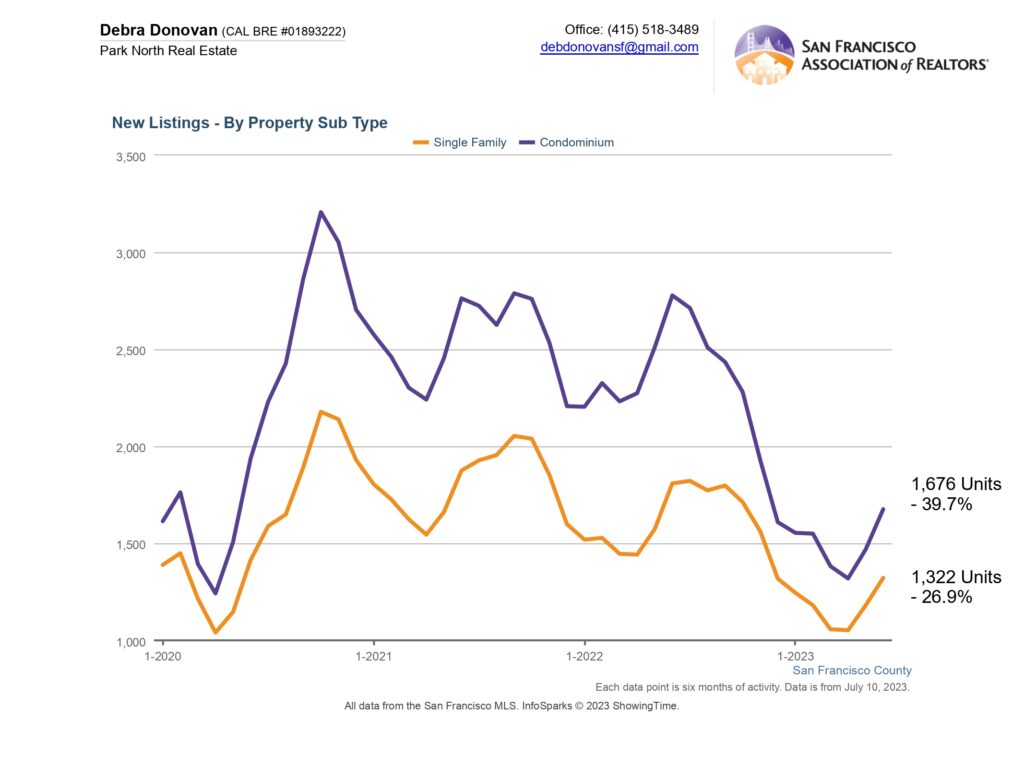
New Listings:
As discussed above, new inventory has been quite anemic. New single family home listings were down 27% during the first half of the year when compared to the same time frame last year. New condo listings were down almost 40%.
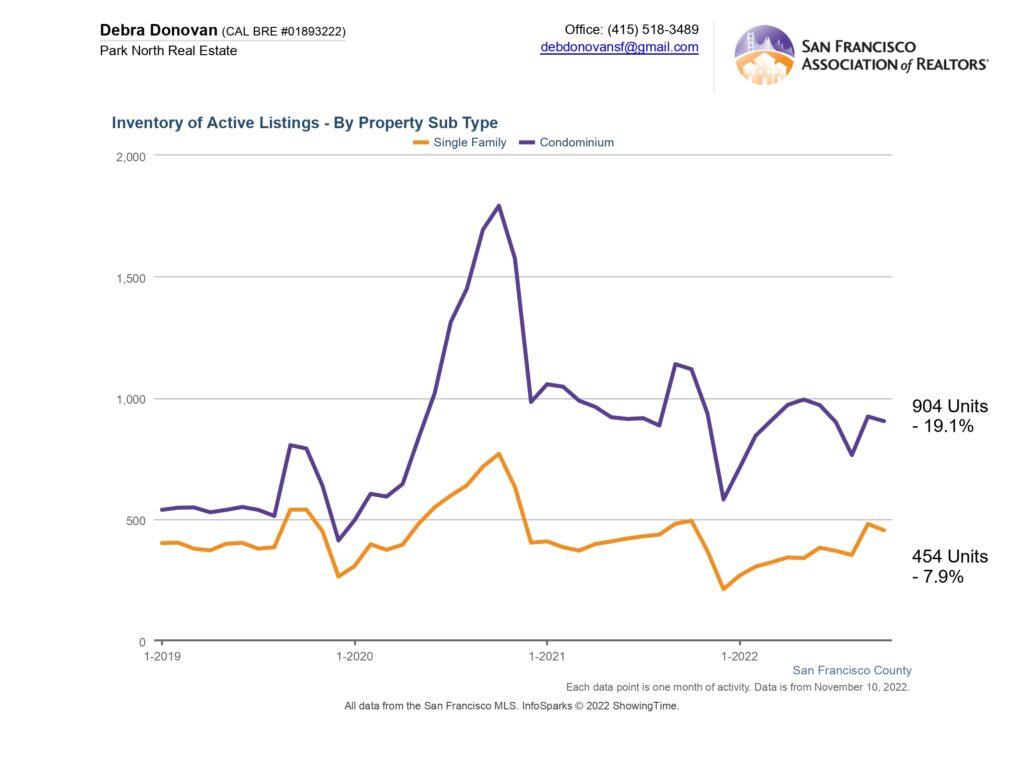
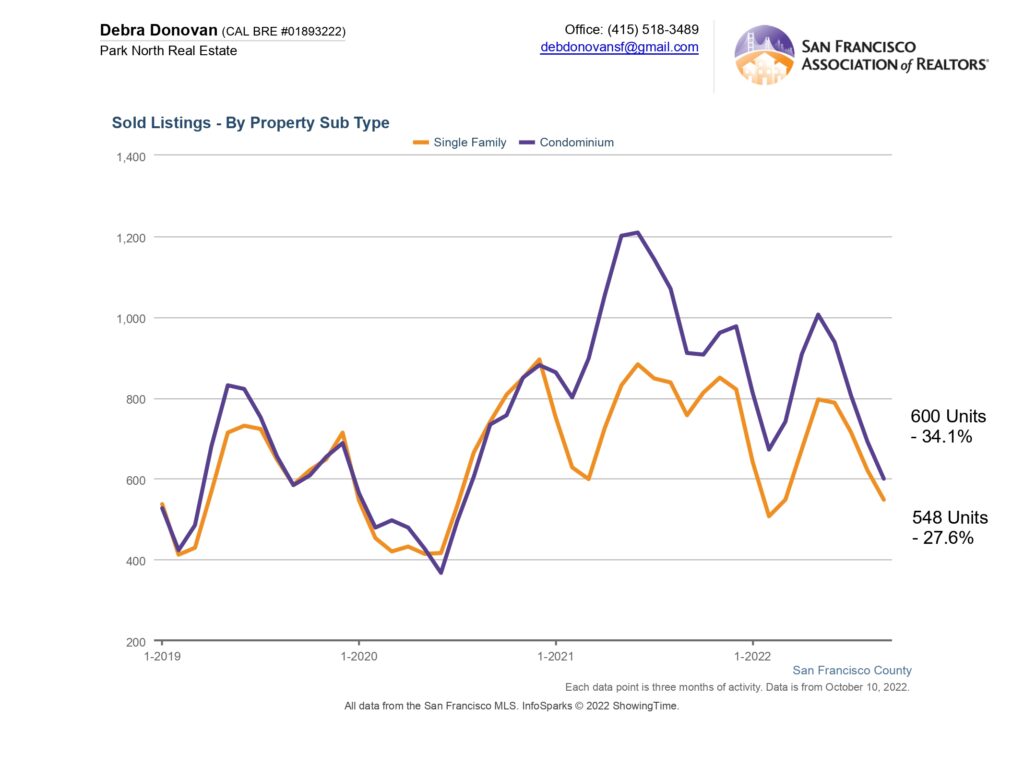
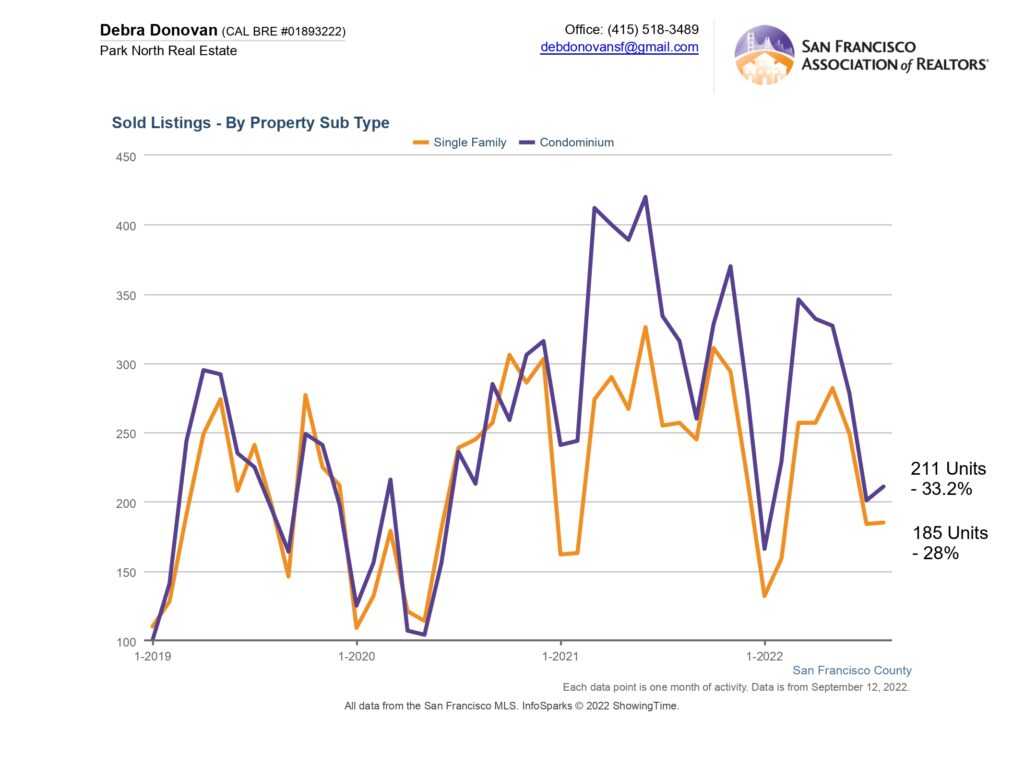
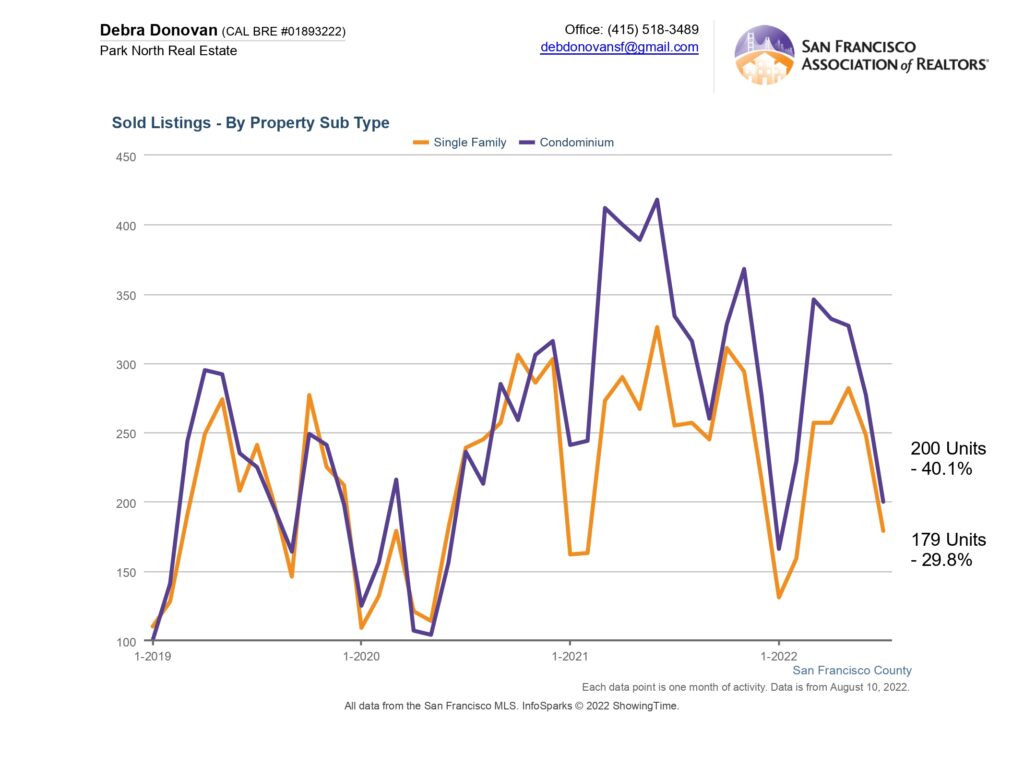
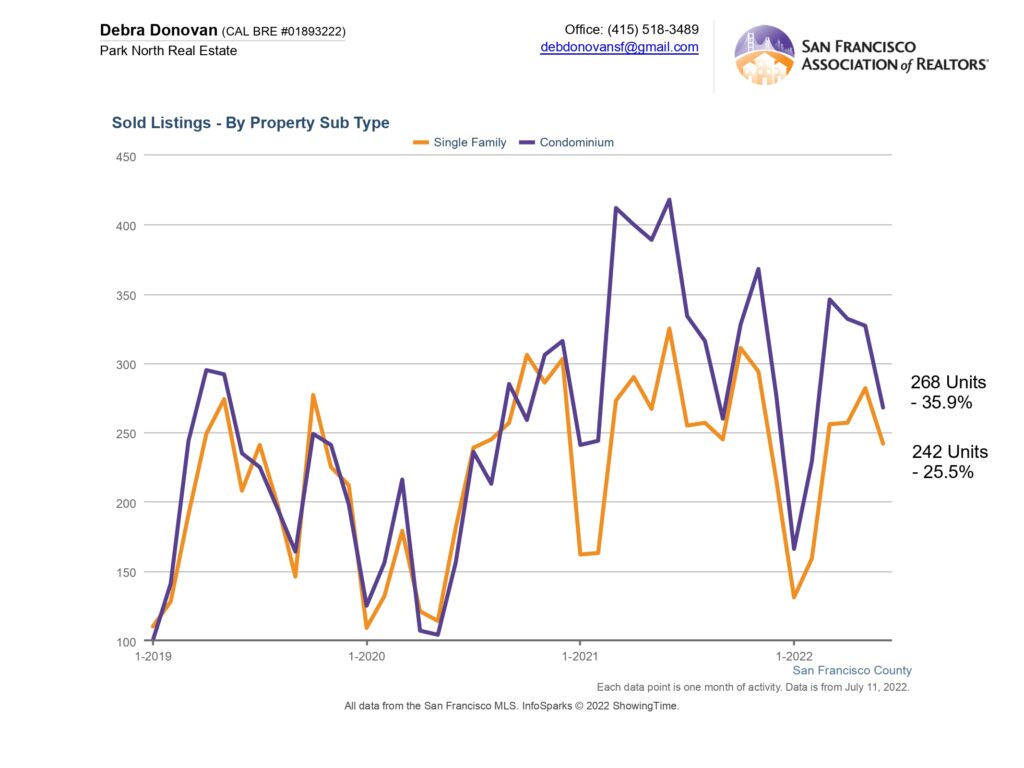
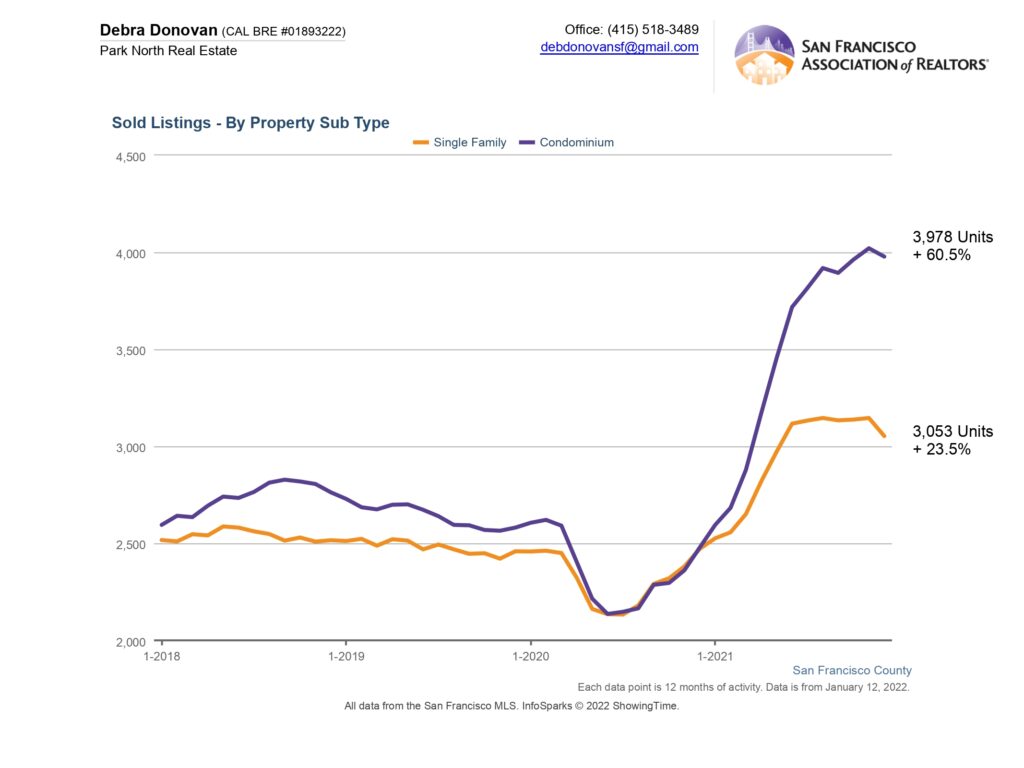
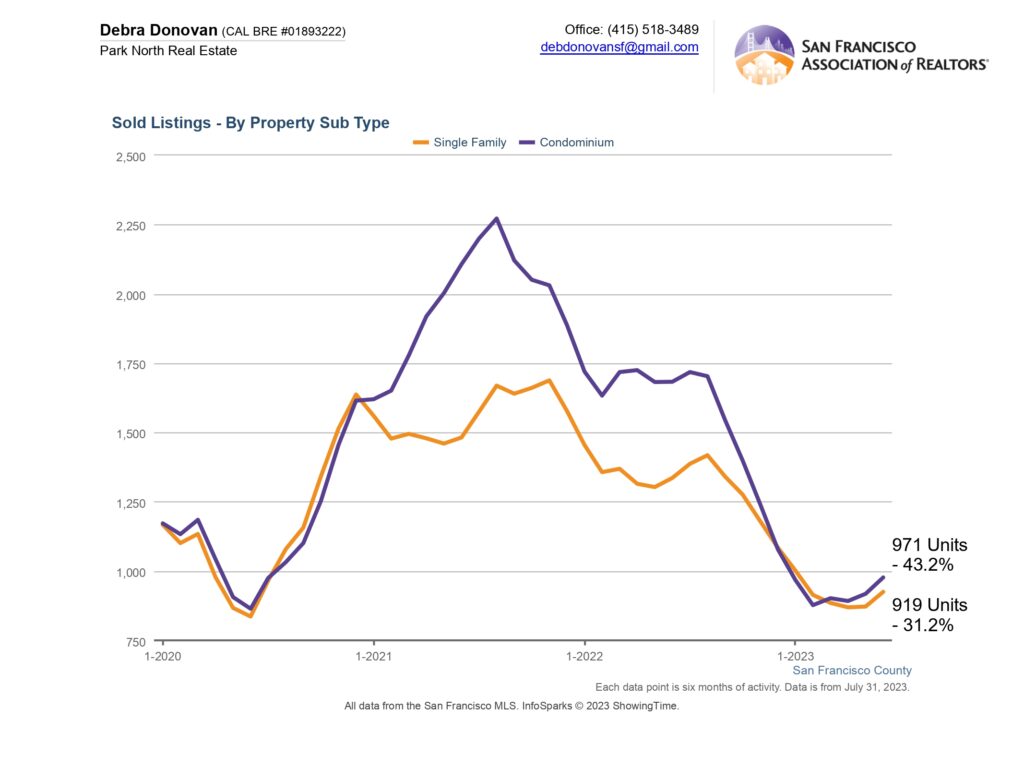
Sold Listings:
Due to lack of listings, the number of listings sold over the 1st half of 2023 was down significantly for both single family homes and condos. Single family home sold listings were down 32.2%, from 1,336 sold in the first half of 2022 to just 919 sold over the same period this year.
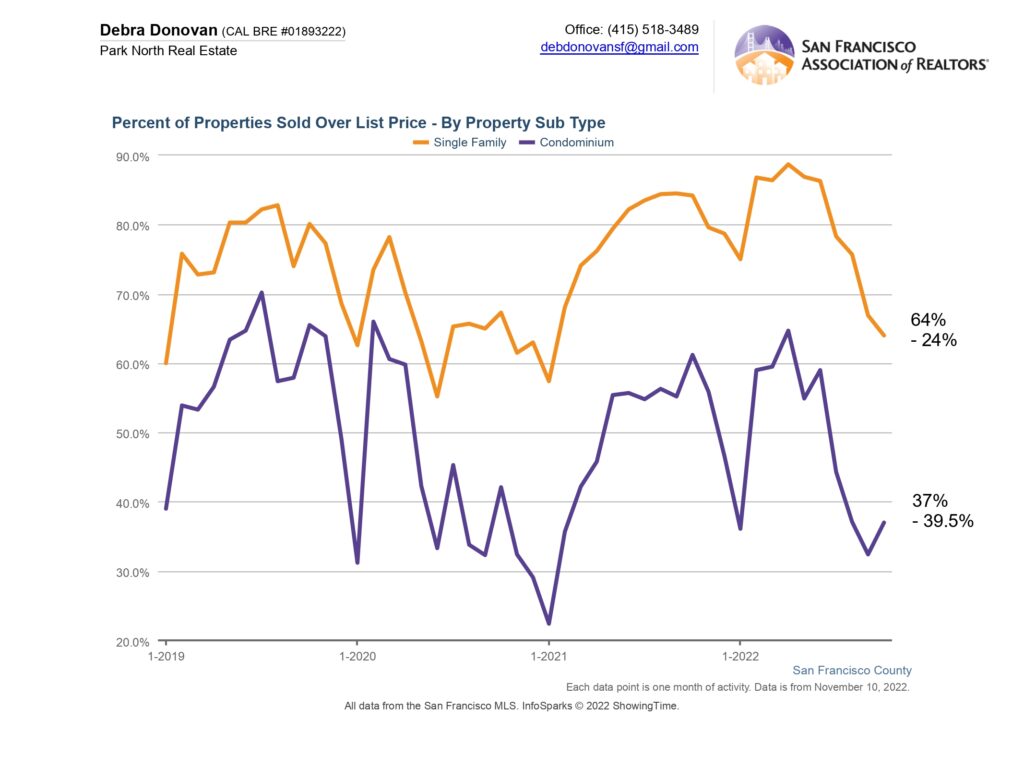
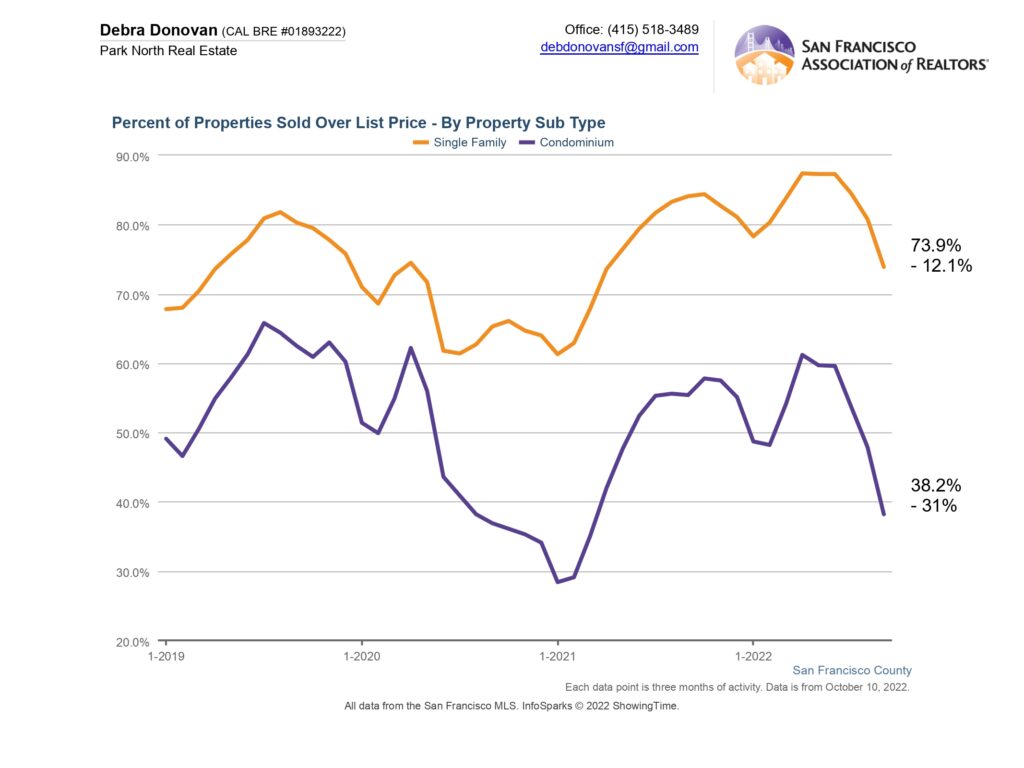
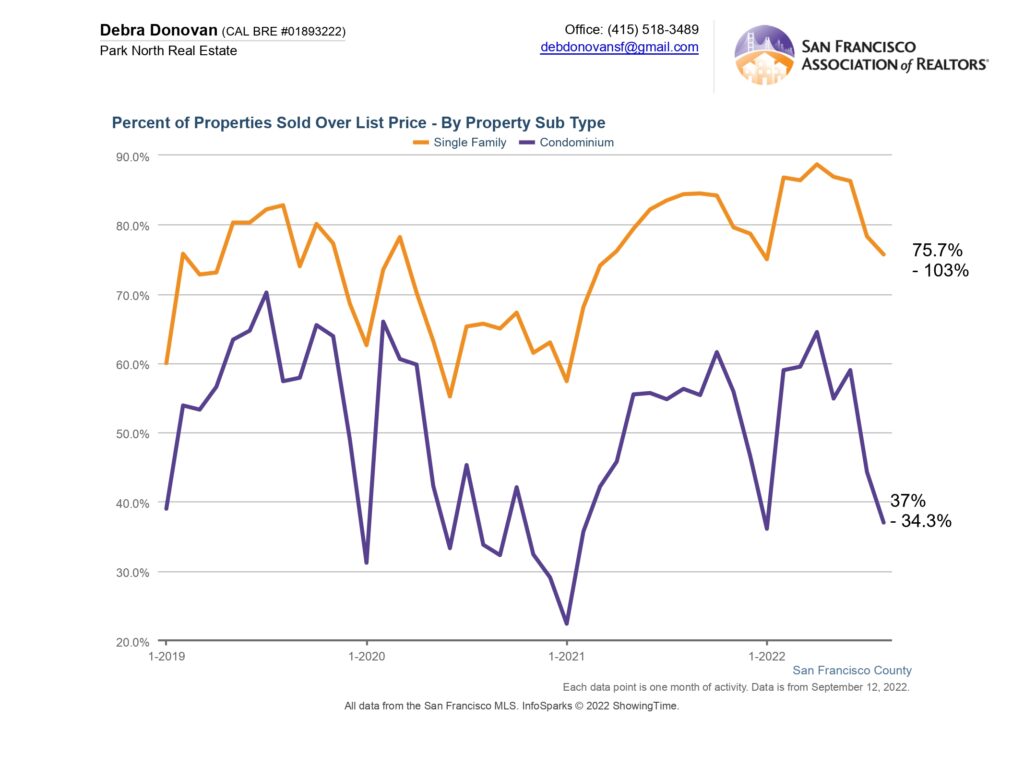
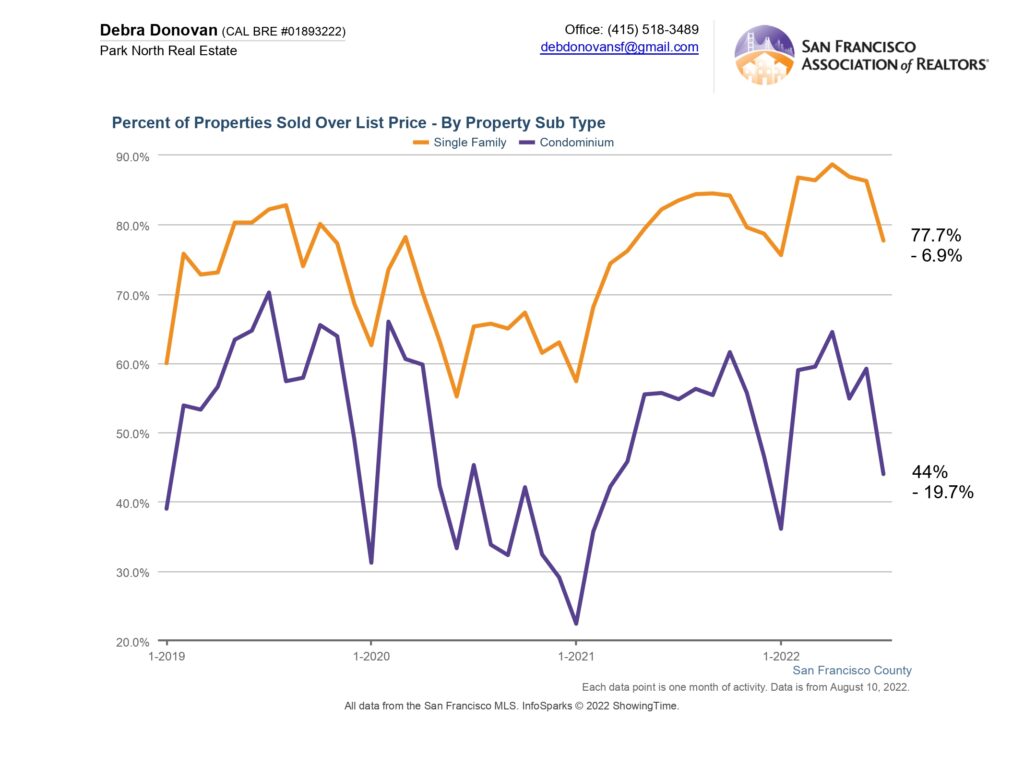
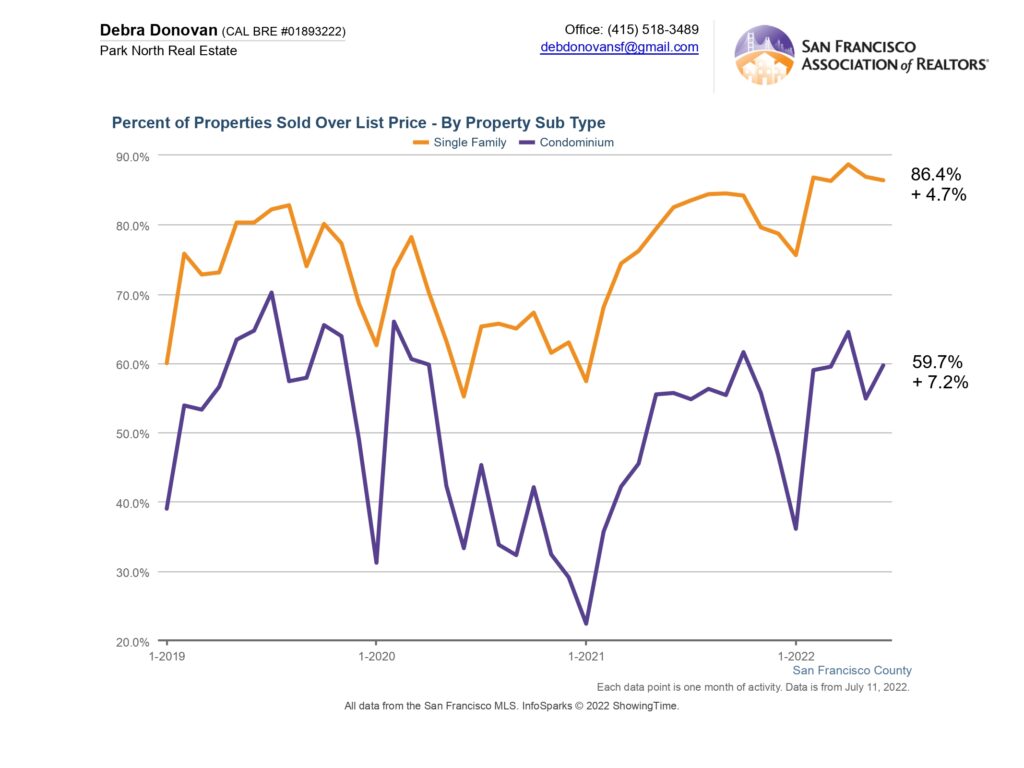
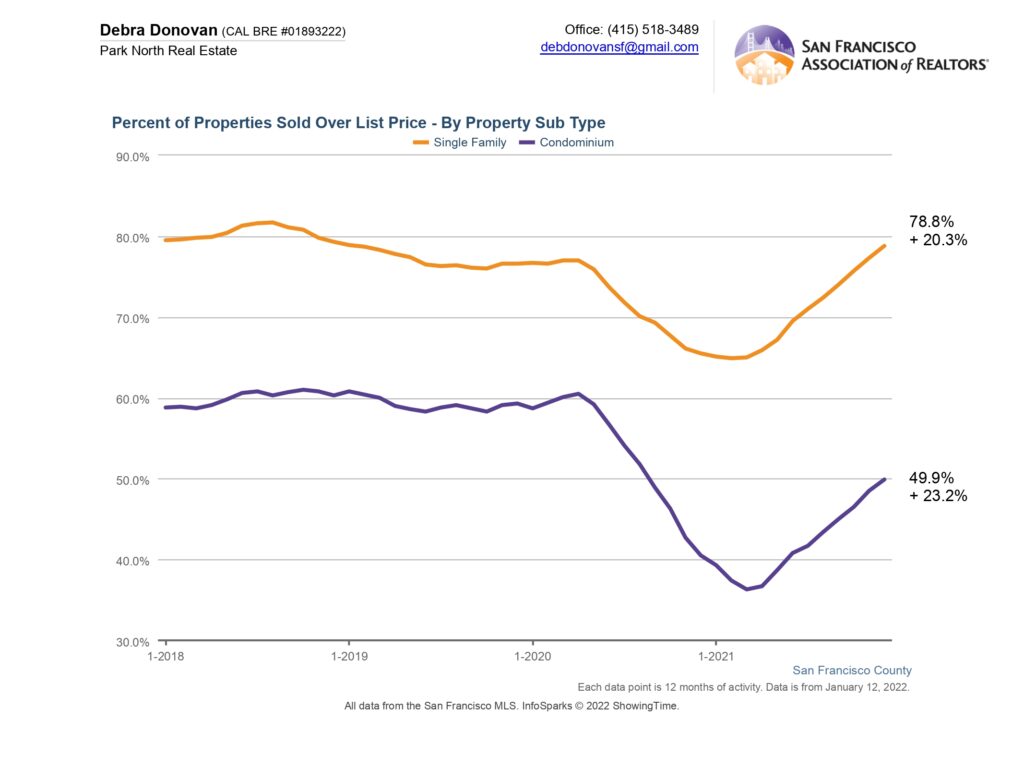
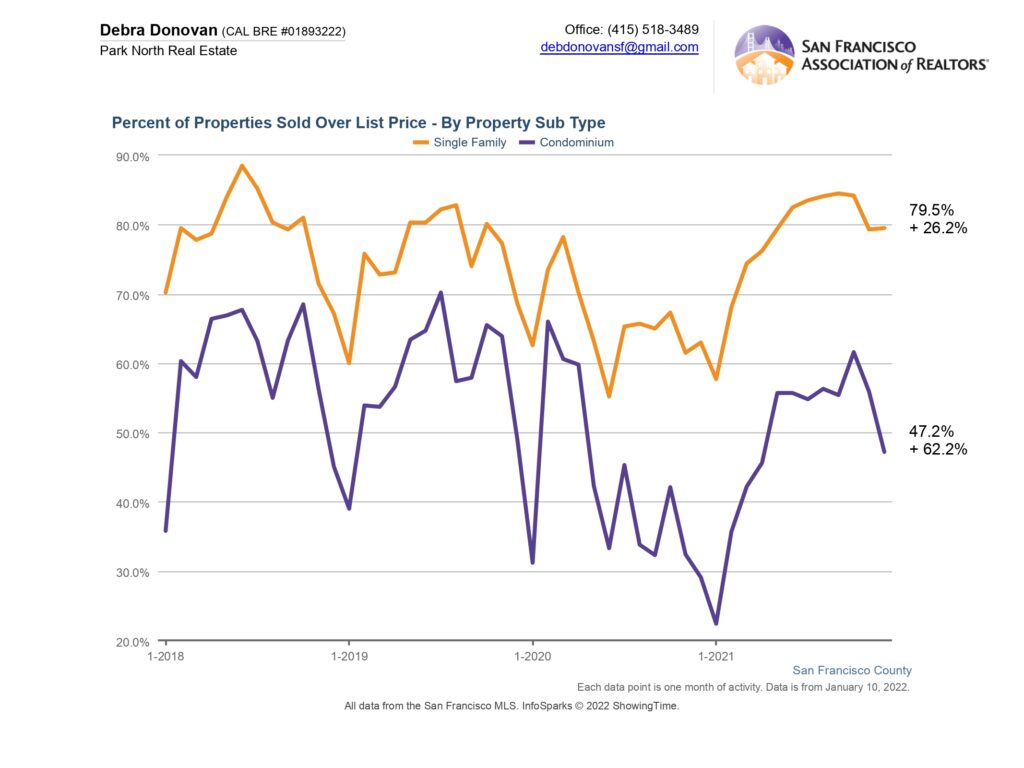
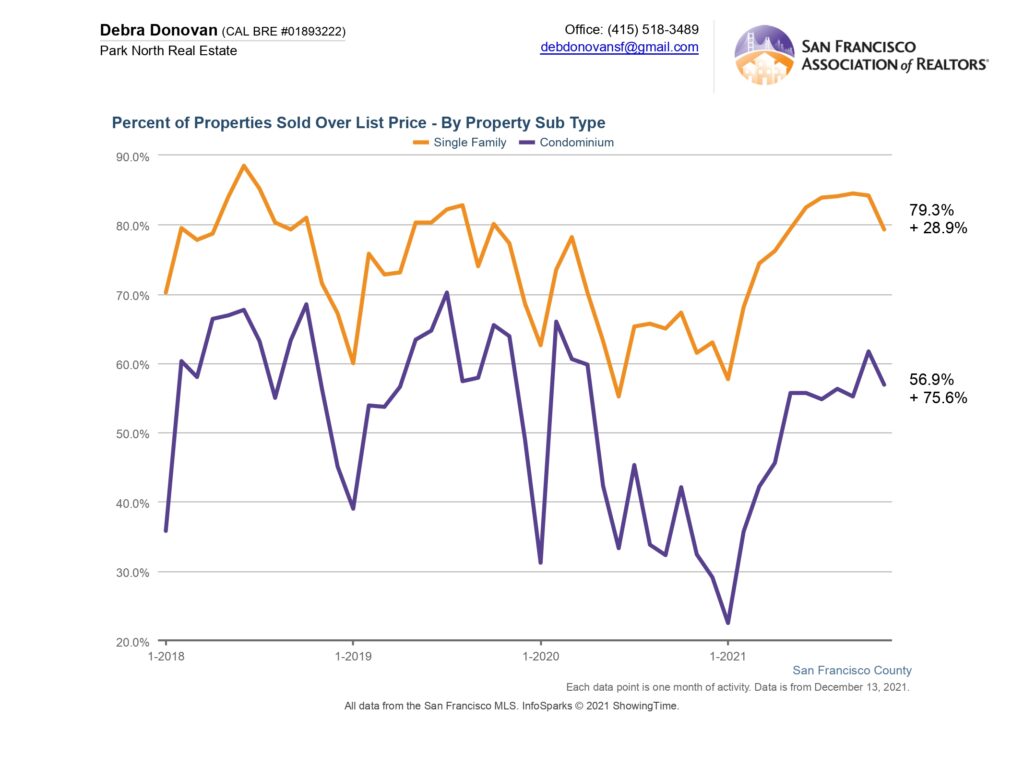
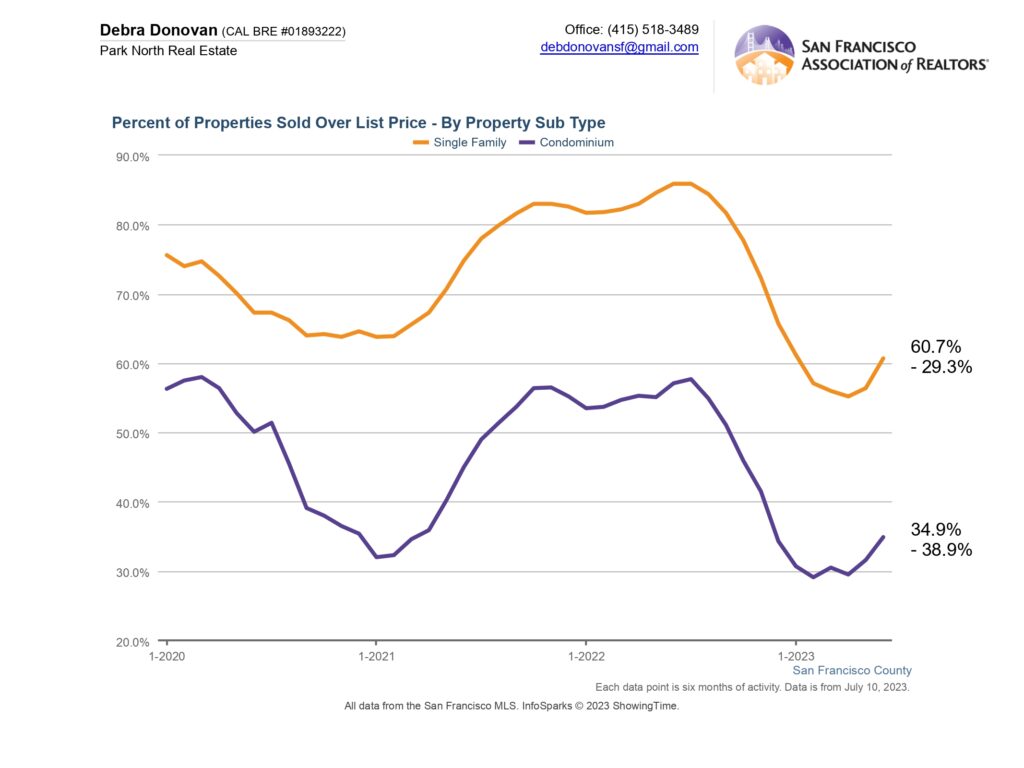
Percentage of Properties Sold Over List Price:
Just 60% of single family homes sold for over their list price in the first half of 2023, down 29% compared to the 86% that sold over list in the first half of 2022. Almost 35% of condos sold over their list price in the same period in 2023, down almost 39% over the first half of 2022.
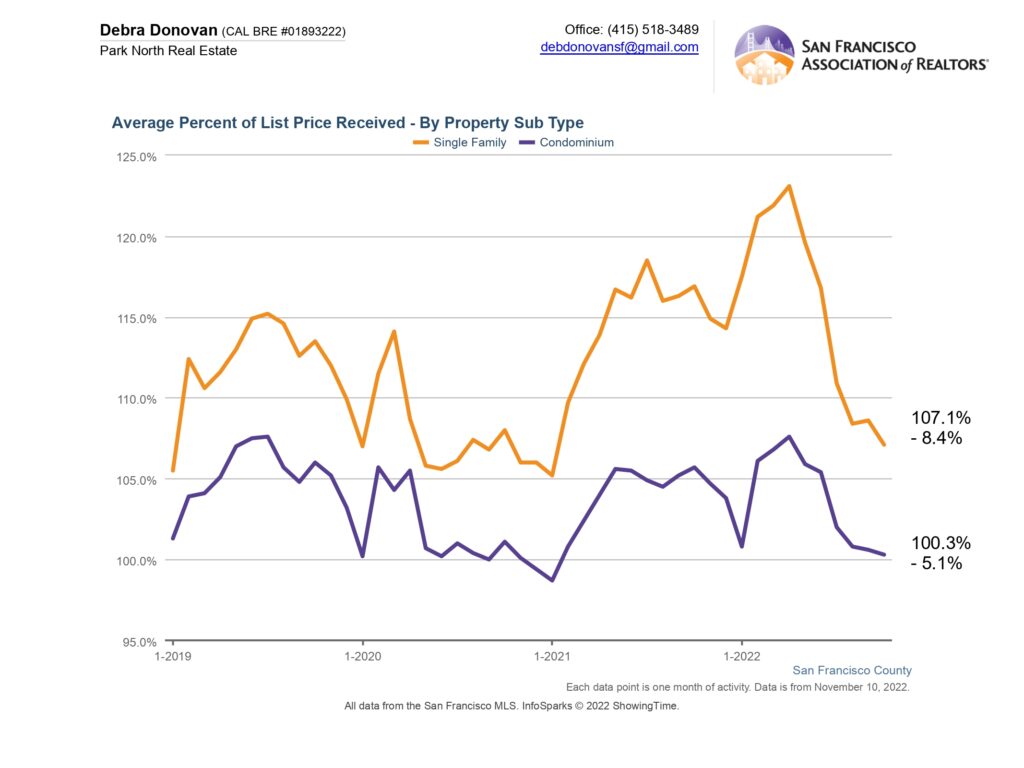
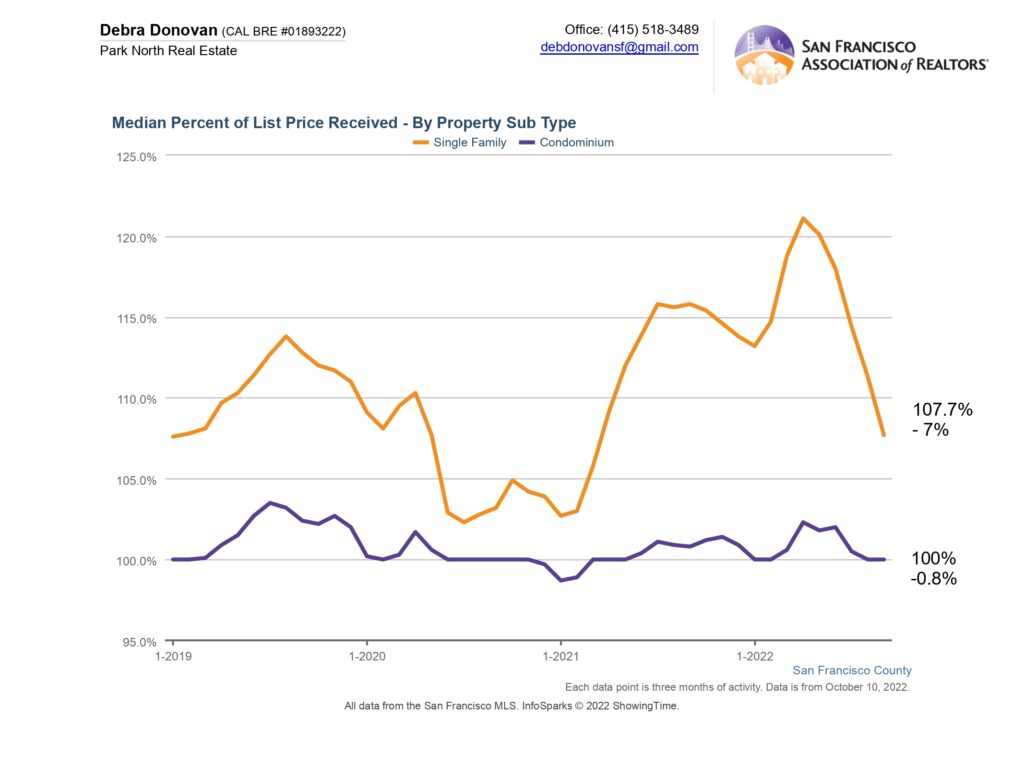
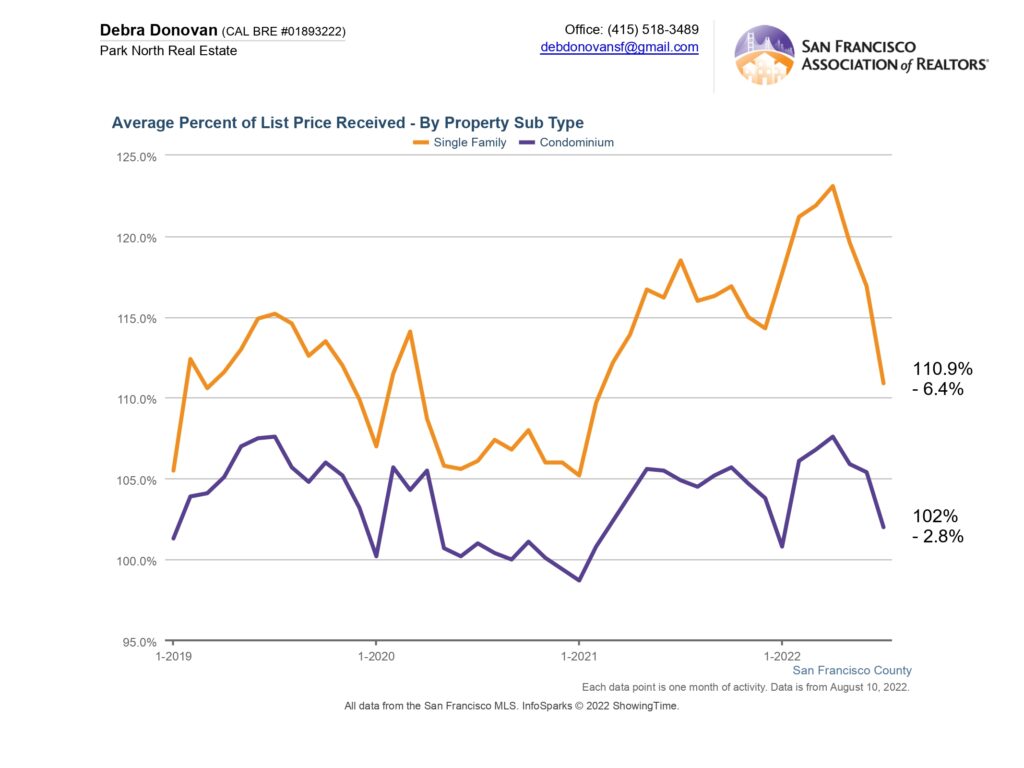
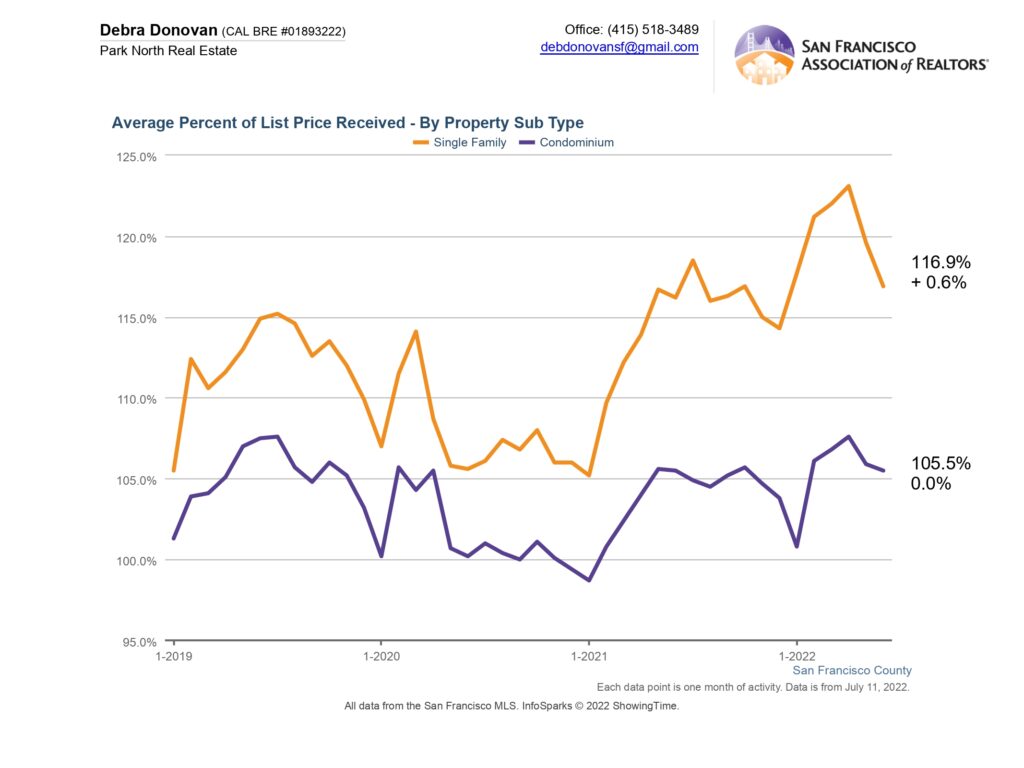
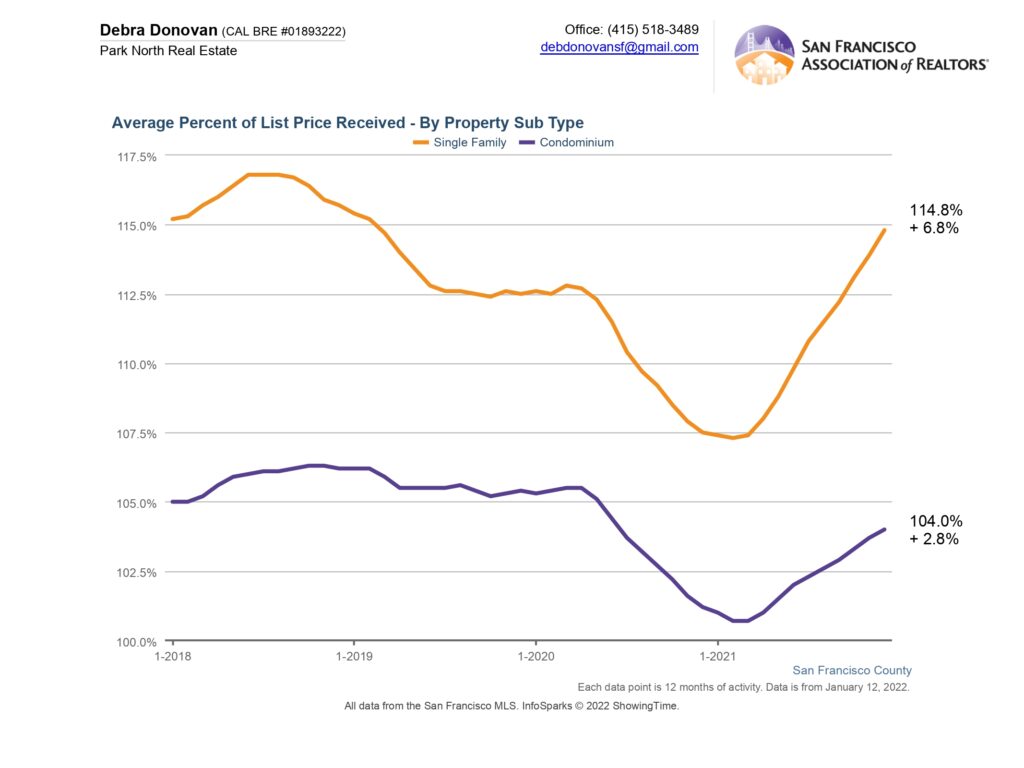
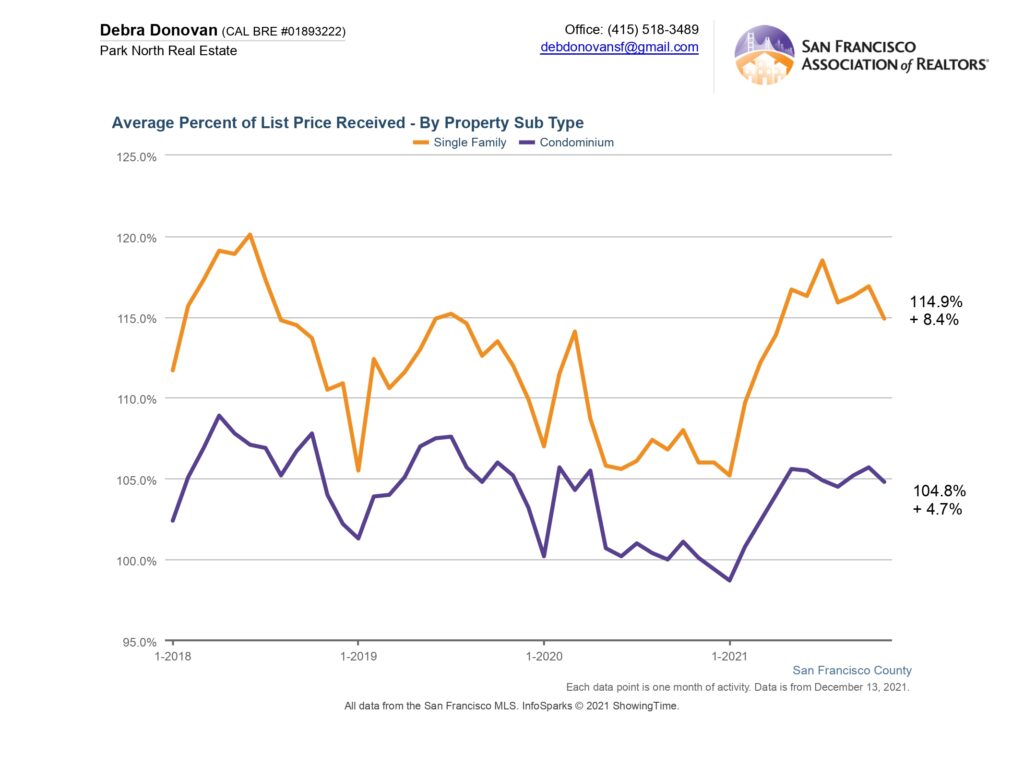
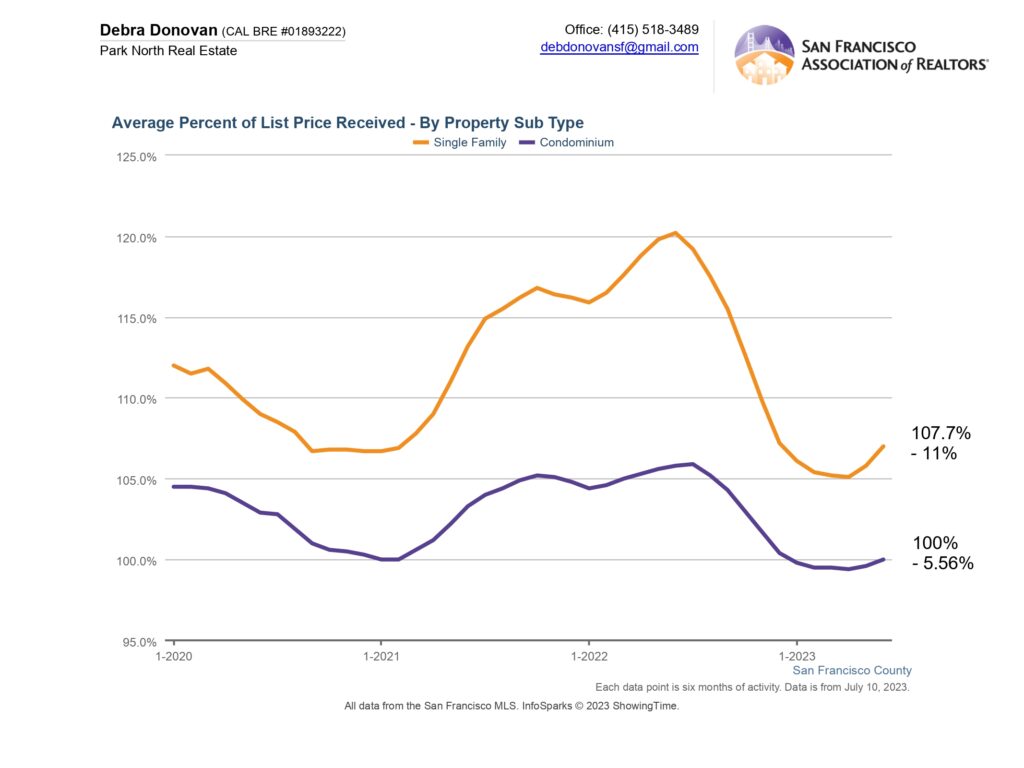
Average Percentage of List Price Received:
Single family homes sold for an average of 7% over their asking price in the first half of 2023, down almost 11% compared to the same time in 2022. On average, condos sold for their list price during the same period, down almost 6% compared to the fist half of 2022.
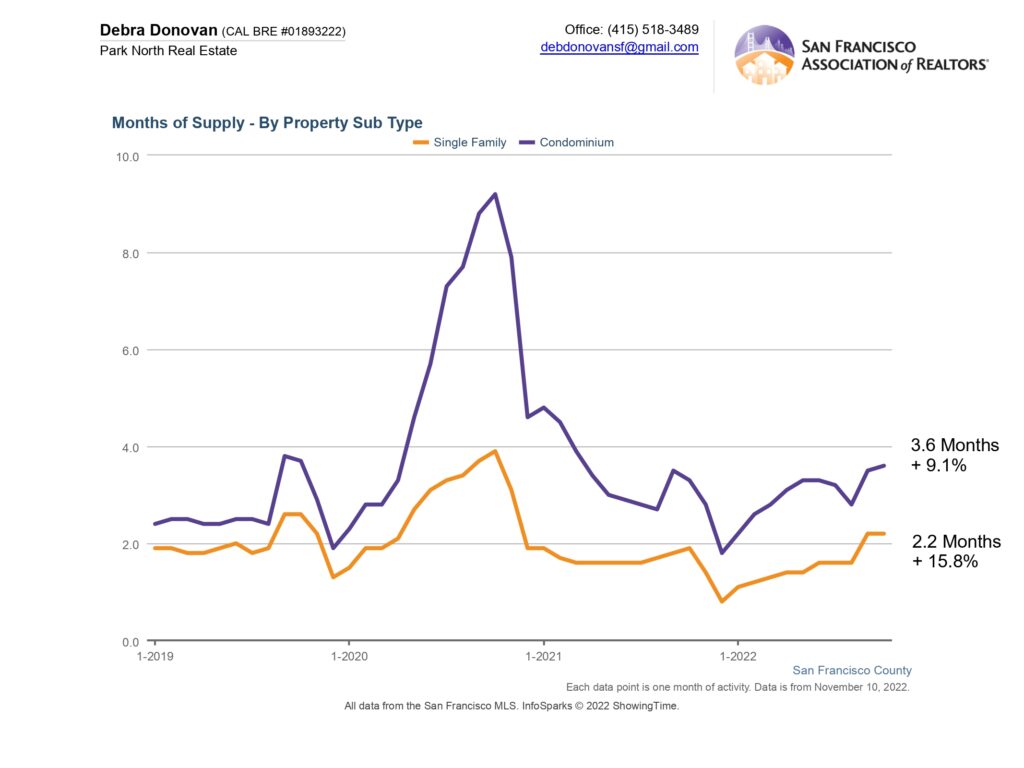
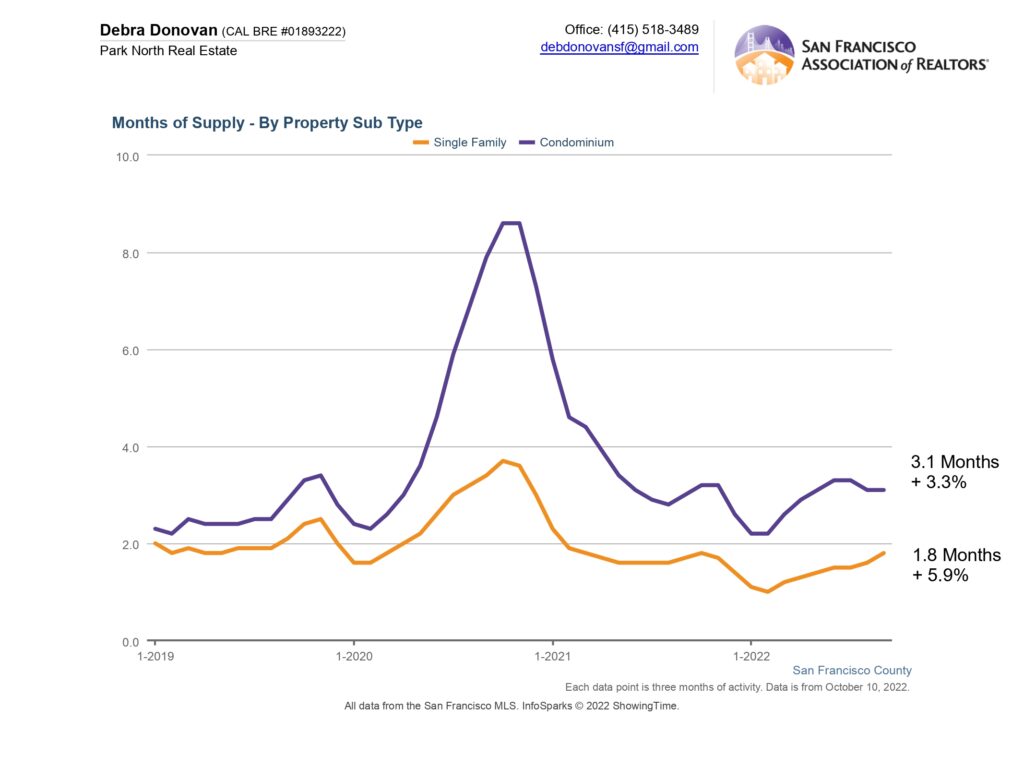
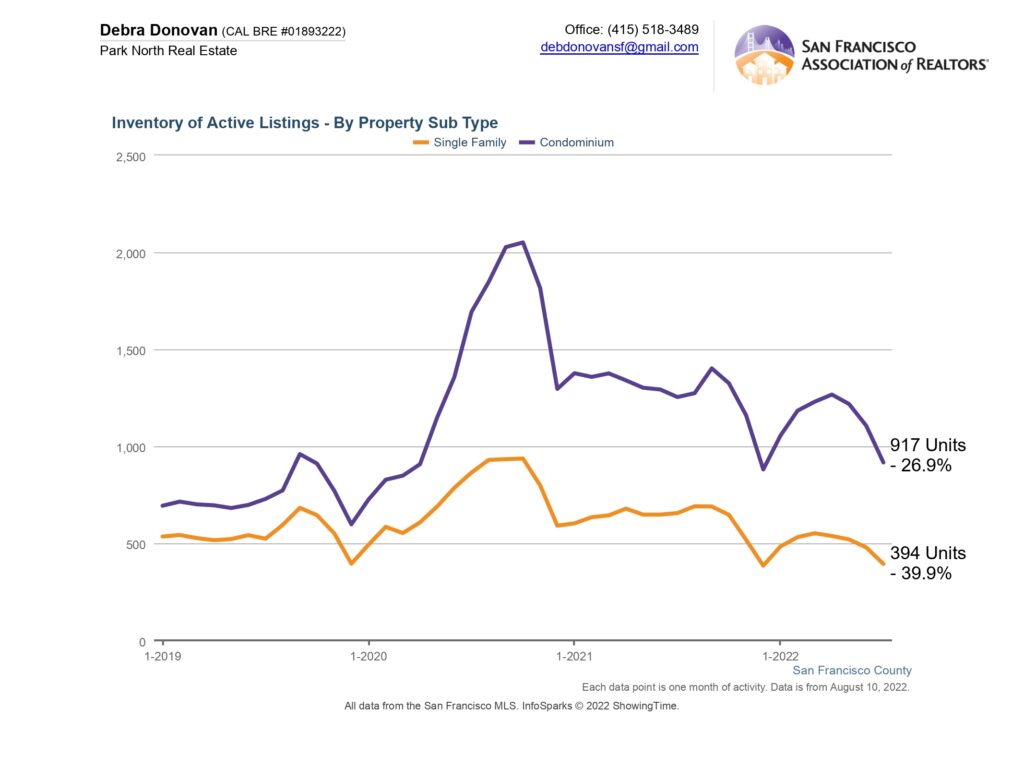
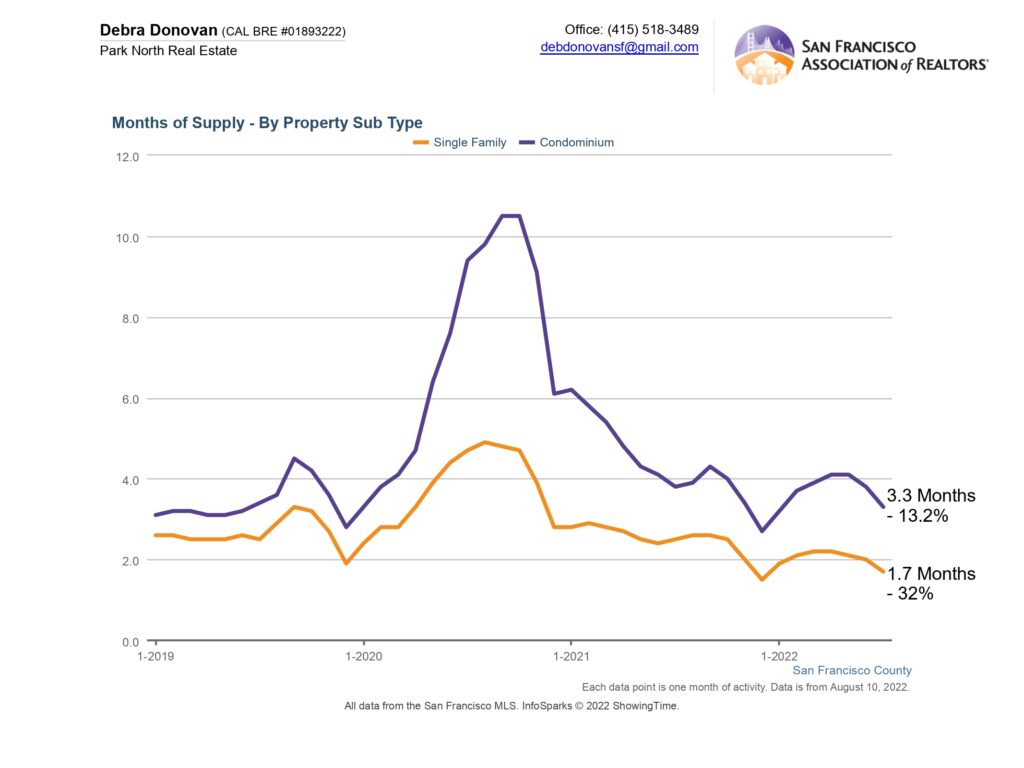
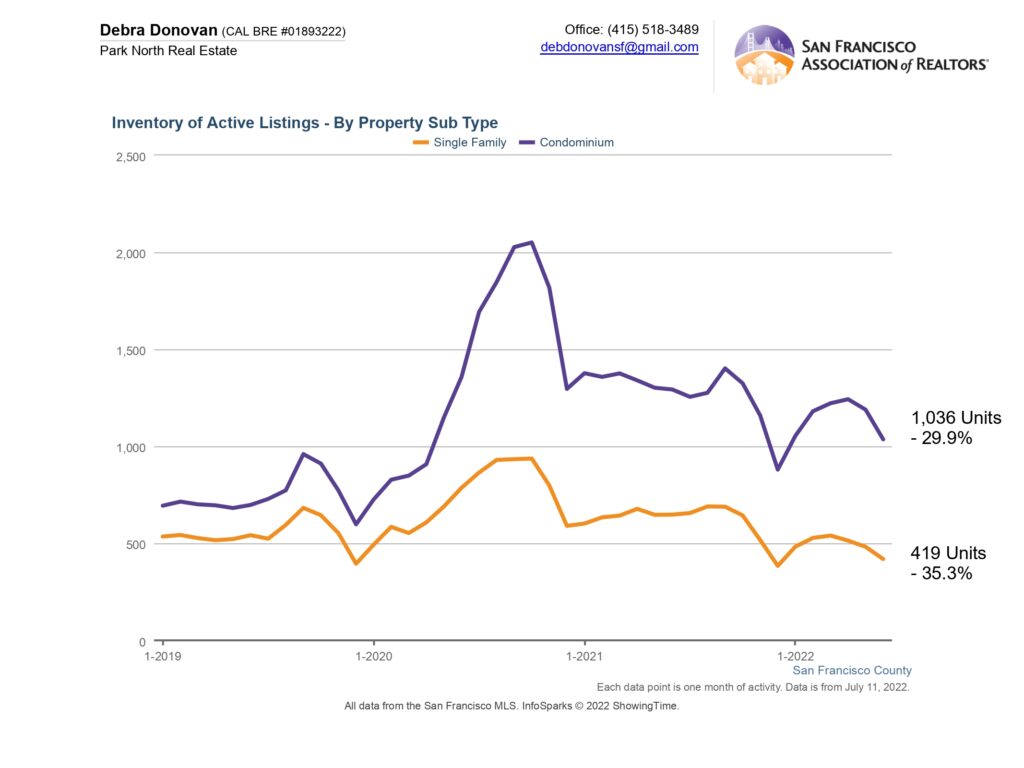
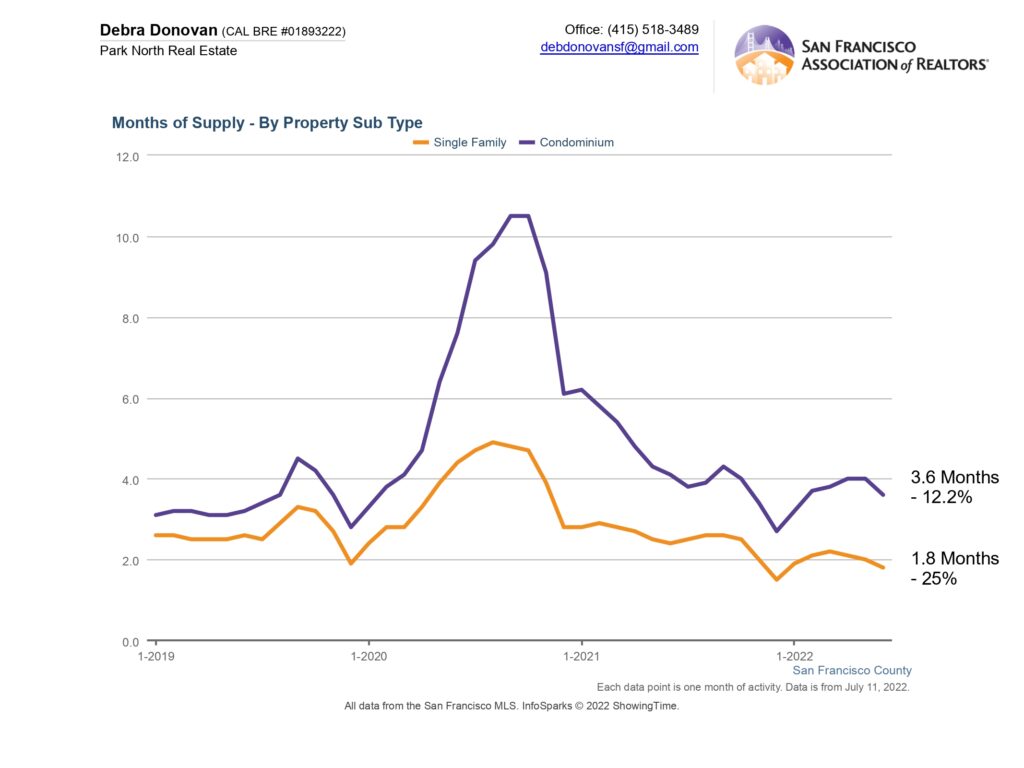
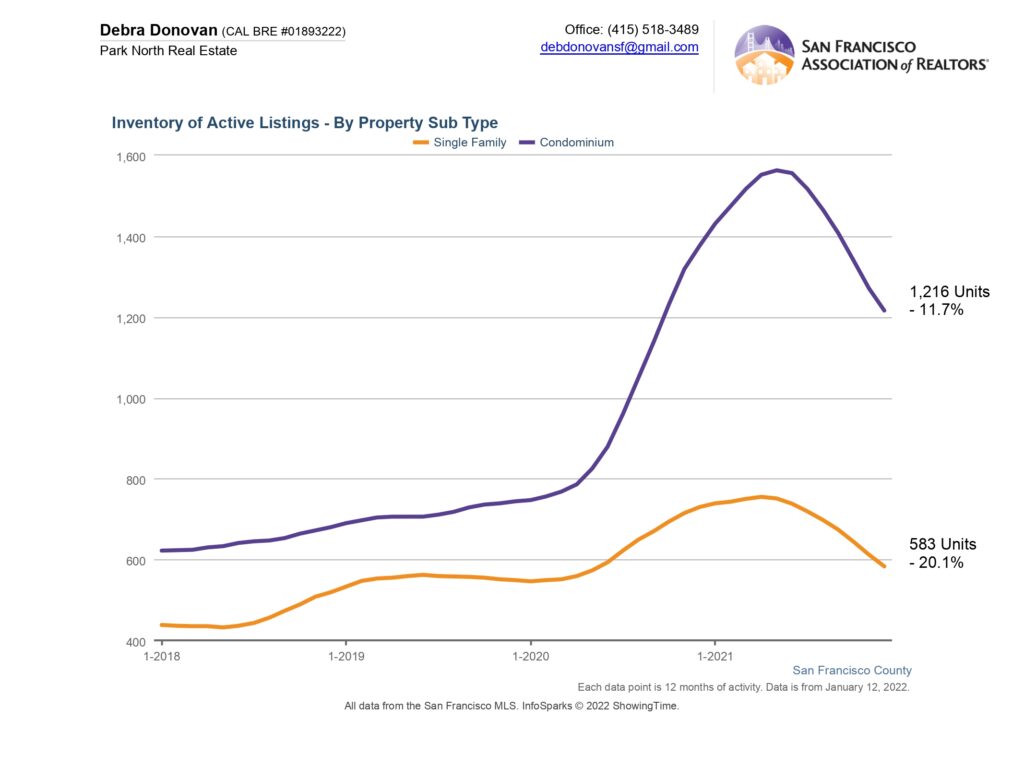
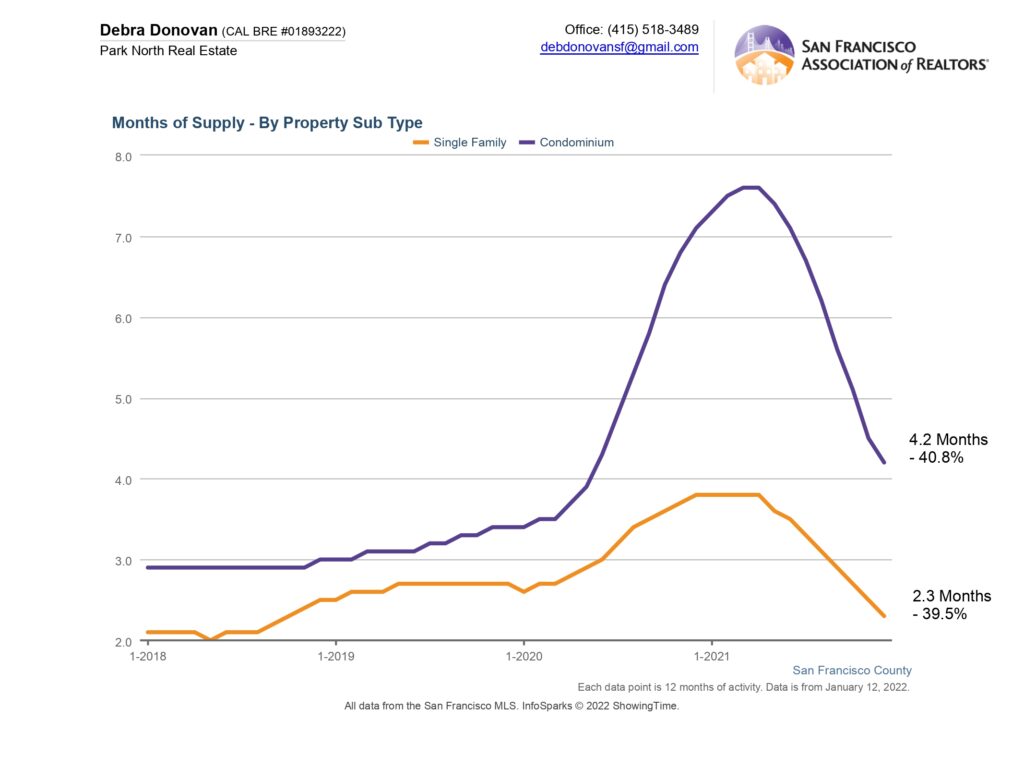
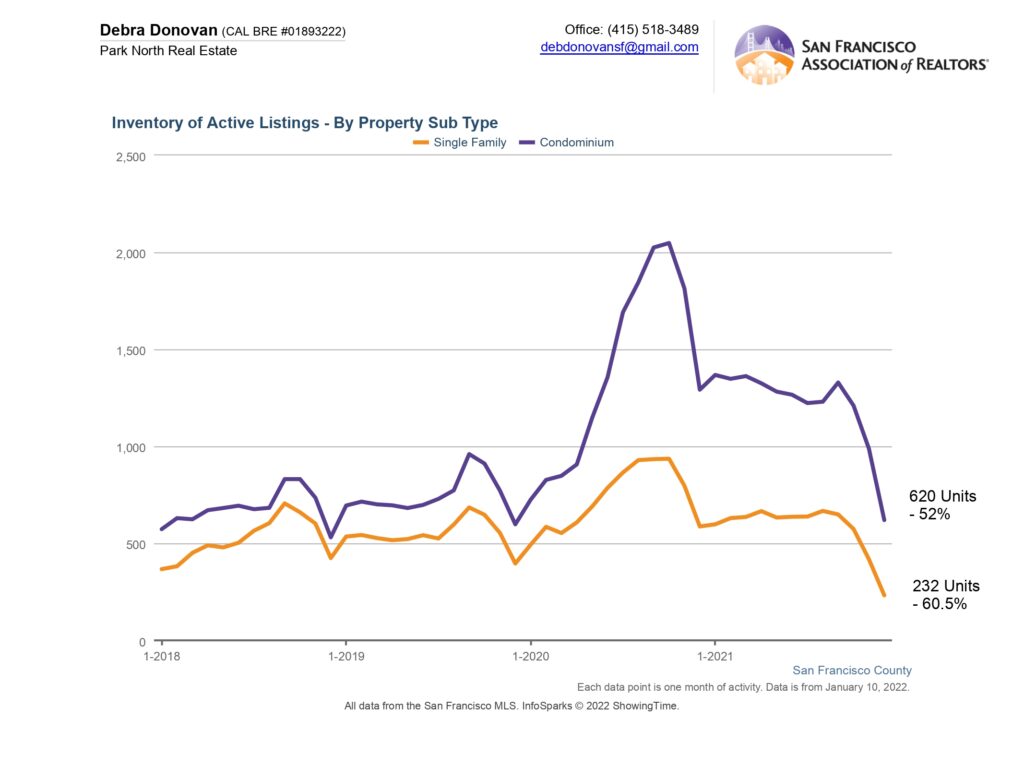
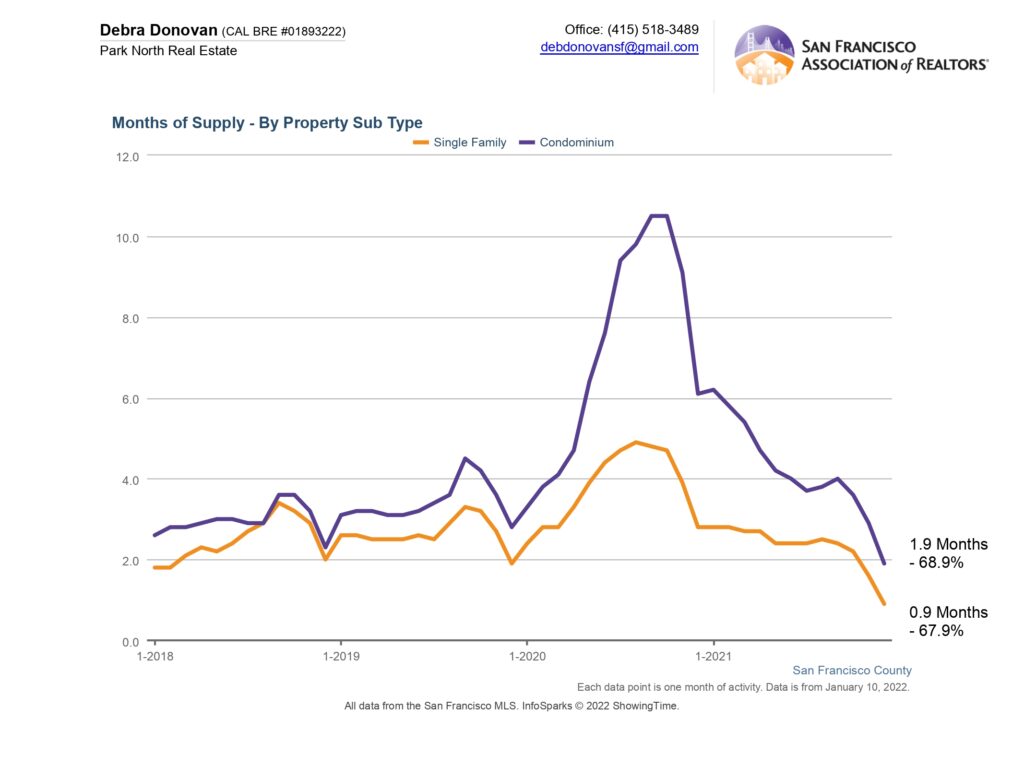
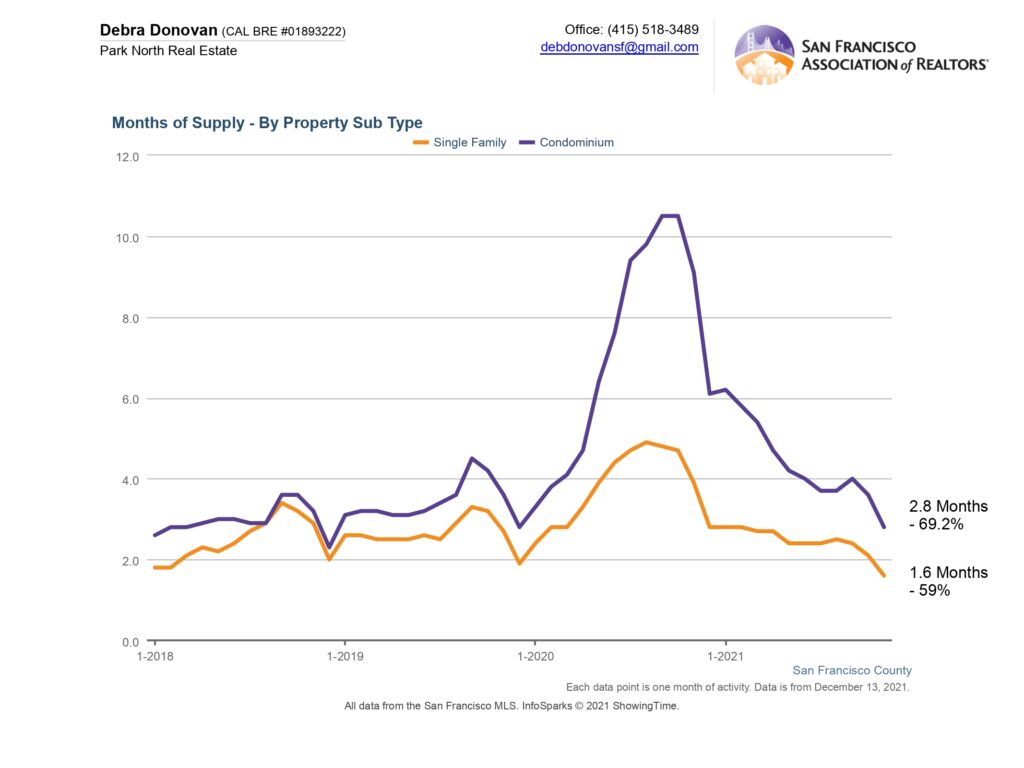
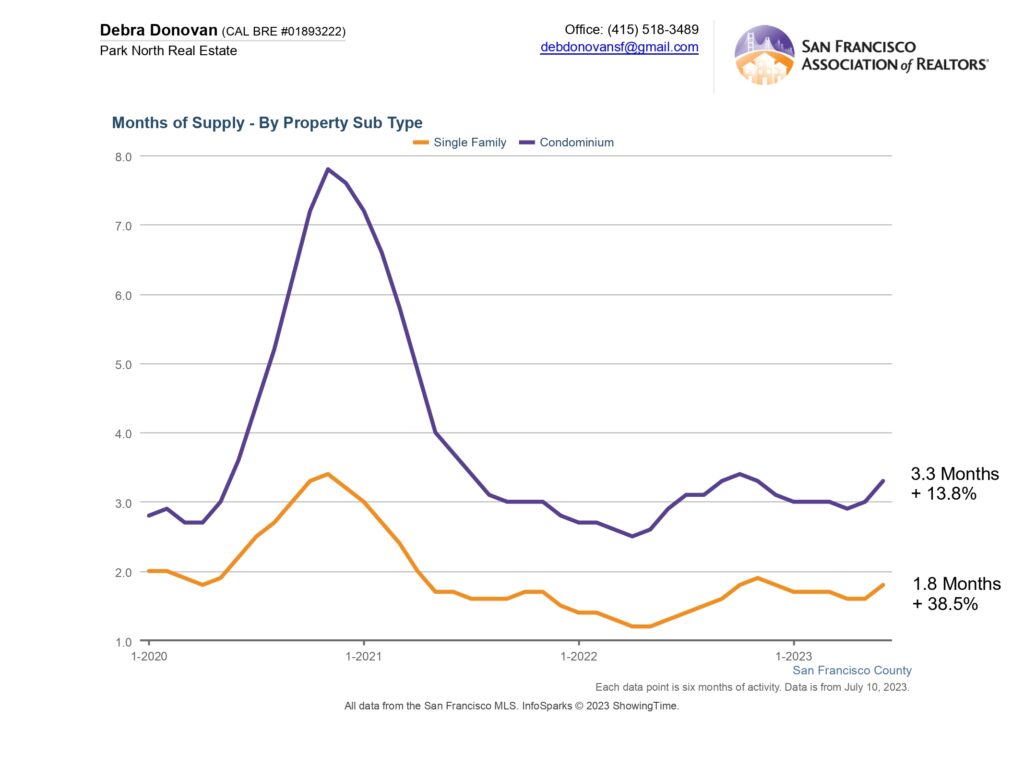
Months Supply of Inventory:
Months Supply of Inventory, or MSI, is the inventory of homes for sale at the end of a given month, divided by the average monthly Pending Sales from the last 12 months. Also known as absorption rate. The lower the supply, the greater the competition and the more of a seller’s market. For the first half of 2023 single family homes had just 1.8 months of inventory, up over 38% while condos had 3.3 months of inventory, which is up almost 14% compared to 2022. This is more a commentary on how tight things were in 2022.
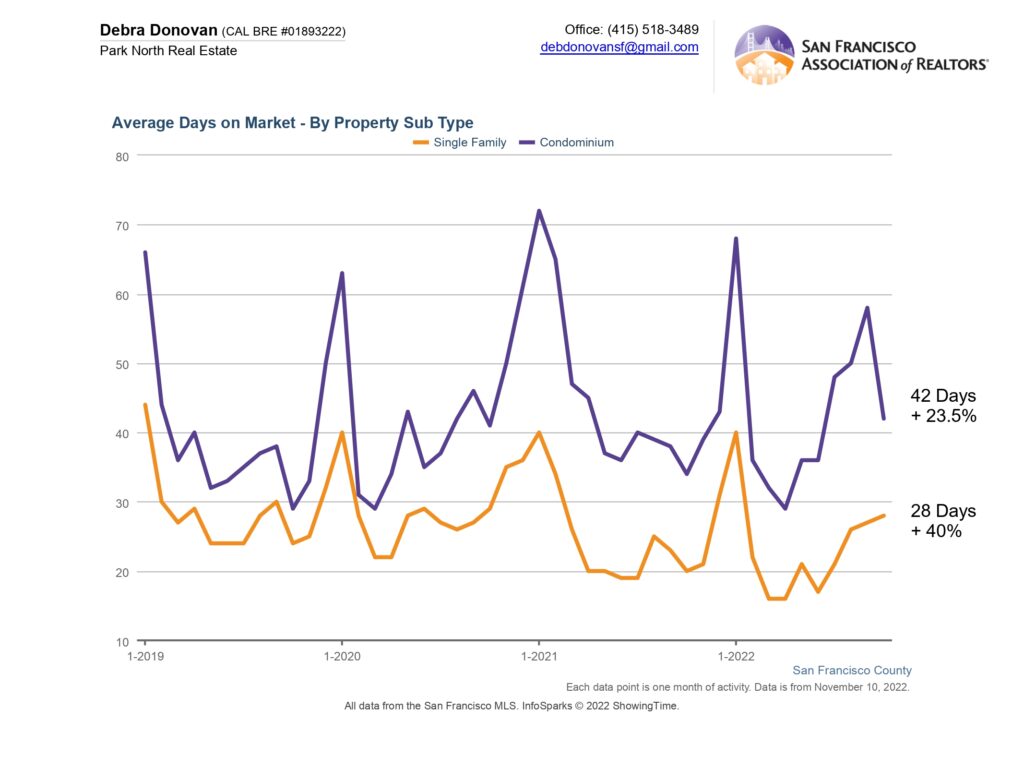
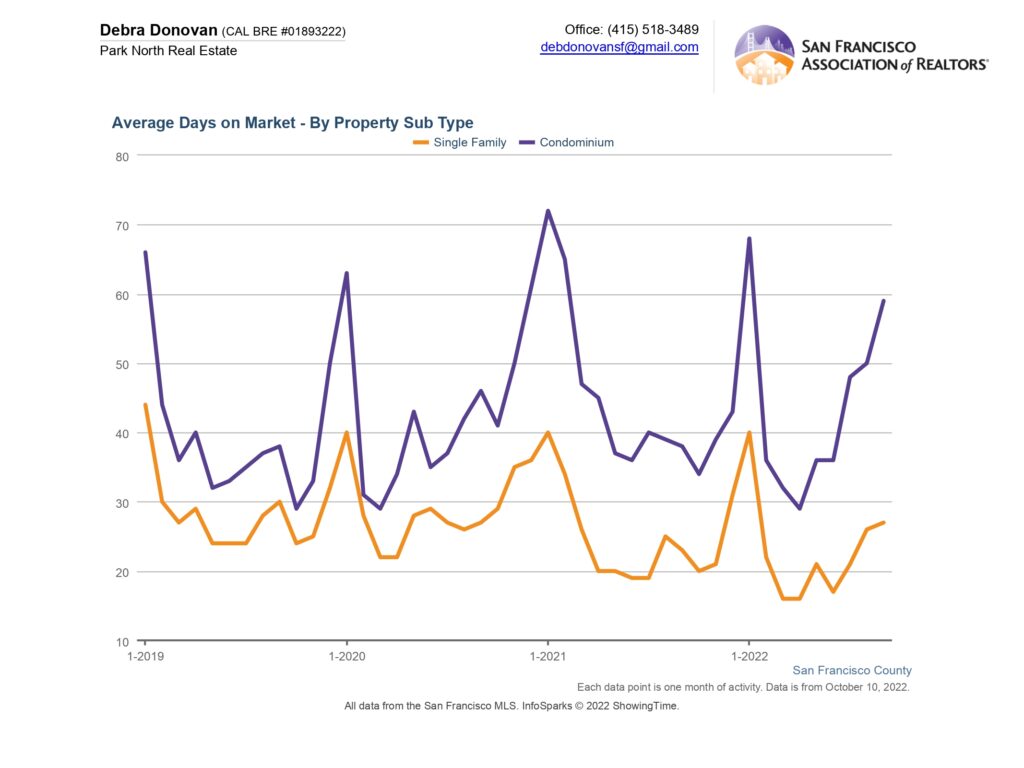
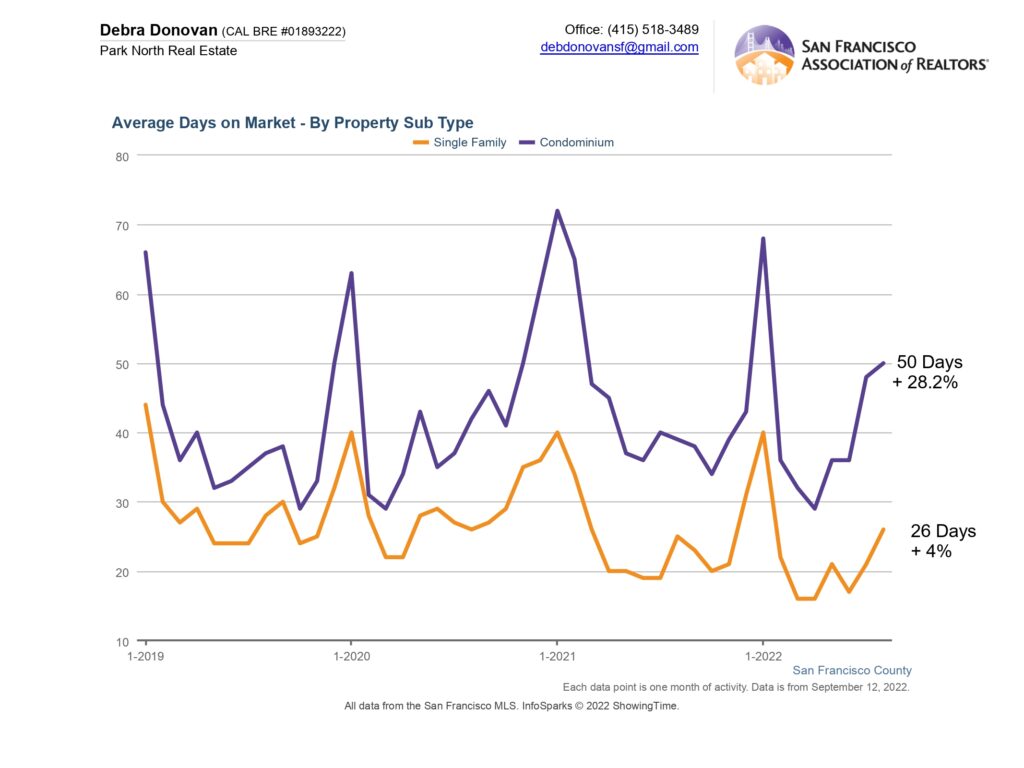
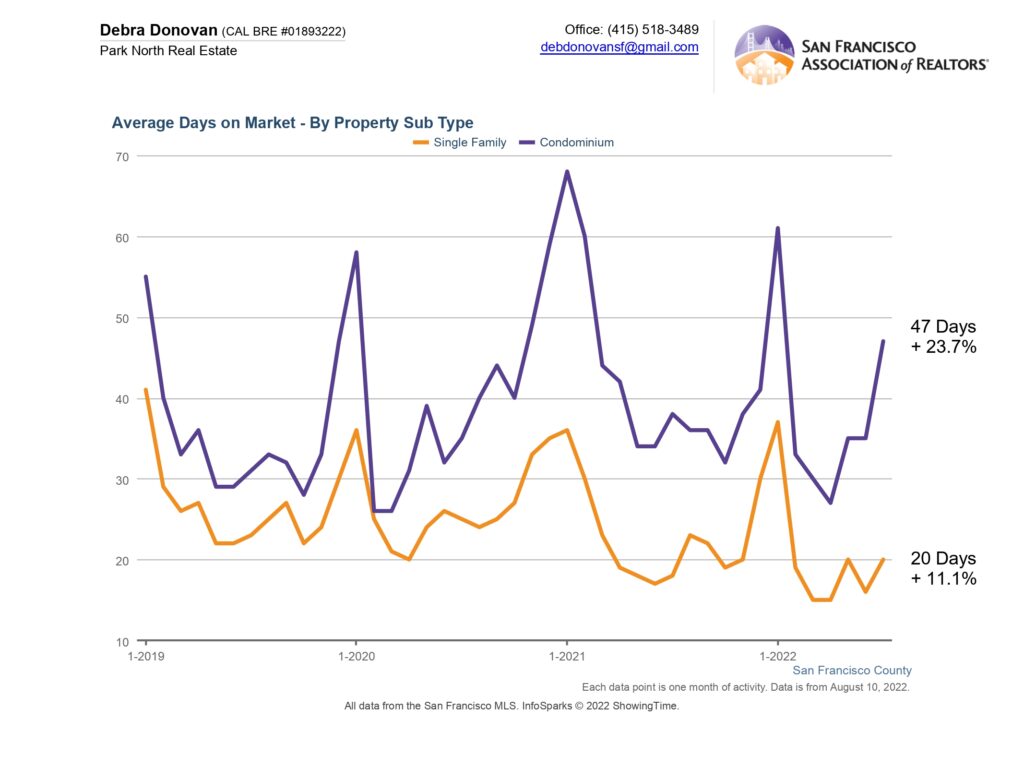
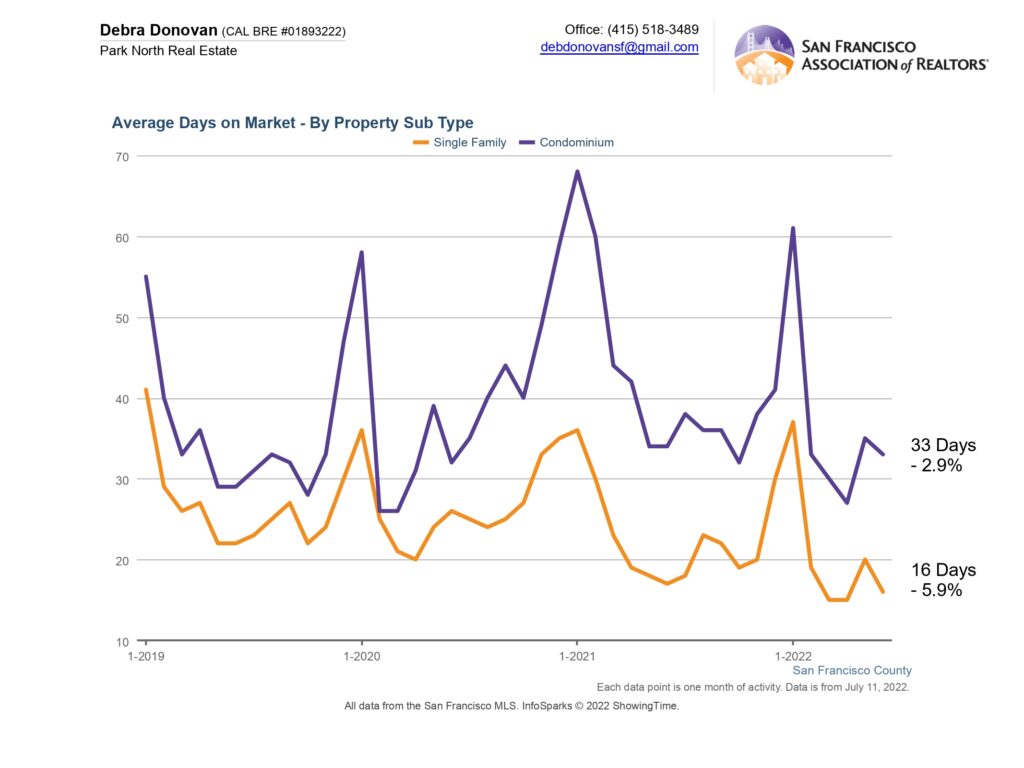
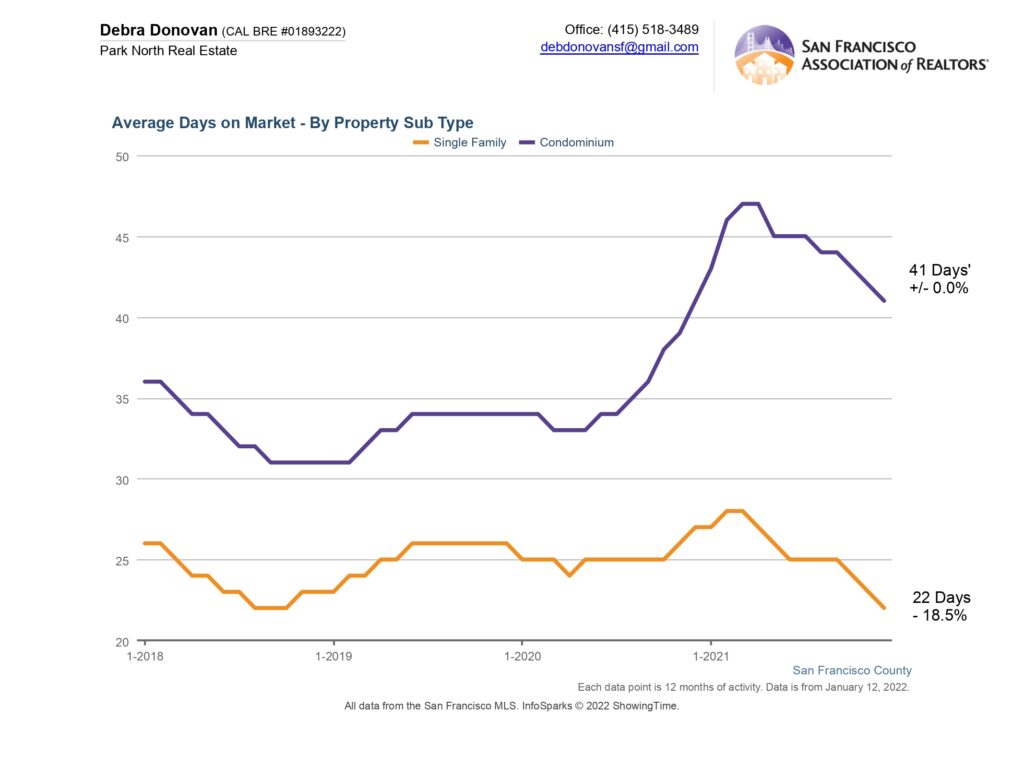
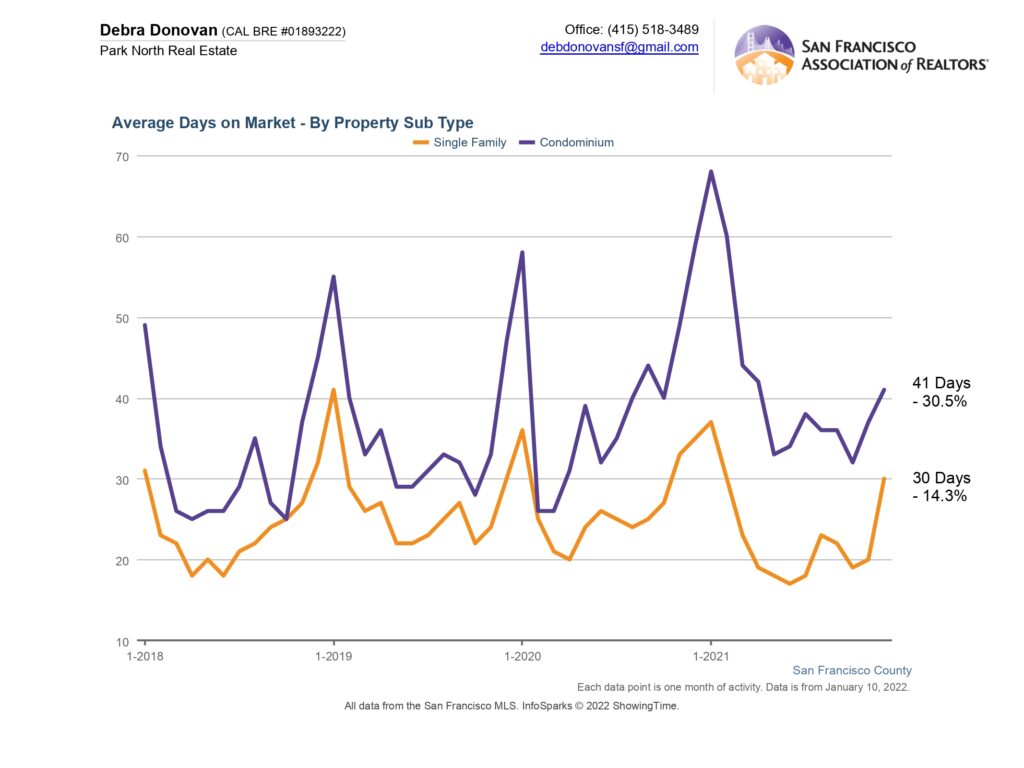
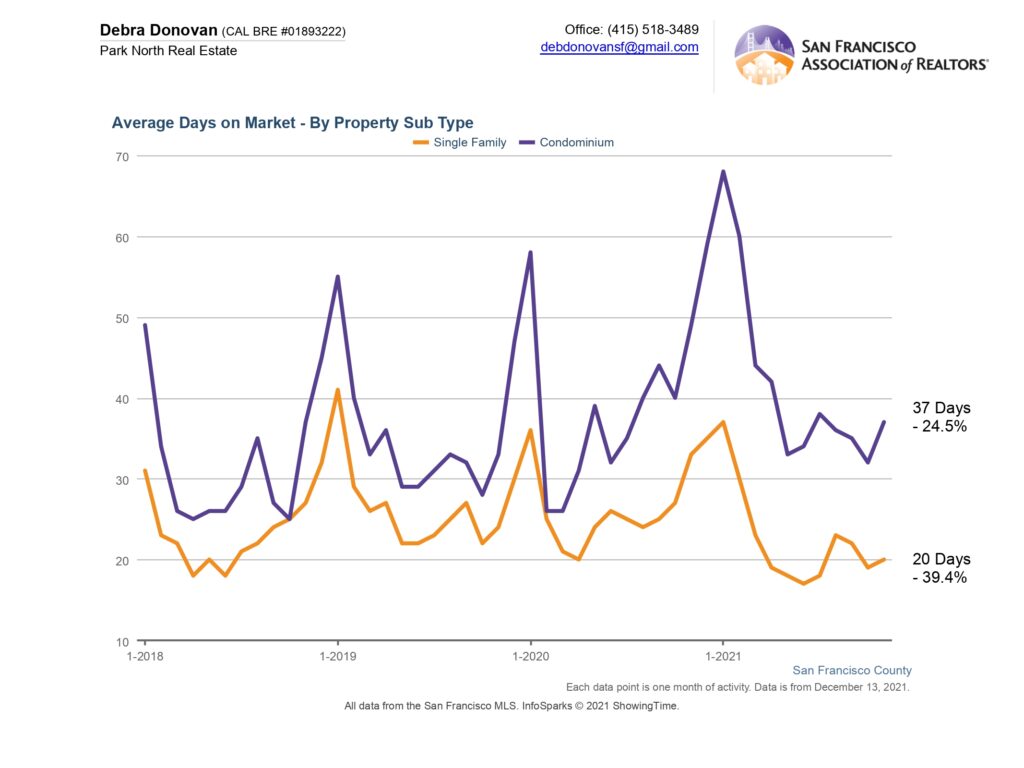
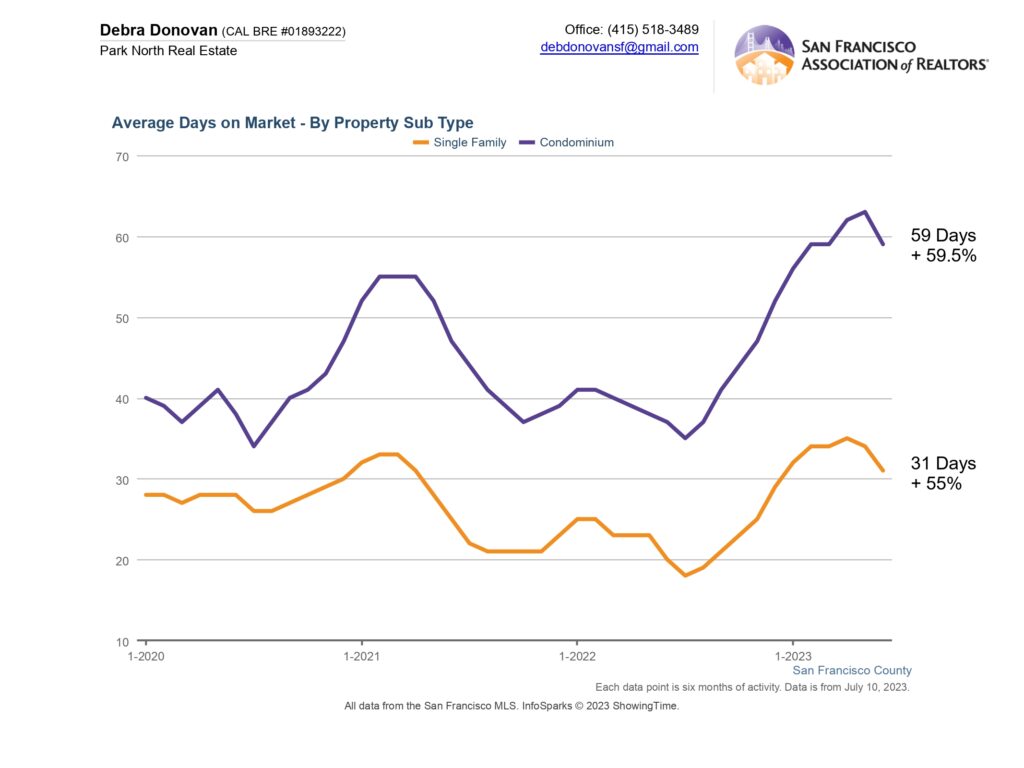
Average Days on Market:
Single family homes spent an average of 31 days on the market in the first half of 2023, up 55% compared to the same time frame in 2022. Condos spent 59 days on average on the market, up almost 60%.
The fine print: All information deemed reliable but not guaranteed or warranted. Data comes from the MLS so does not include off-market and most new construction condo sales. The Bay Area real estate market is dynamic so statistics can change on a daily basis. These statistics are meant to be a snapshot of the day and time they were pulled.