February 2020 San Francisco Real Estate Market Update

Happy Lunar New Year! It may be the Year of the Rat this year, but so far it doesn’t look like it’s the year of more housing inventory for San Francisco. In January the median price for single family homes and condos and lofts increased, but both new and active listings were down double-digits.
It’s important to contextualize, though, that in real estate the statistics are typically 30-60 days behind. Home sales that closed in January are primarily homes that were put on the market over the holiday season. Also, Spring is typically our biggest season when the most homes come on the market. That said, buyers are out there buying and homes are on average still selling quickly, many over their asking price. So if you’re thinking of selling this year, consider coming on prior to Spring and get a jump on the competition. Here are the stats for January.
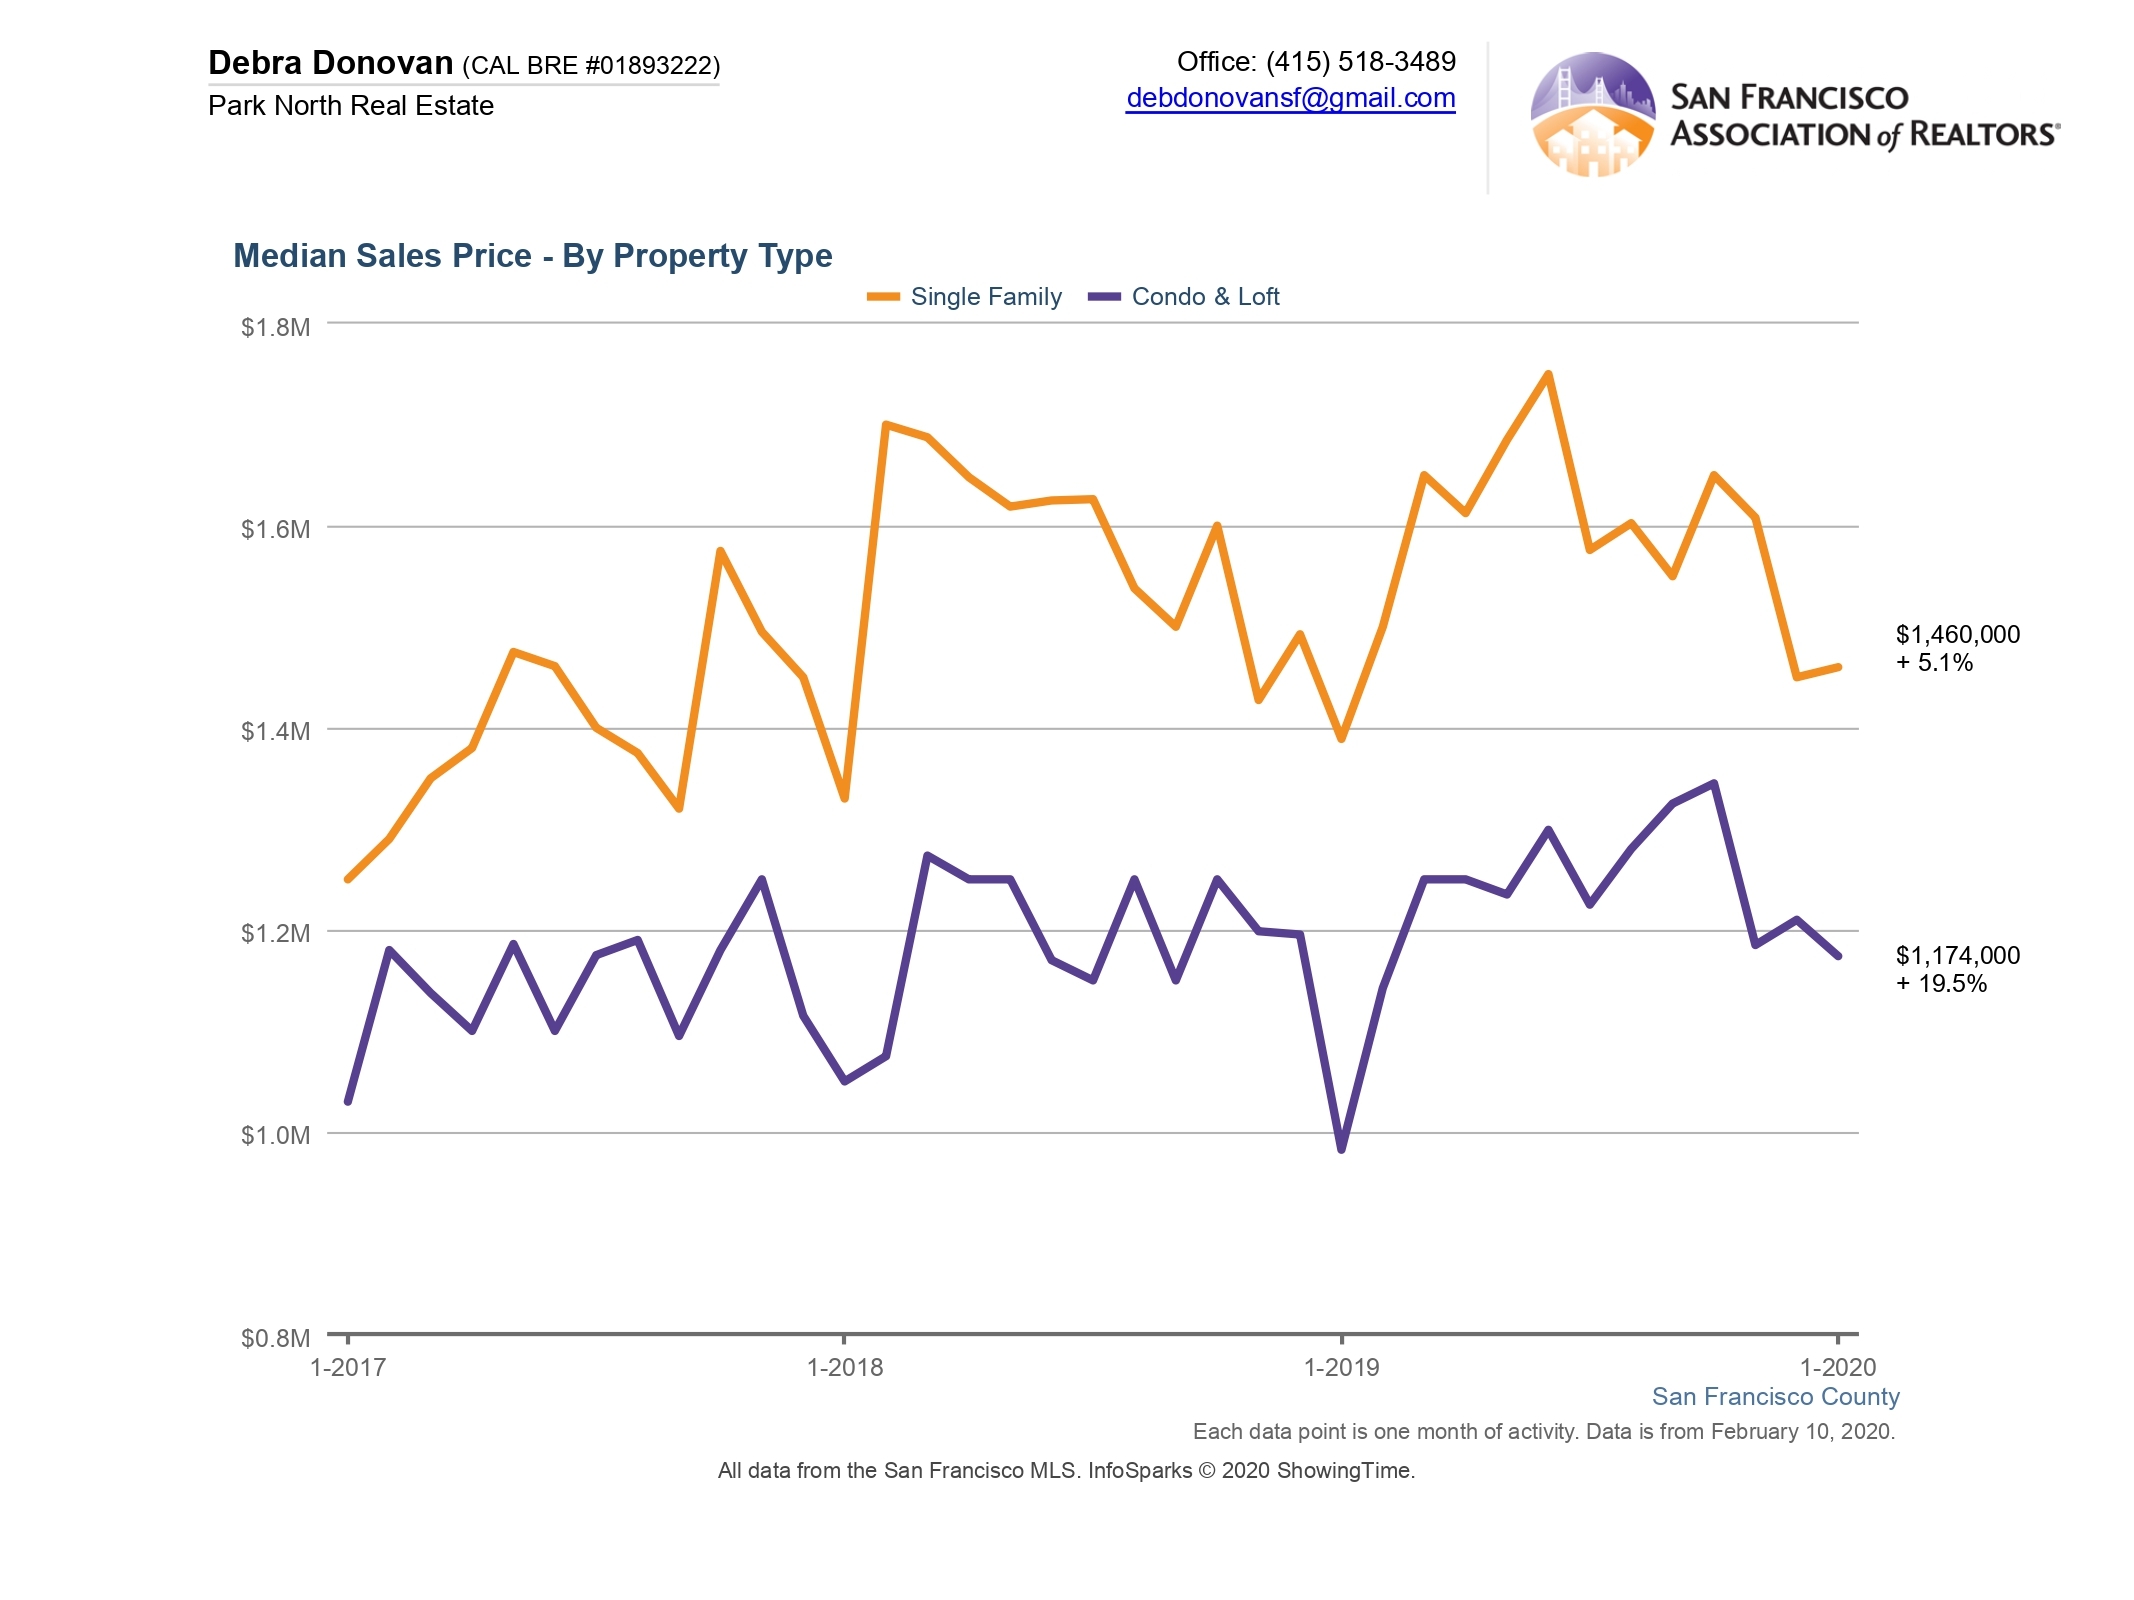
Median Sales Price:
The median price for a single family home rose 5% in January compared to the same month last year, coming in at $1,460,000. Condos and lofts fared even better year over year, rising 19.5% to $1,174,000.
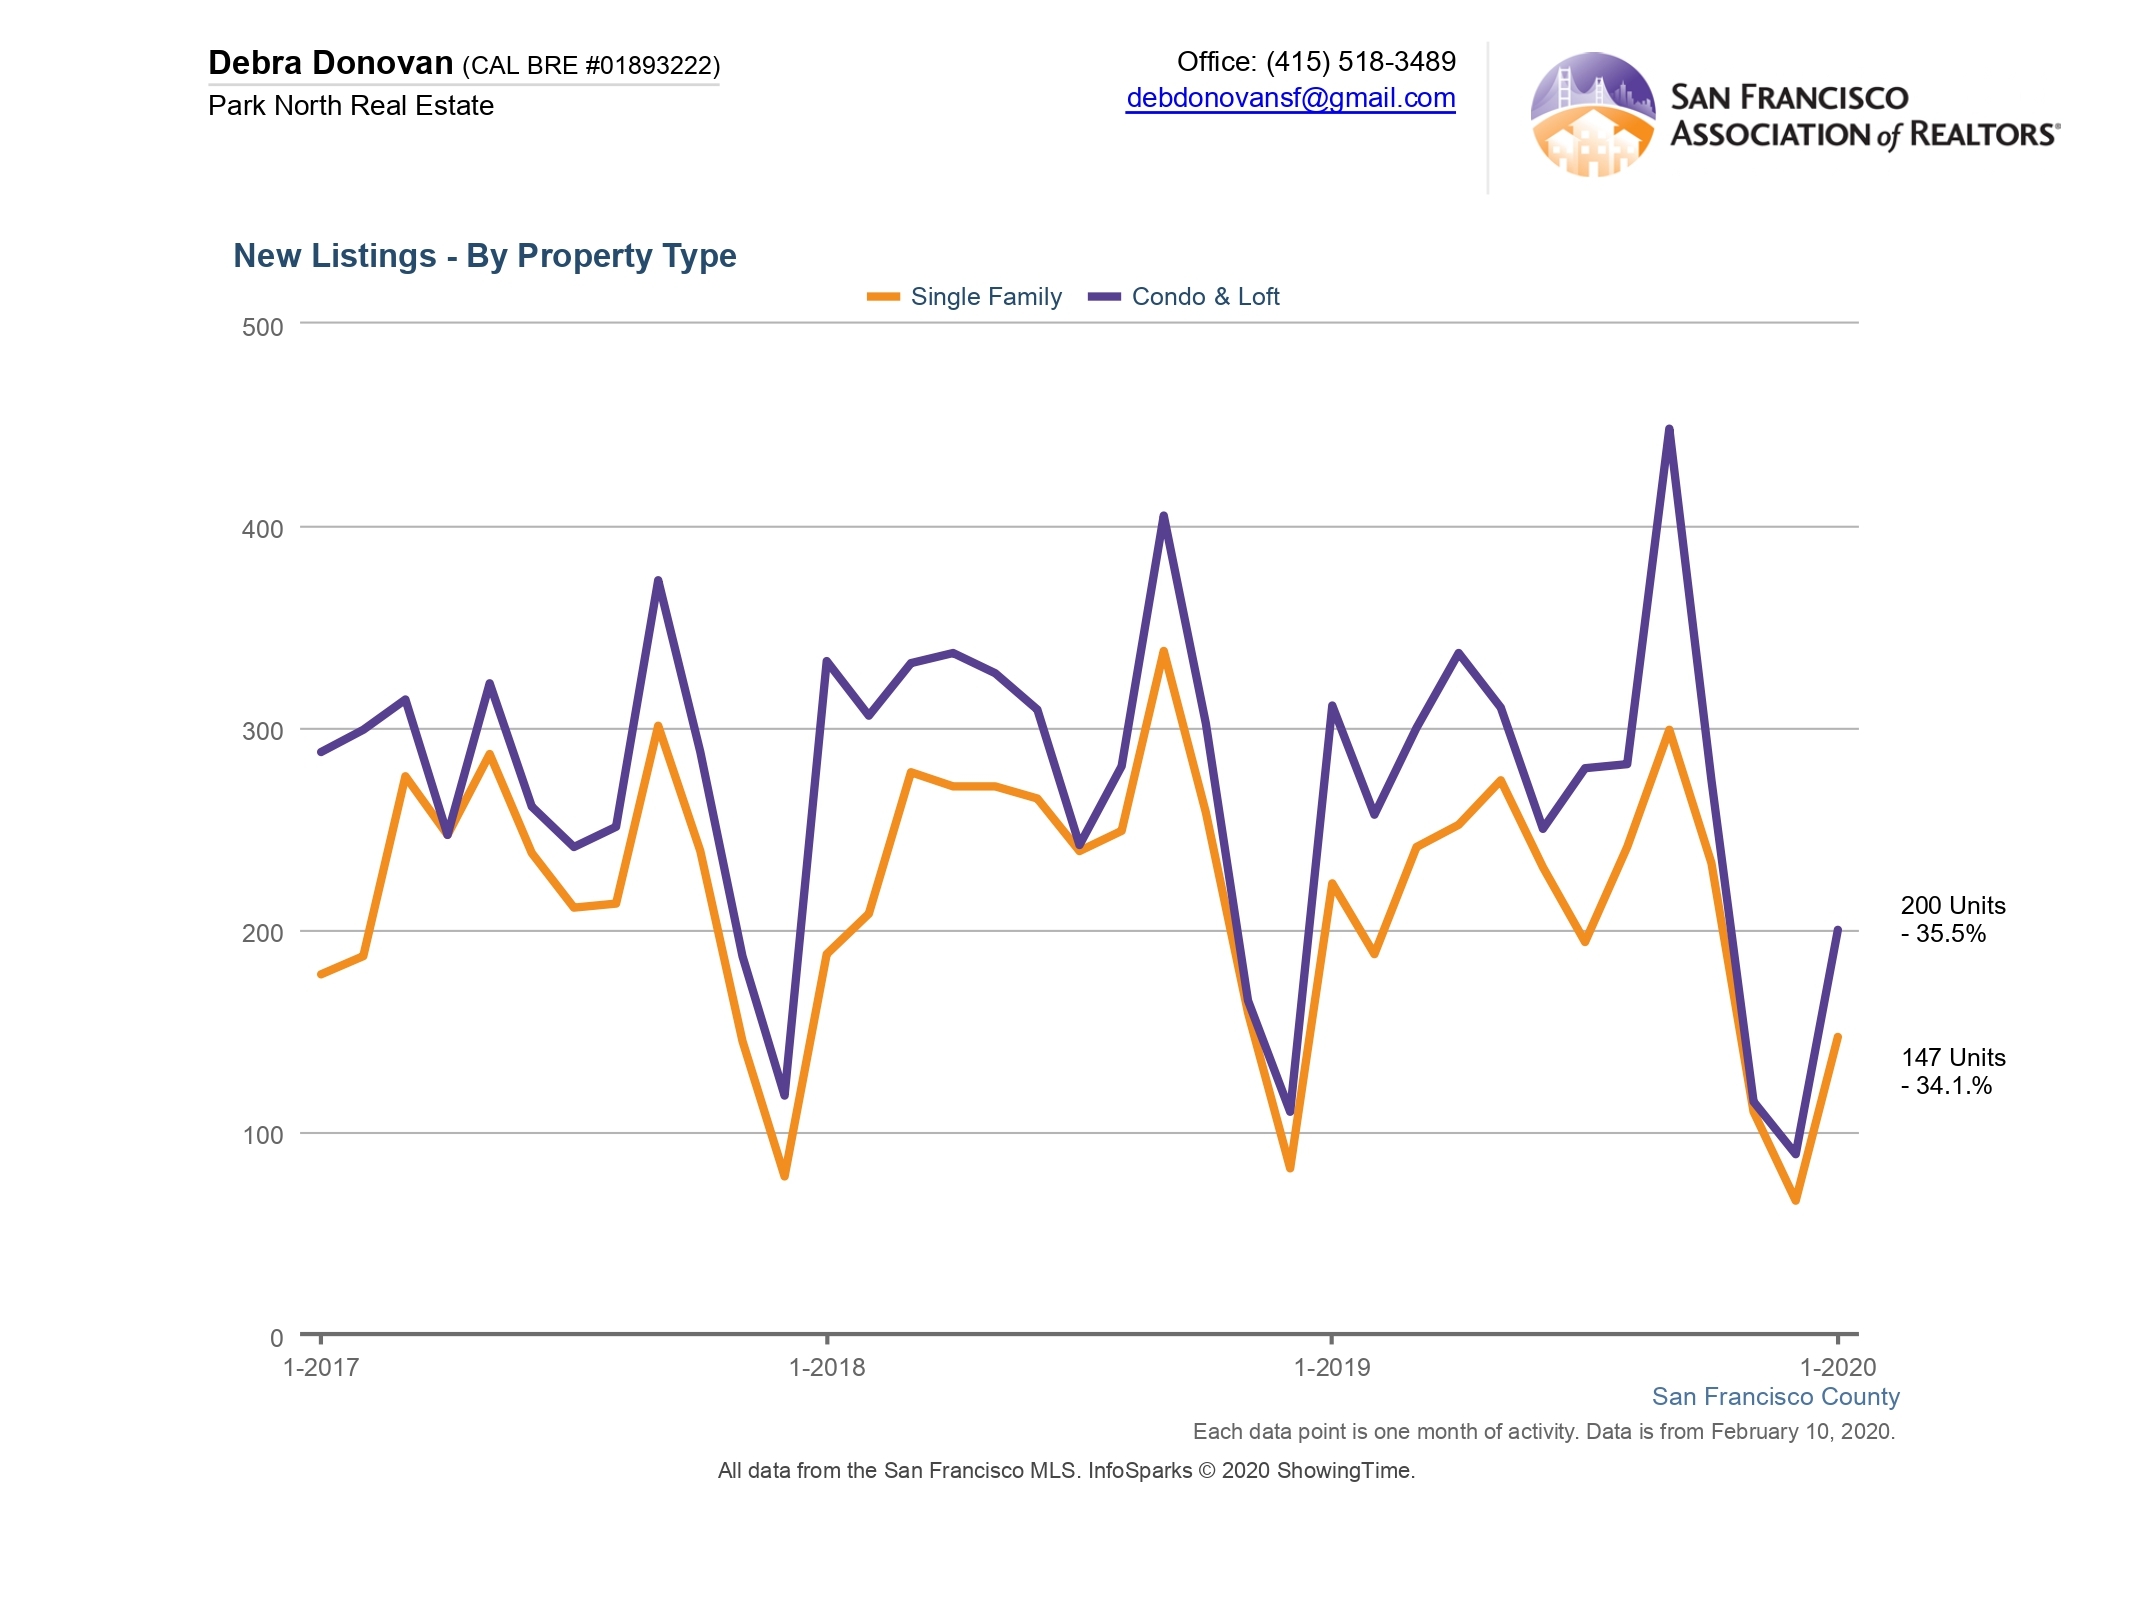
New Listings:
New listings for single family homes were down 34% compared to January 2019. Condos fared about the same, down almost 36% year-over-year.
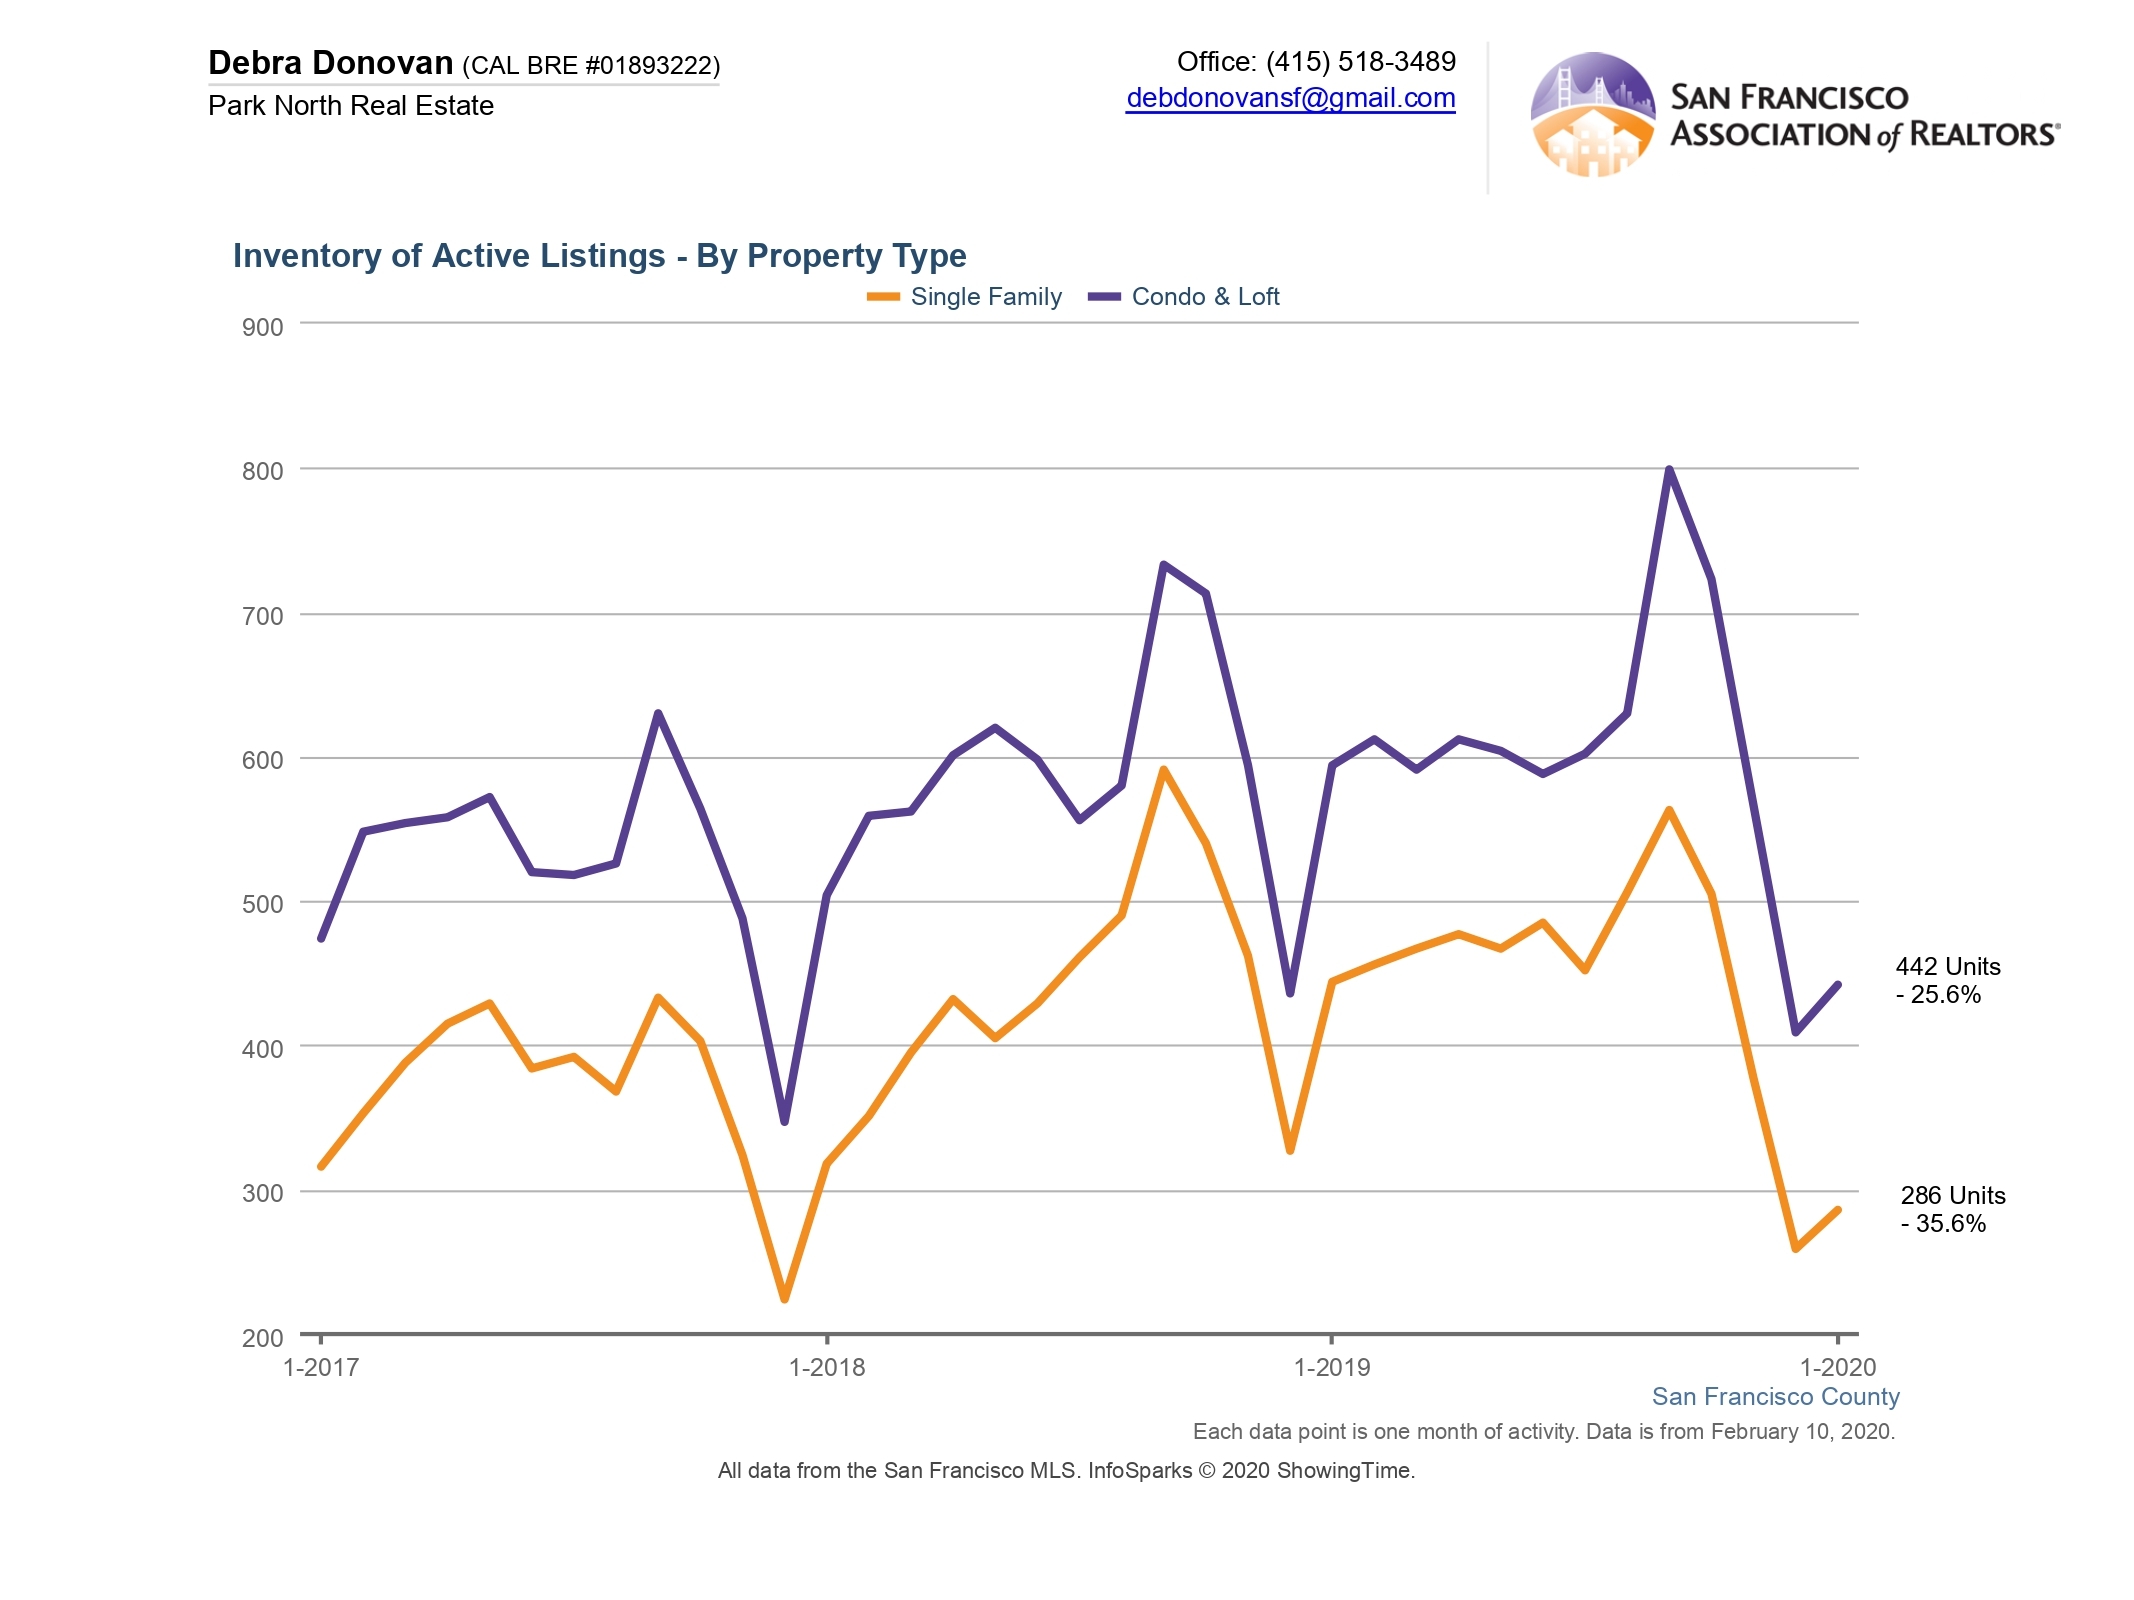
Active Listings:
Active listings are the number of listings still available at the end of the month. Like new listings, active listings for both single family homes and condos and lofts were down double-digits compared to last year. Single family homes were down over 35% while condos and lofts were down almost 26%.
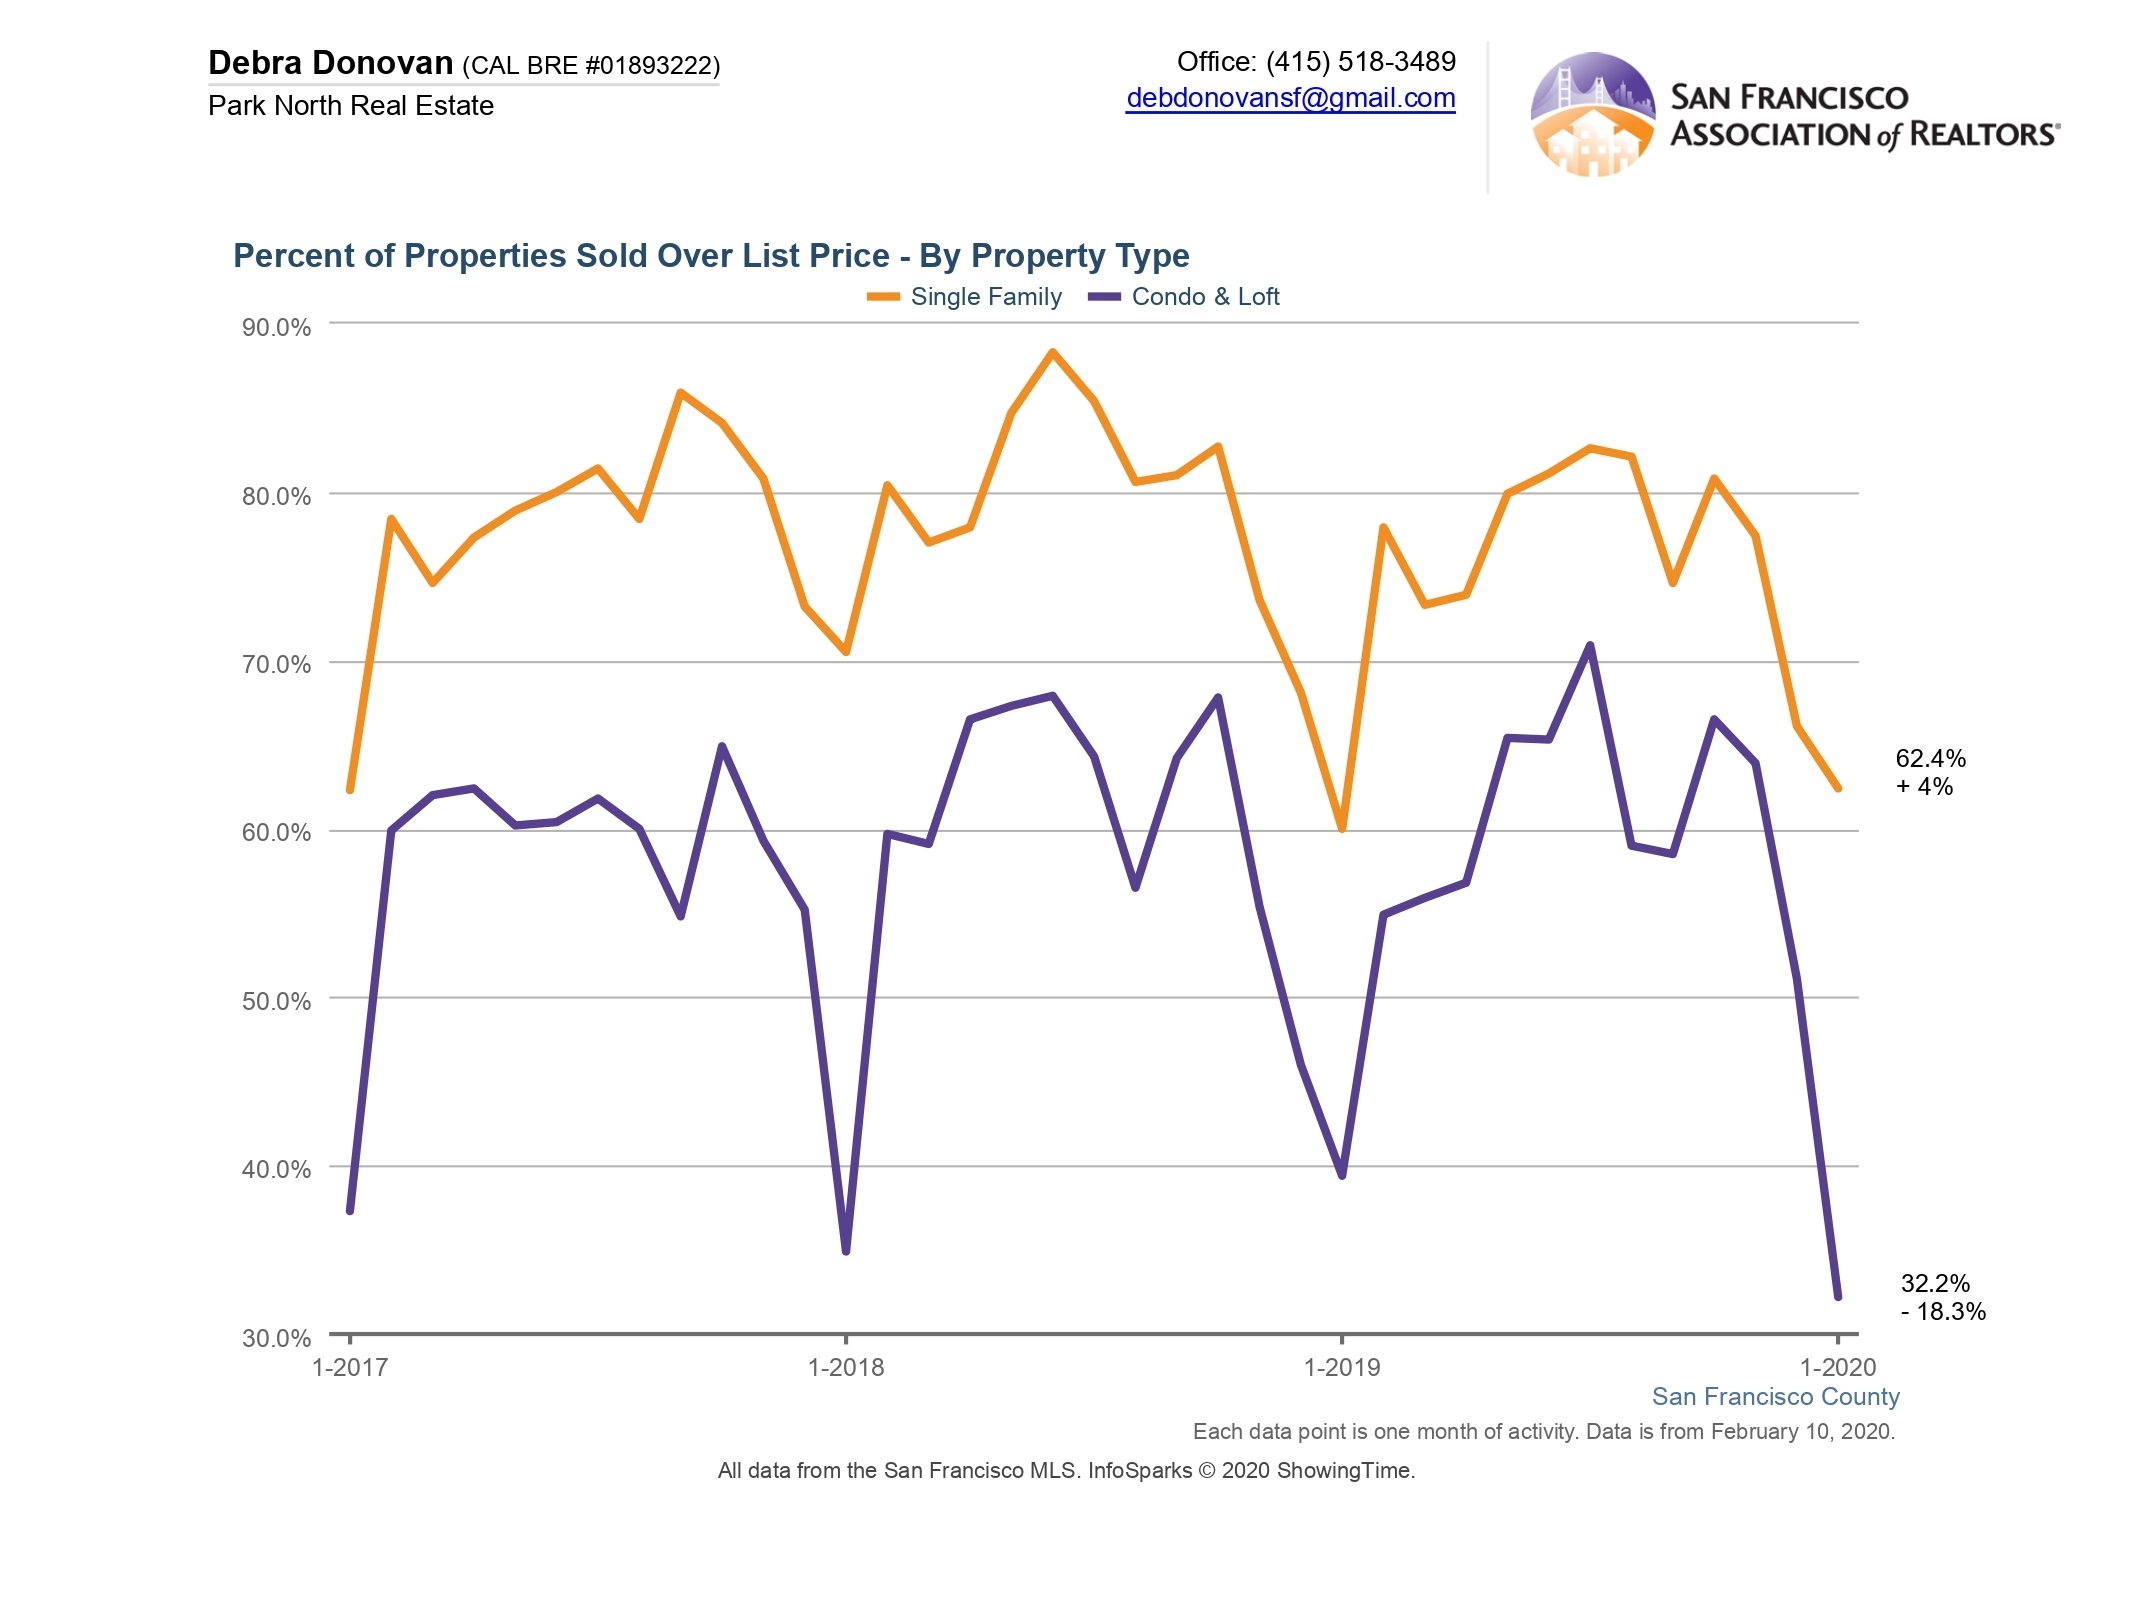
Percentage of Properties Sold Over List Price:
Sixty two percent of single family homes sold for over their list price in January, up 4% compared to the same month last year. Only about a third of condos and lofts sold over list price, down 18% compared to last January. New construction of condos in the past couple of years, the sales of which are usually not reported to MLS or included in these statistics, has given buyers more options to buy.
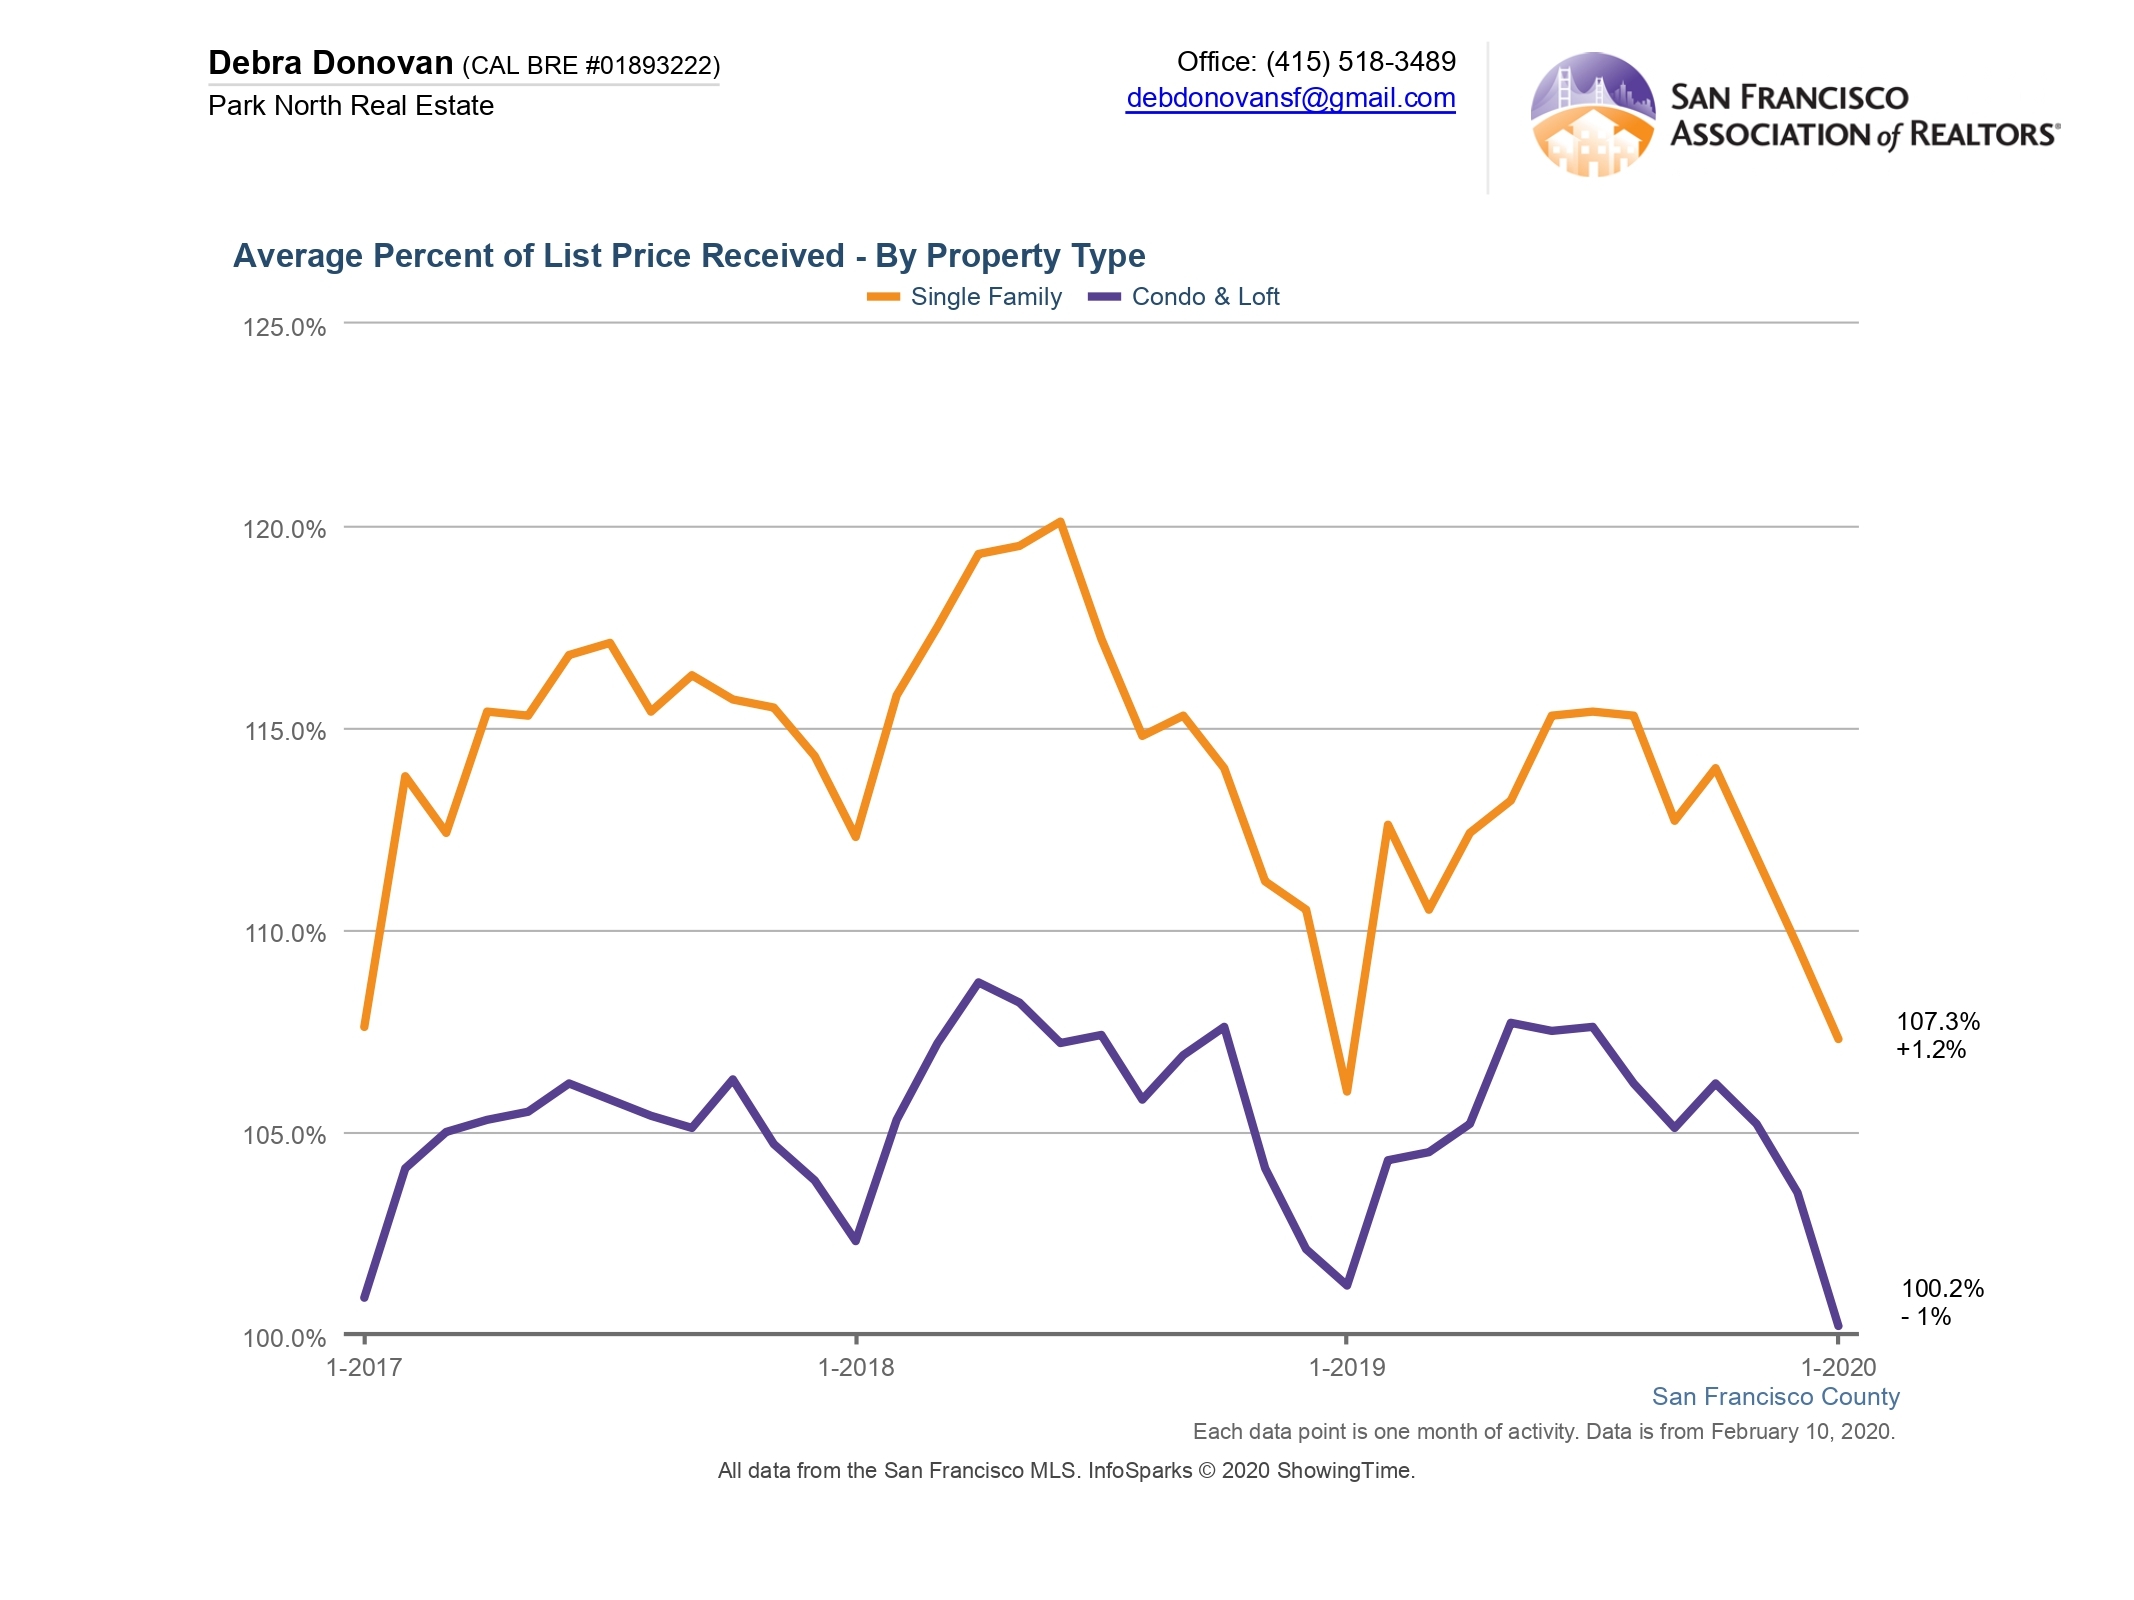
Average Percentage of Price Received:
Single family homes sold for an average of 7% over asking price in January, up just 1% compared to last January. Condos and lofts sold on average at list price, 100.2%, down just 1% from last year.
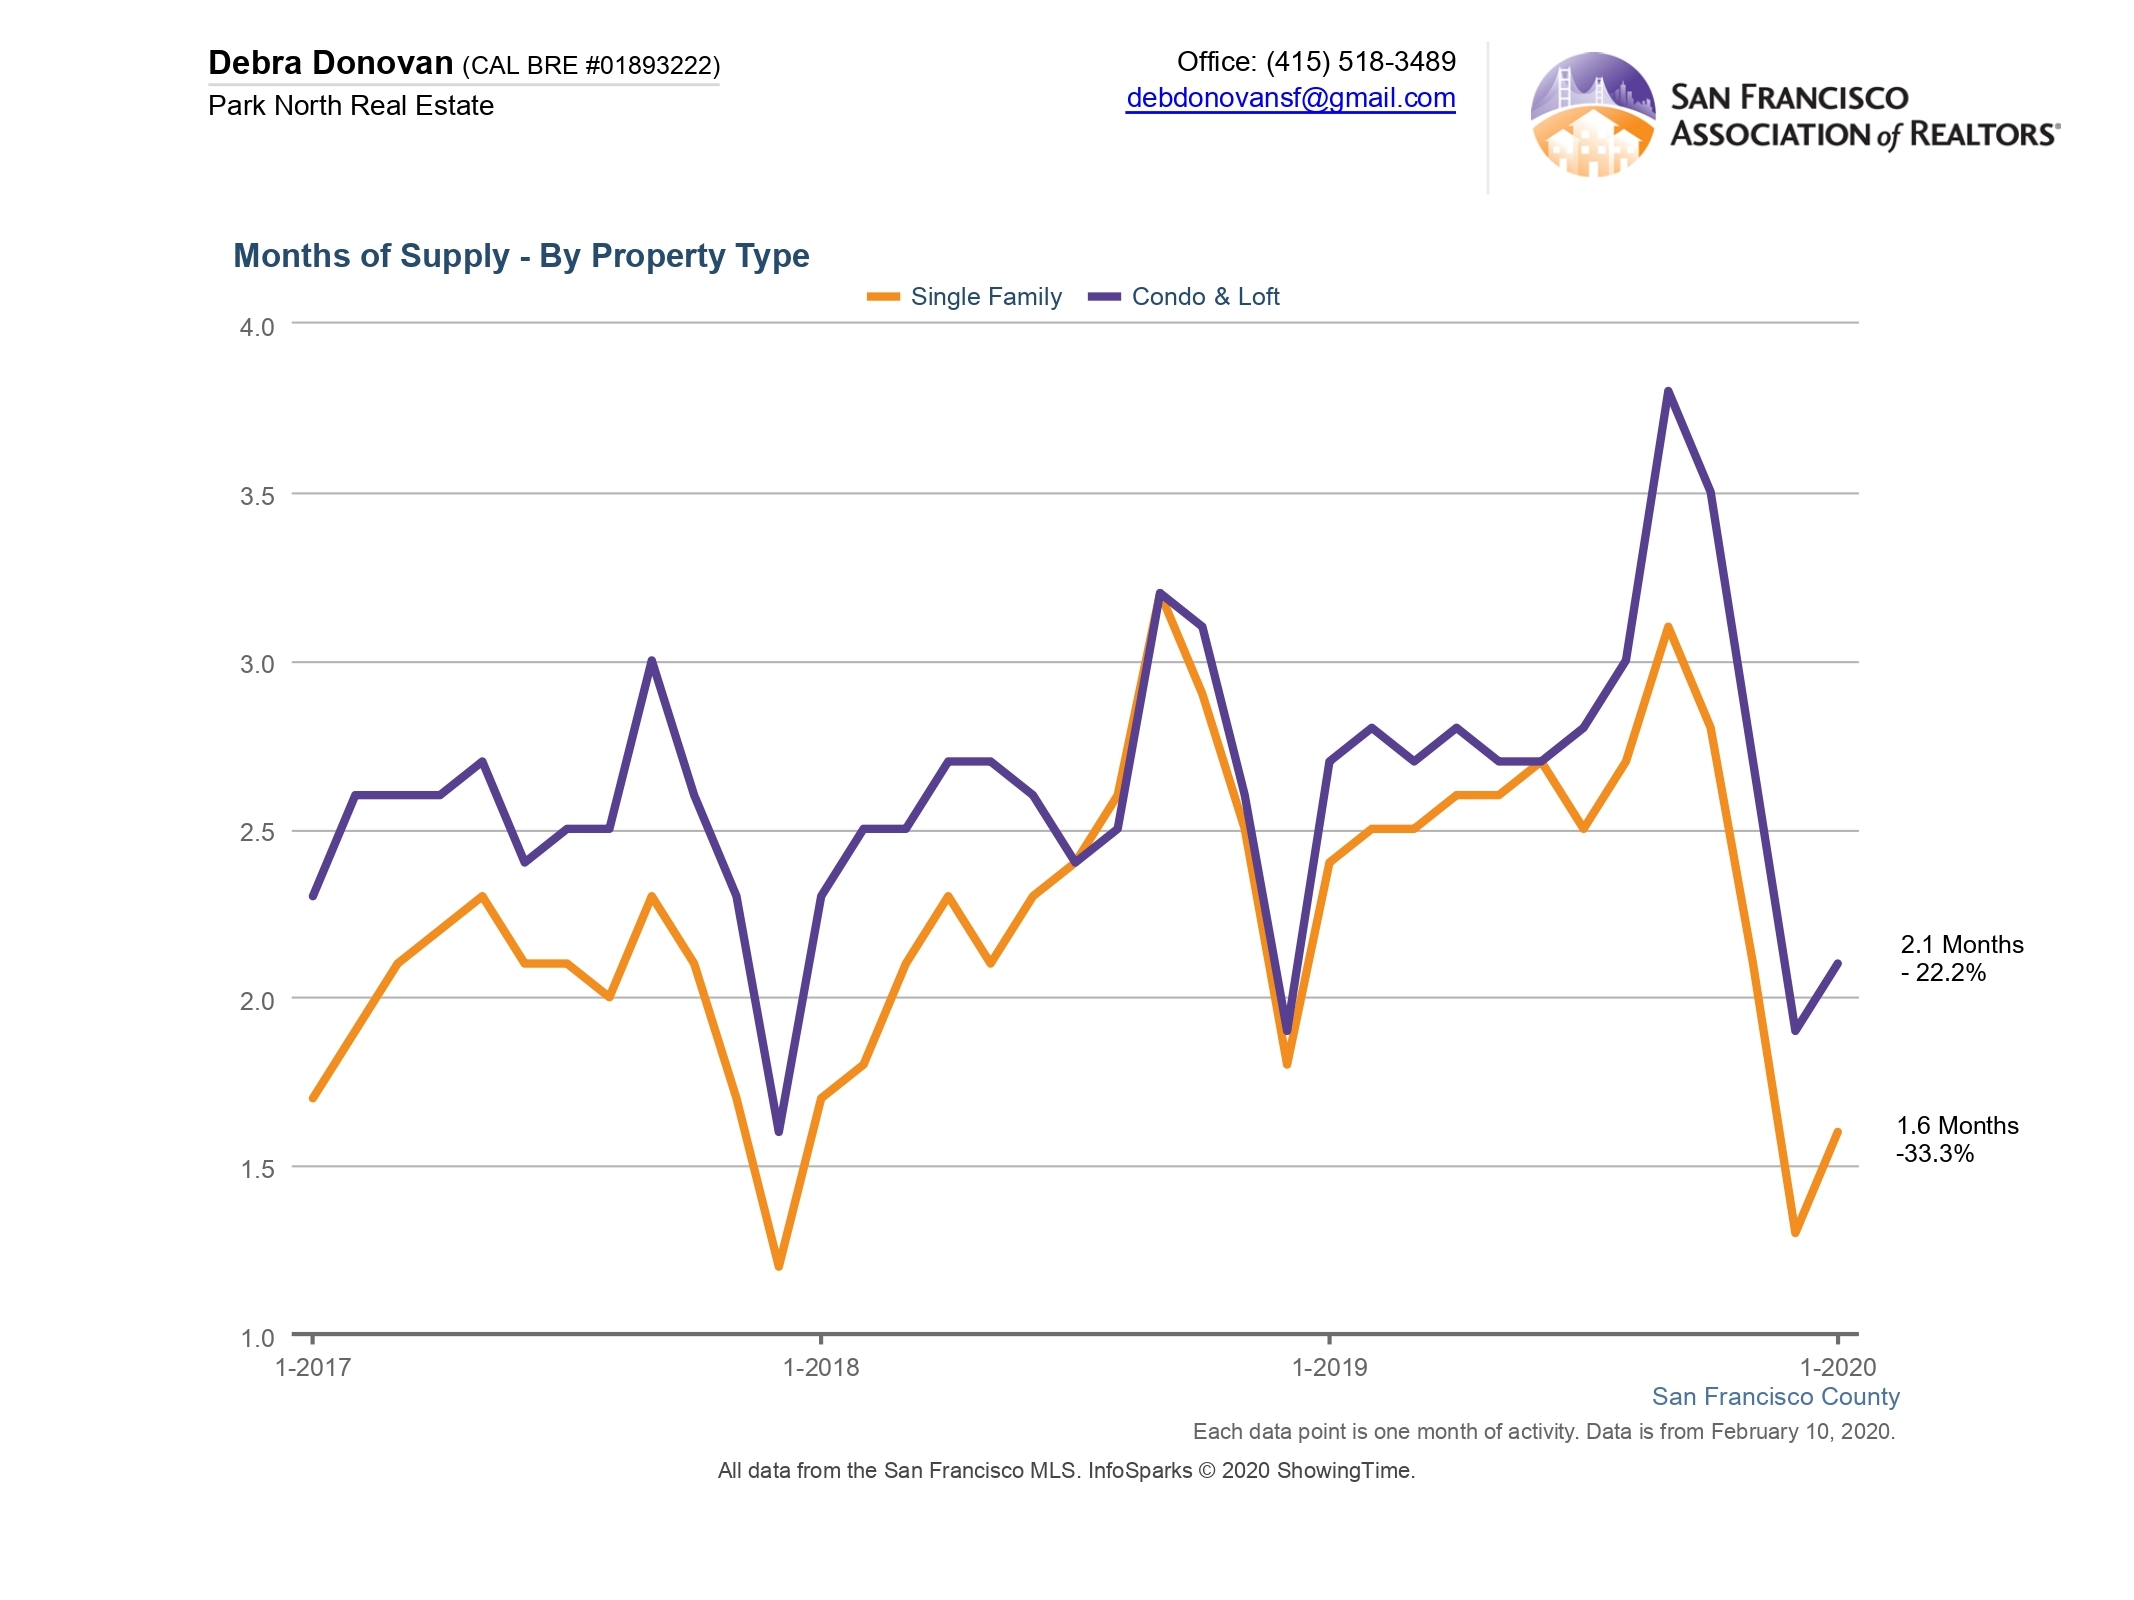
Month’s Supply of Inventory:
Single family homes for sale remain in scarce supply in San Francisco. In January there was only 1.6 months of inventory, down one-third compared to the same month last year. Condos and lofts had slightly more, 2.1 months, down 22% compared to January 2019.
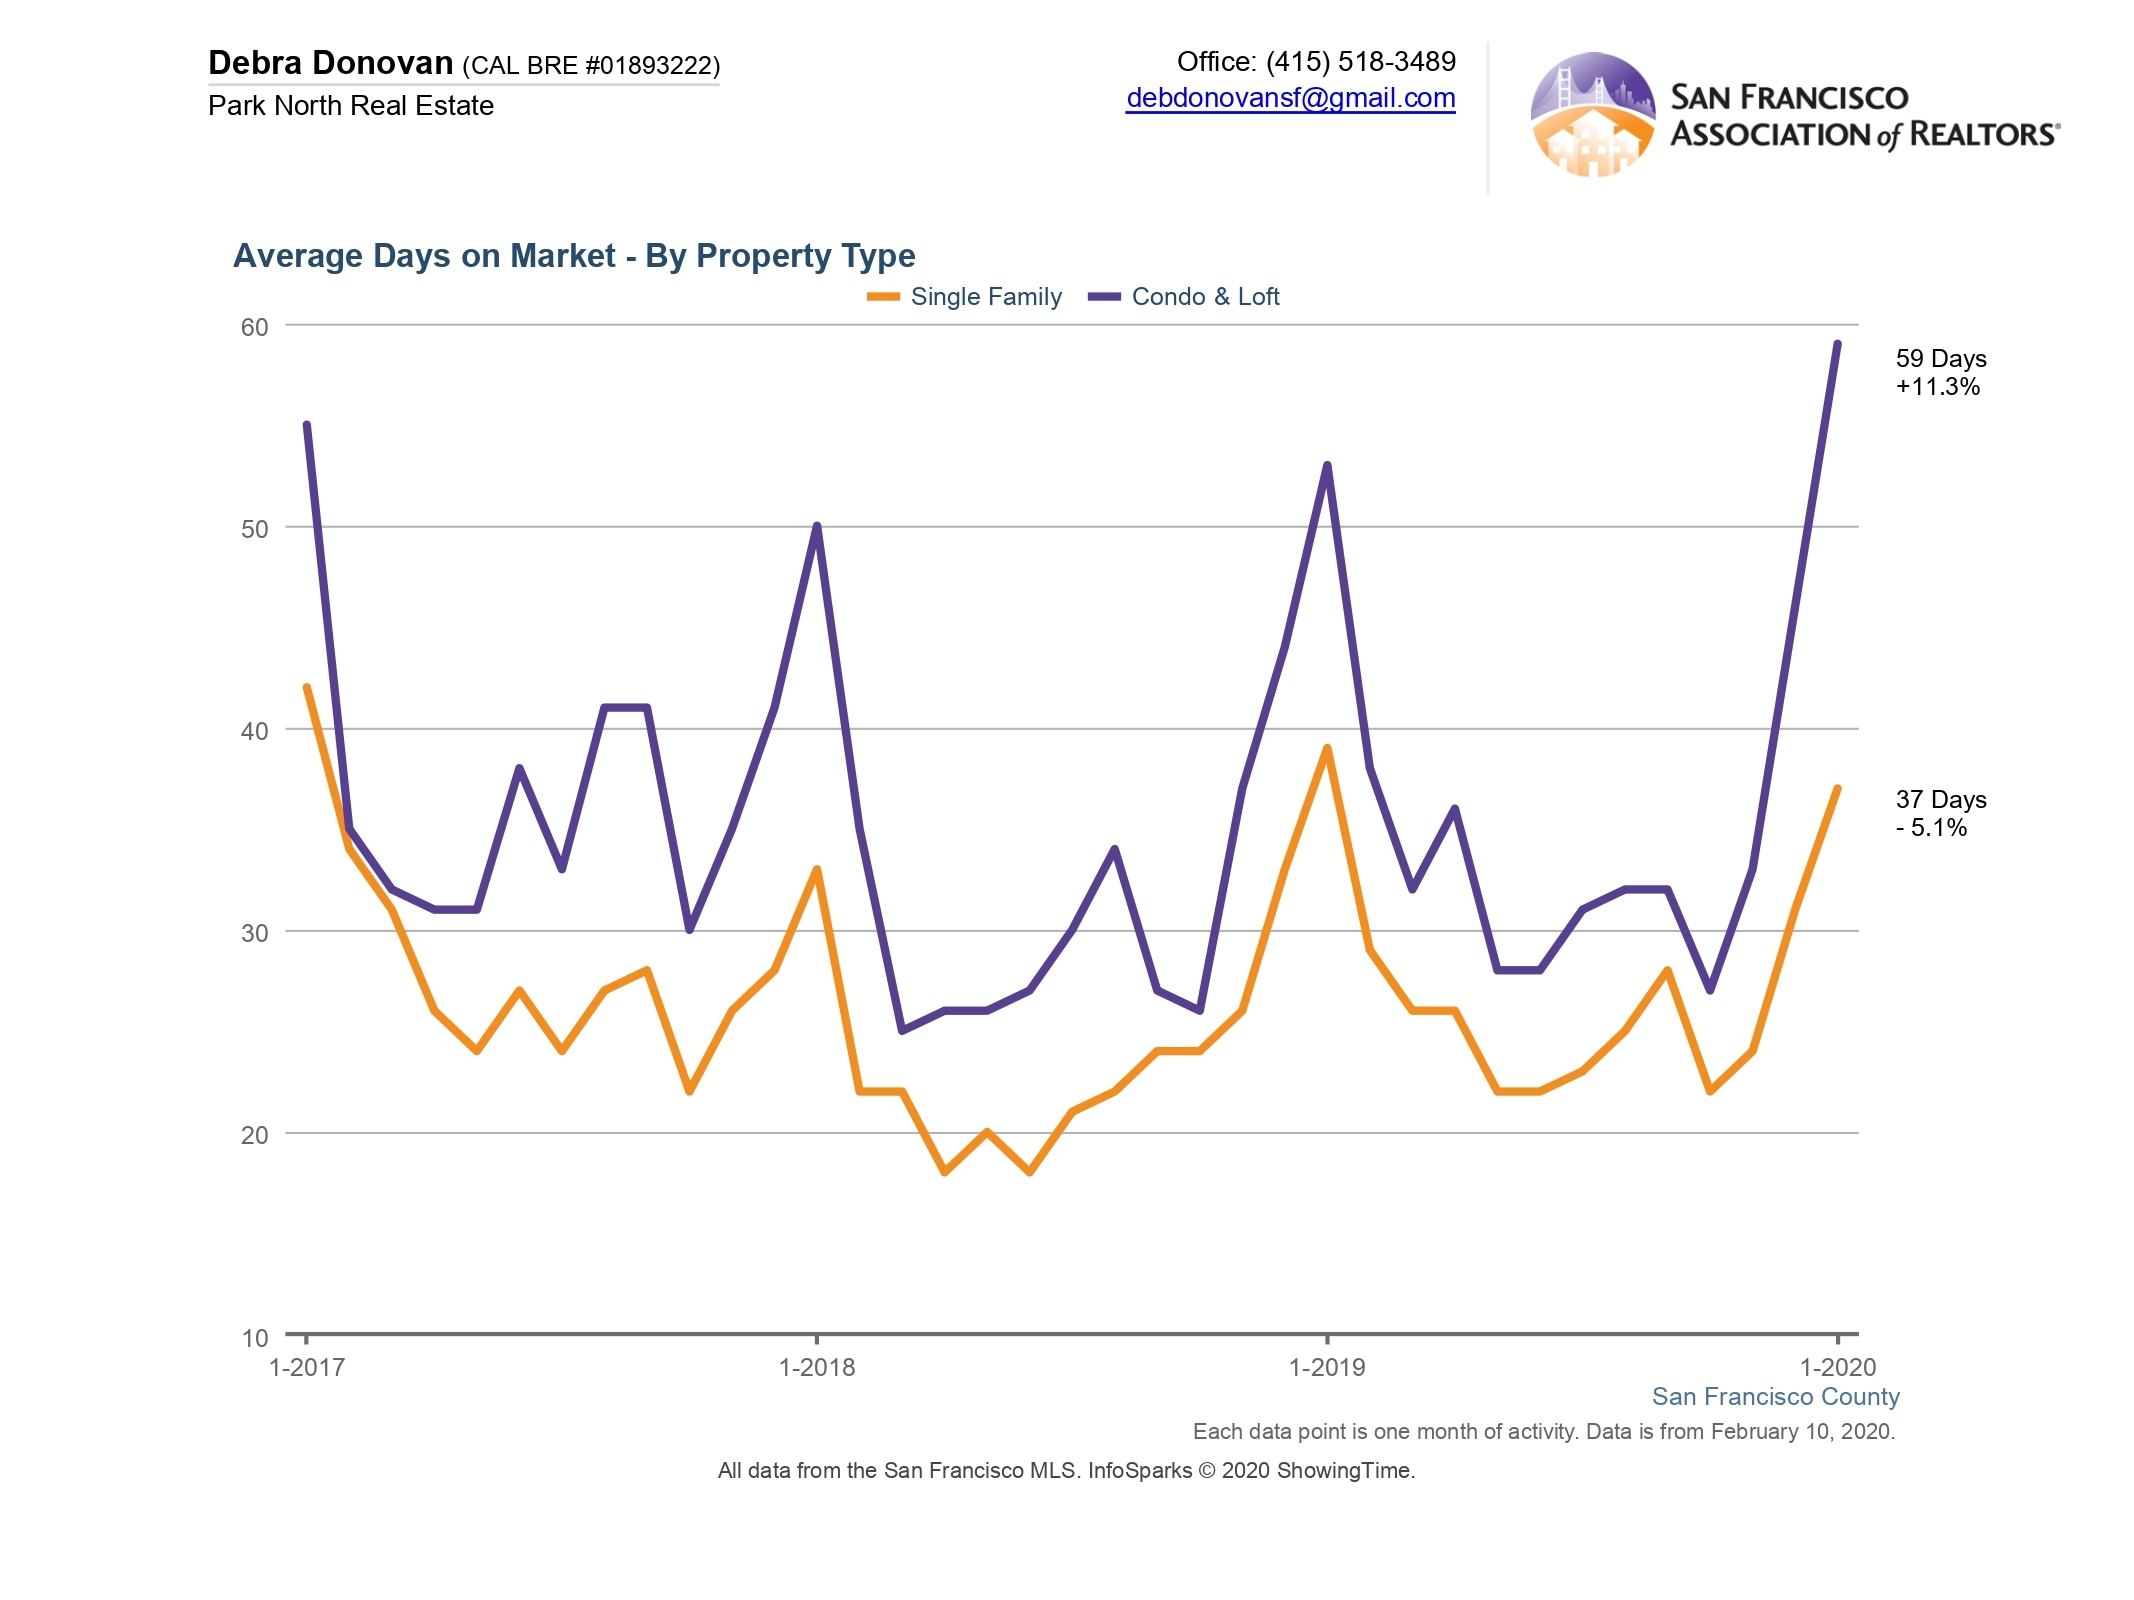
Average Days on Market:
Days on market refers to the number of days a property is on the market until an offer is accepted. Single family homes spent an average of 37 days on the market in January, down 5% compared to last year. Condos and lofts spent 59 days on market on average, up 11%.
The fine print: All information deemed reliable but not guaranteed or warranted. Data comes from MLS so does not include off-market and most new construction condo sales. The San Francisco real estate market is dynamic so statistics can change on a daily basis. These statistics are meant to be a snapshot of the day and time they were pulled.