Data for the first half of 2025 in the San Francisco real estate market looks much rosier than those in the the first quarter. Sales picked up in the second quarter due to increases in the number of new listings and the number of sold listings. Spring is typically the time that more buyers come to the market and more listings are put on the market. Summer tends to slow again and then the market picks up again in Fall. For the most part, the first half numbers are up due to a lift in Spring sales.
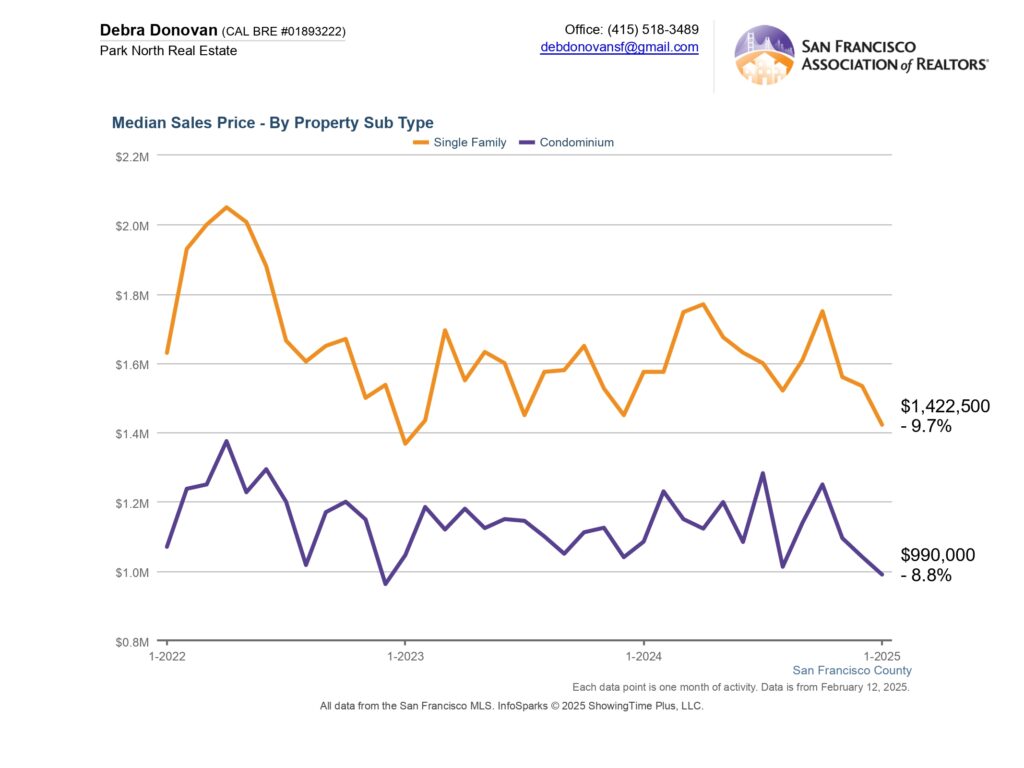
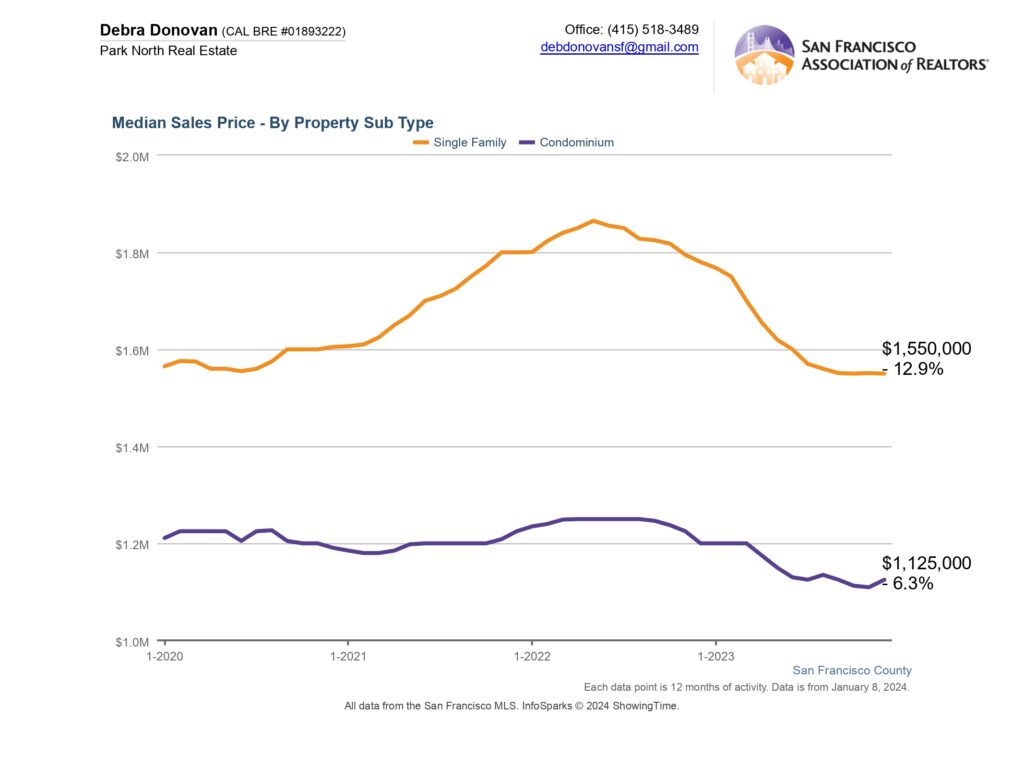
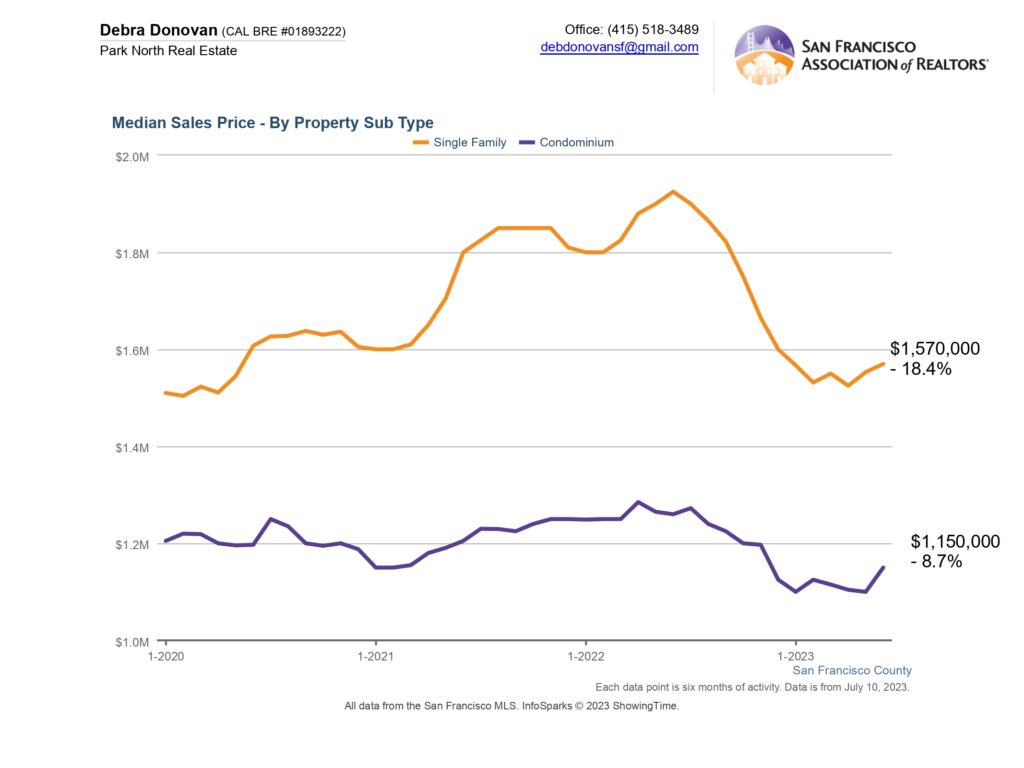
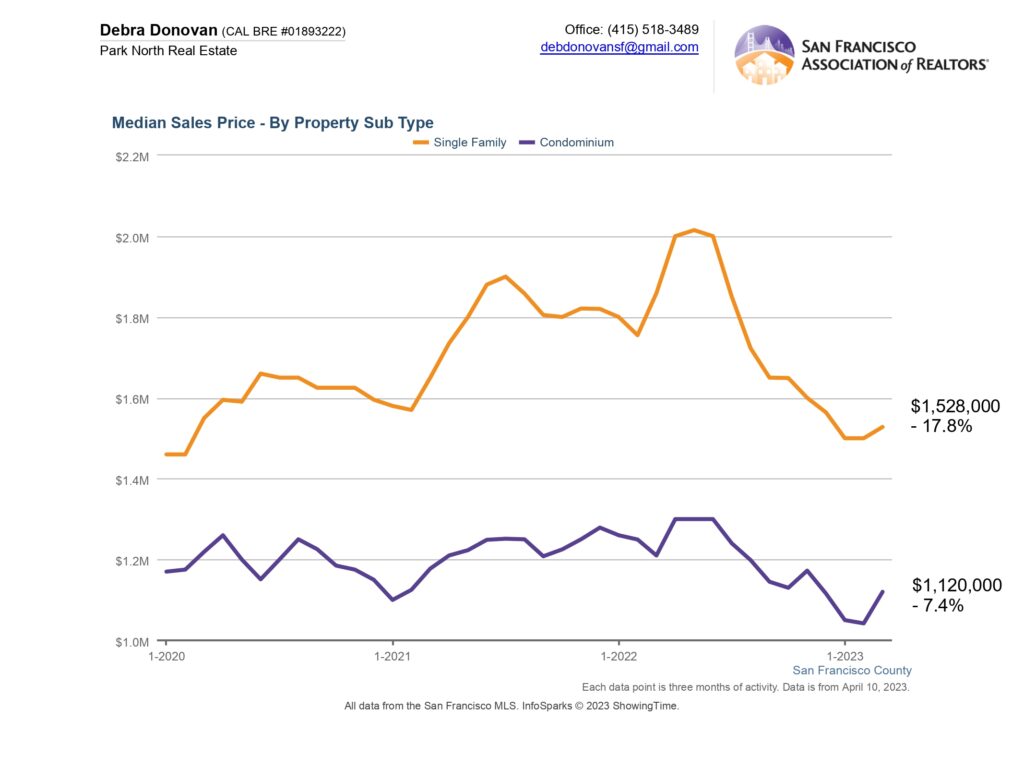
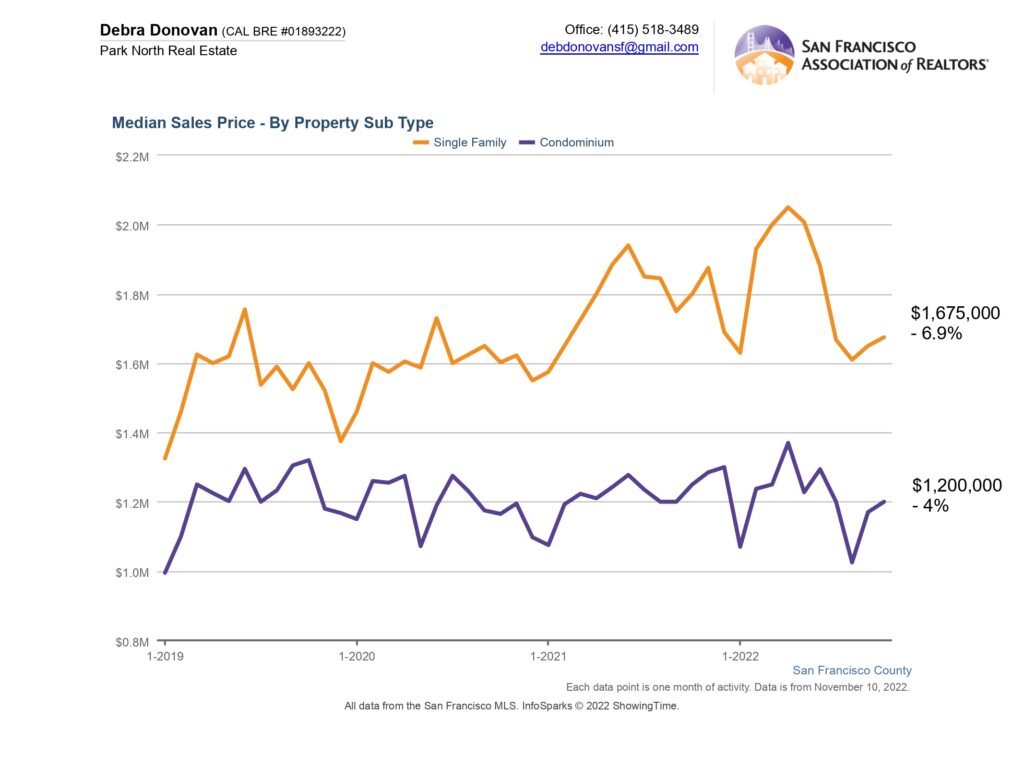
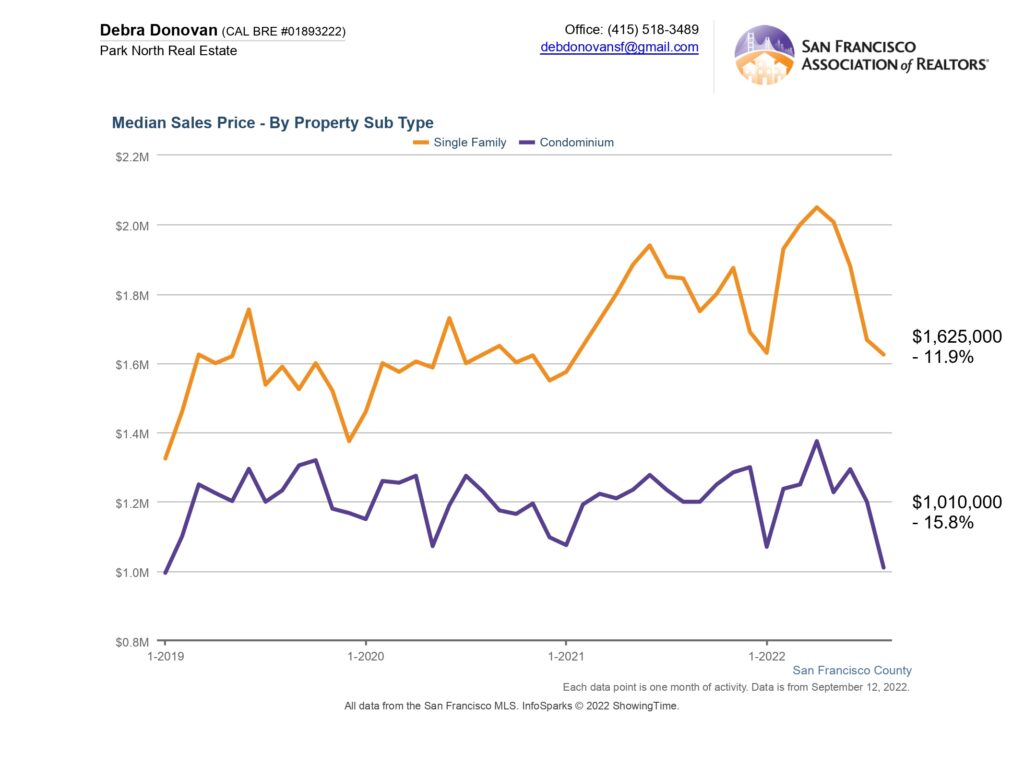
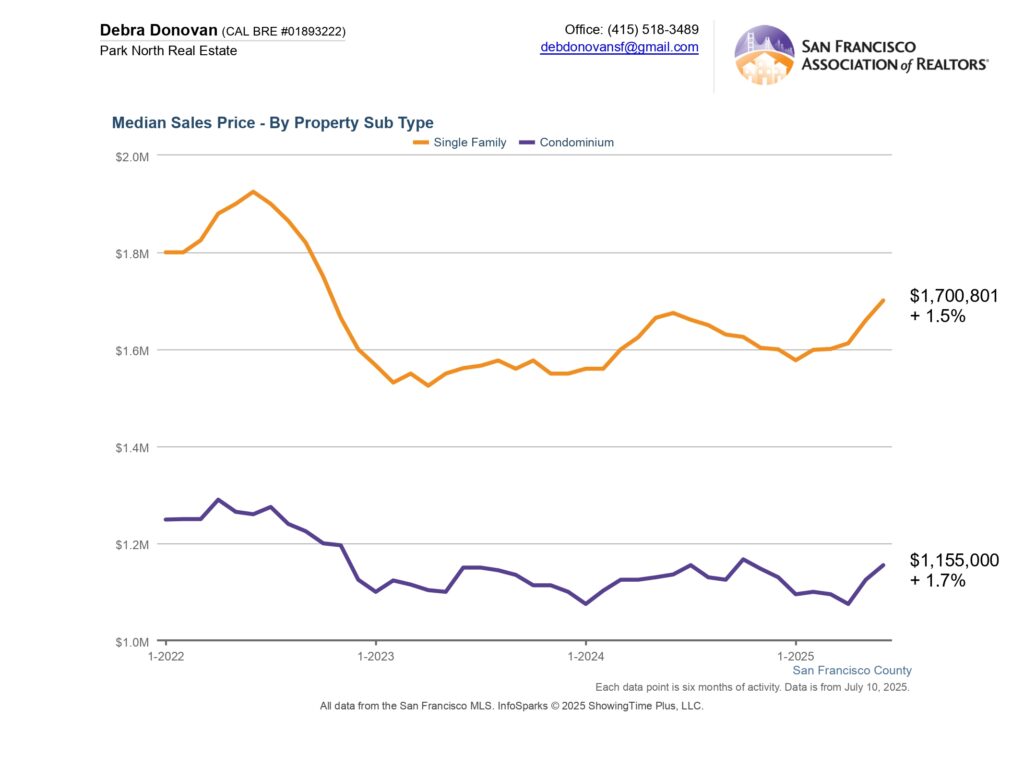
Median Price:
Single family homes remain the holy grail with quick sales and over-asking bidding wars. Overall prices are up but that is largely due to a lift in Q2 pricing. Condos prices also increased year over year by about 10% in the second quarter, lifting condo prices for the first half overall up 1.7%.
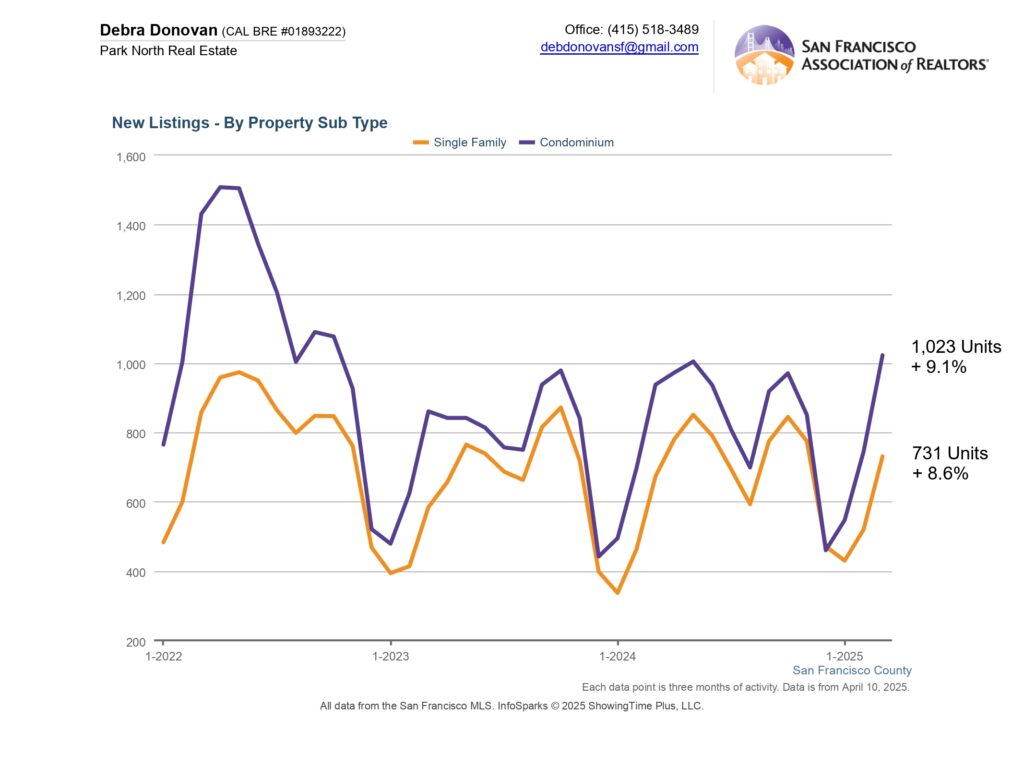
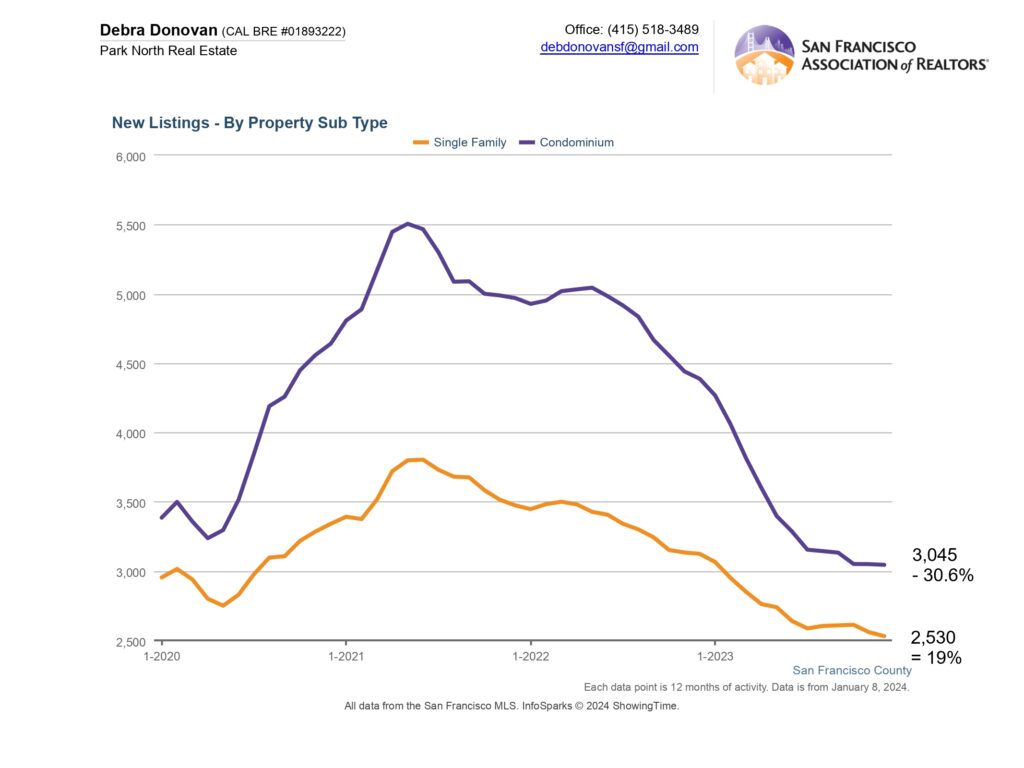
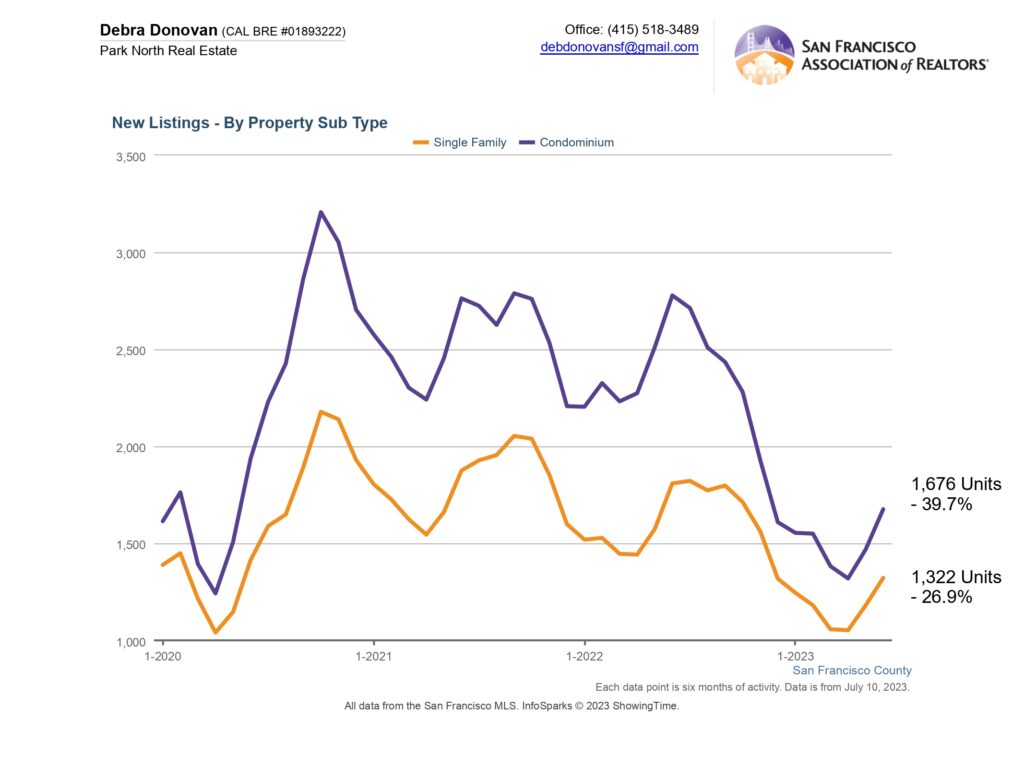
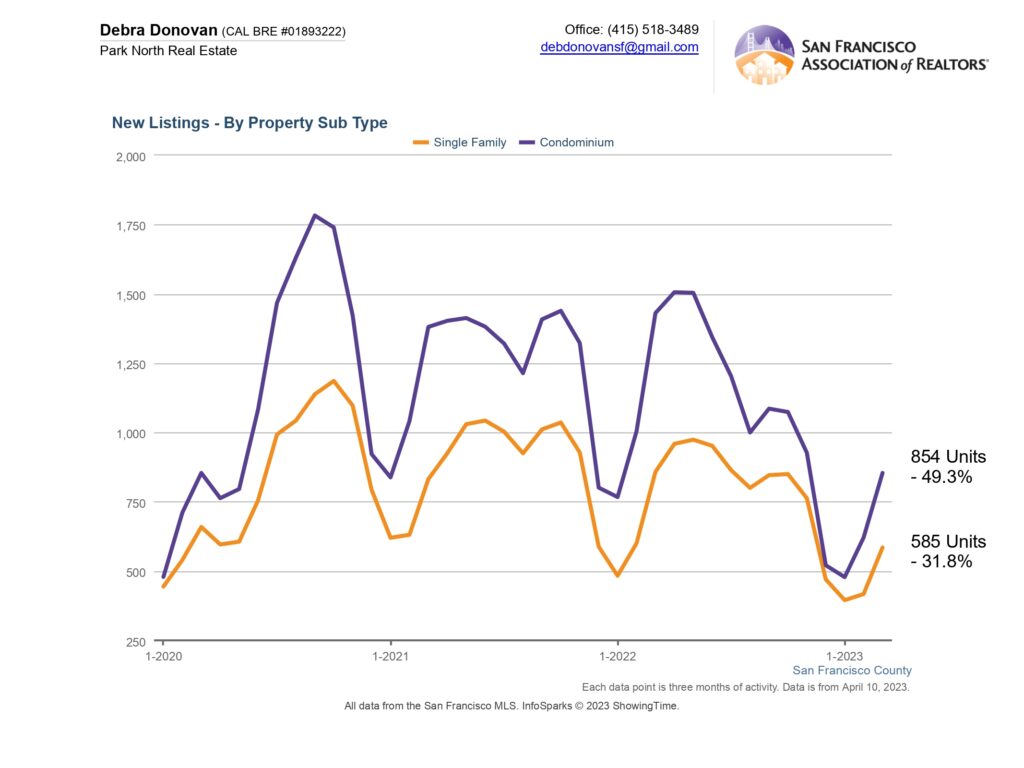
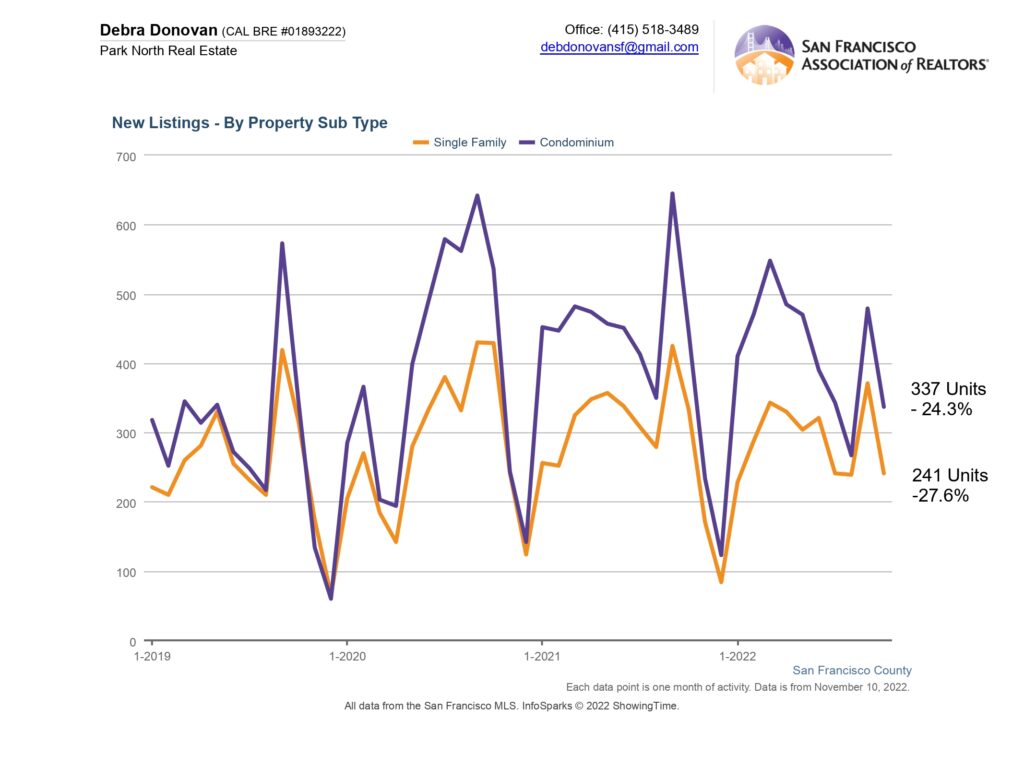
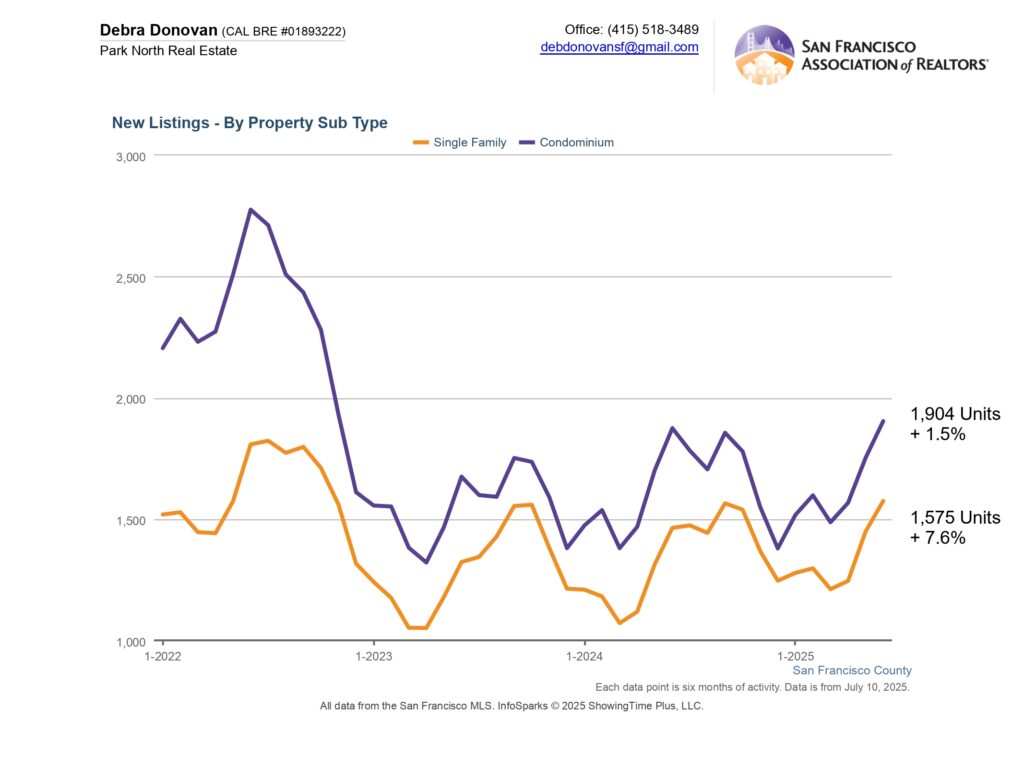
New Listings:
New listings were up overall for the first half of 2025 compared to the same time frame last year. Single family homes saw an almost 8% lift in new listings, while new condo listings also increased 1.5%.
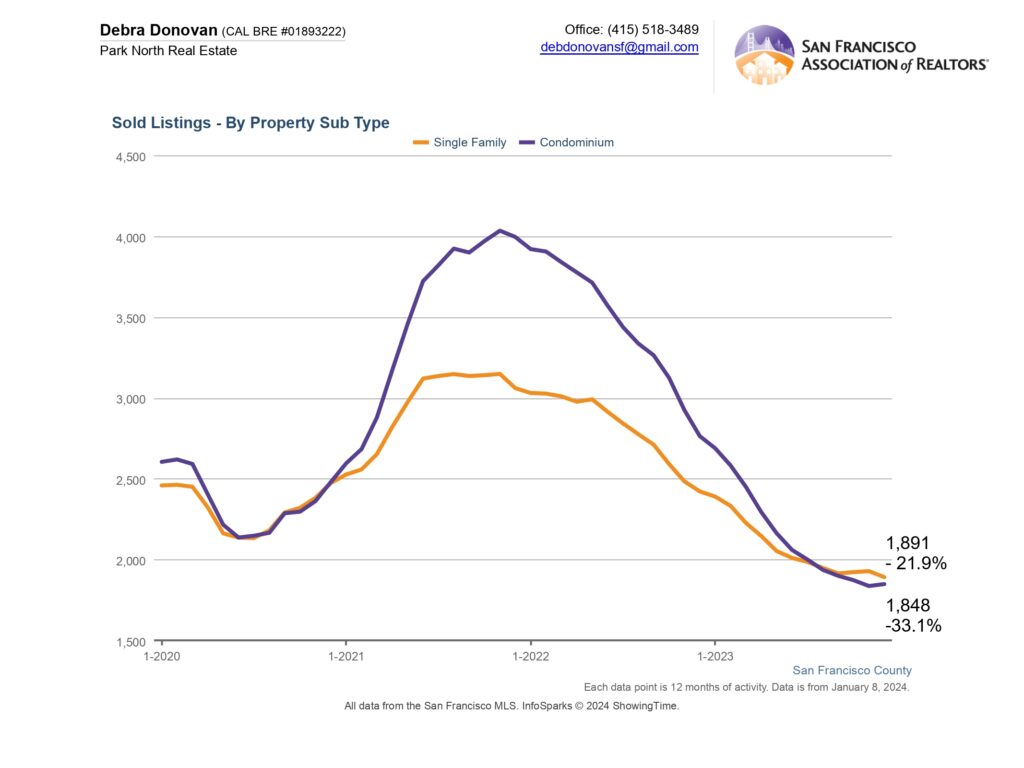
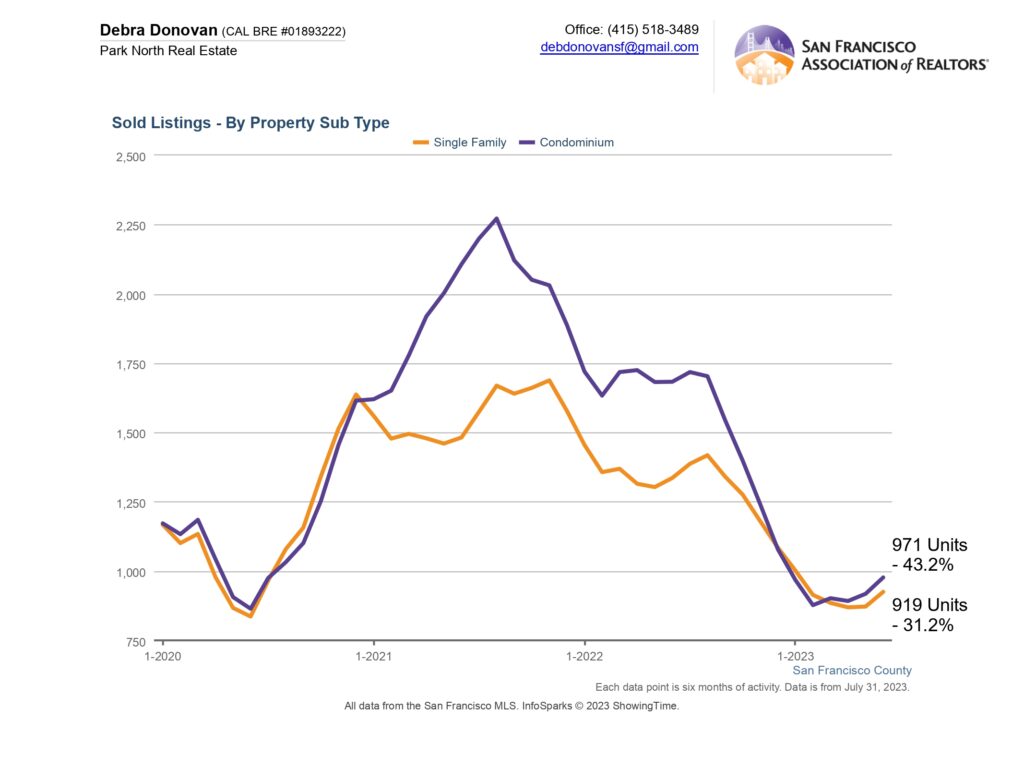
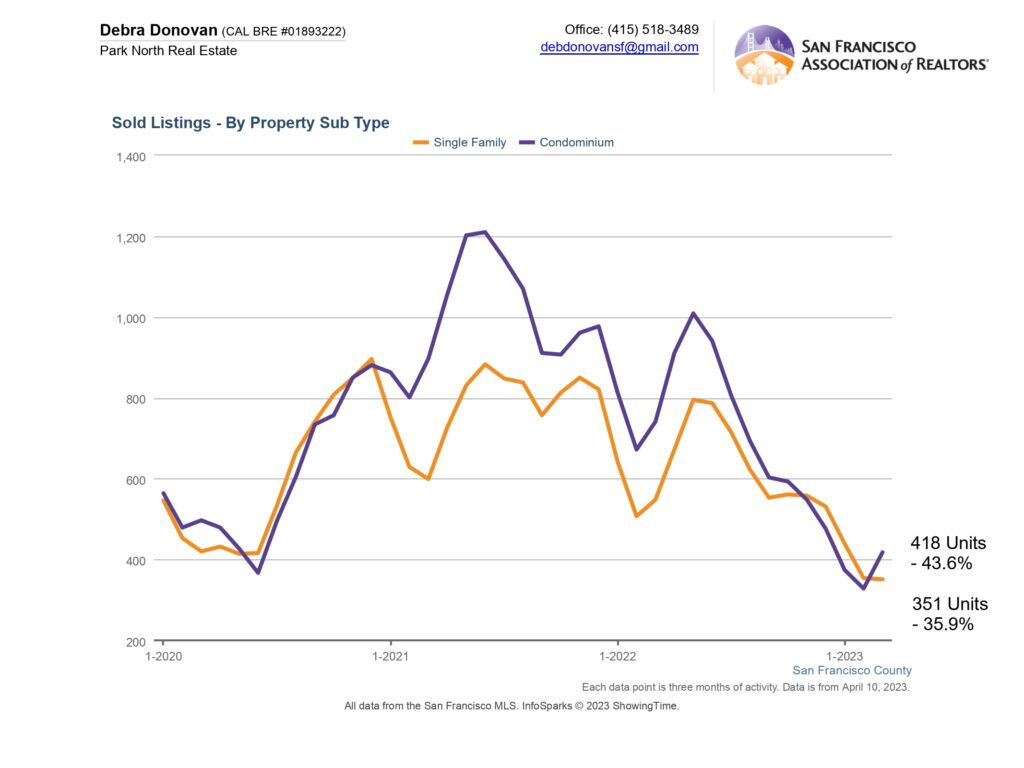
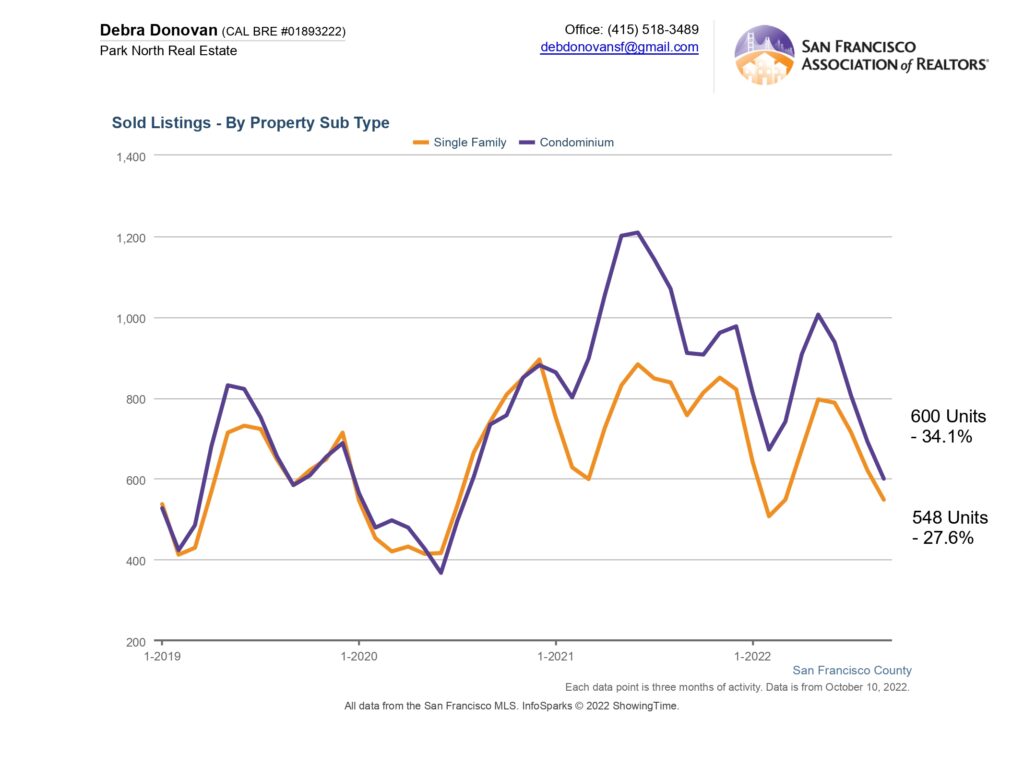
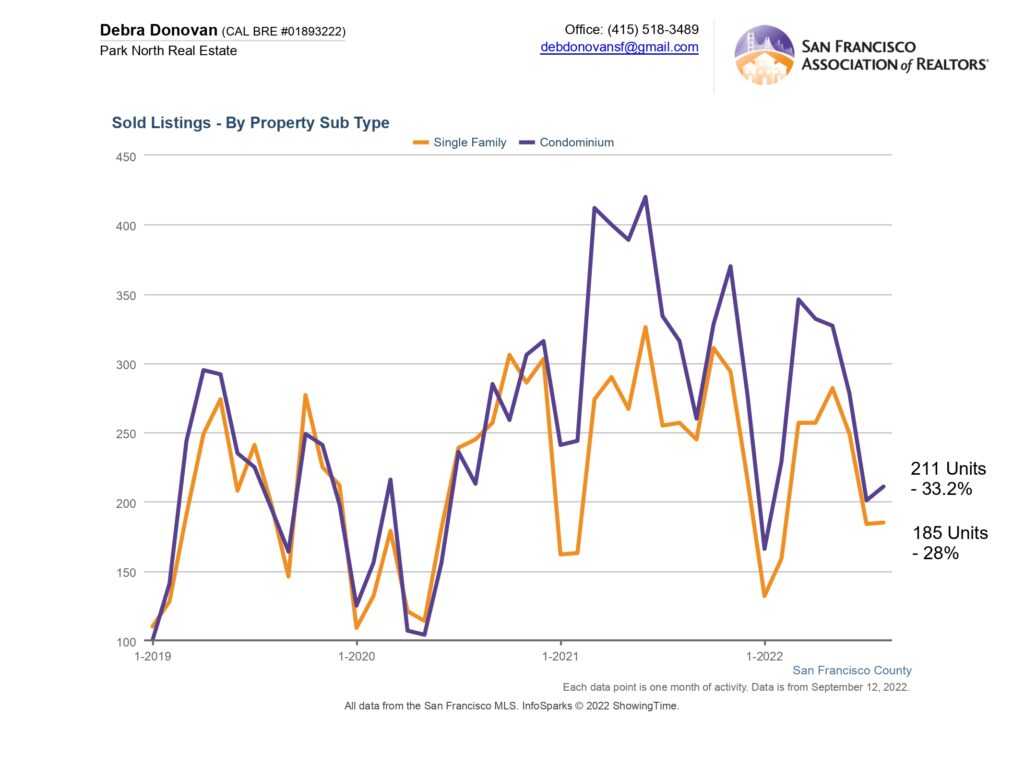
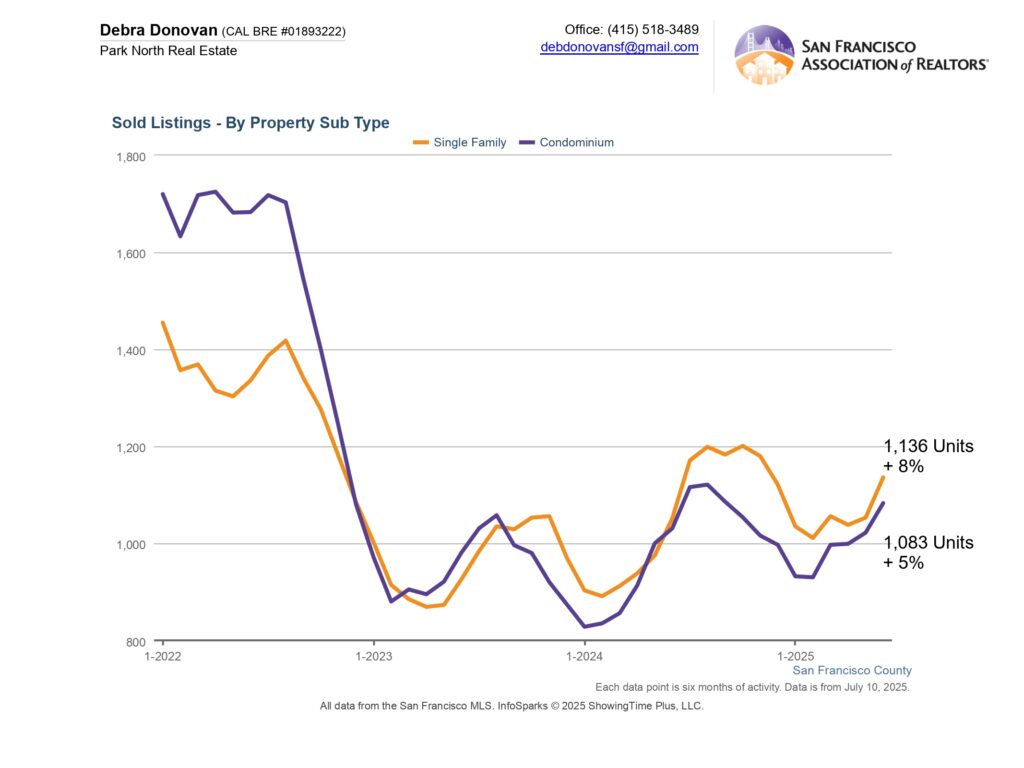
Sold Listings:
The number of single family home sales increased 8% for the first half of 2025 compared to last year. Sold condo listings increased 5%, another indication of the condo market slowly coming back to life.
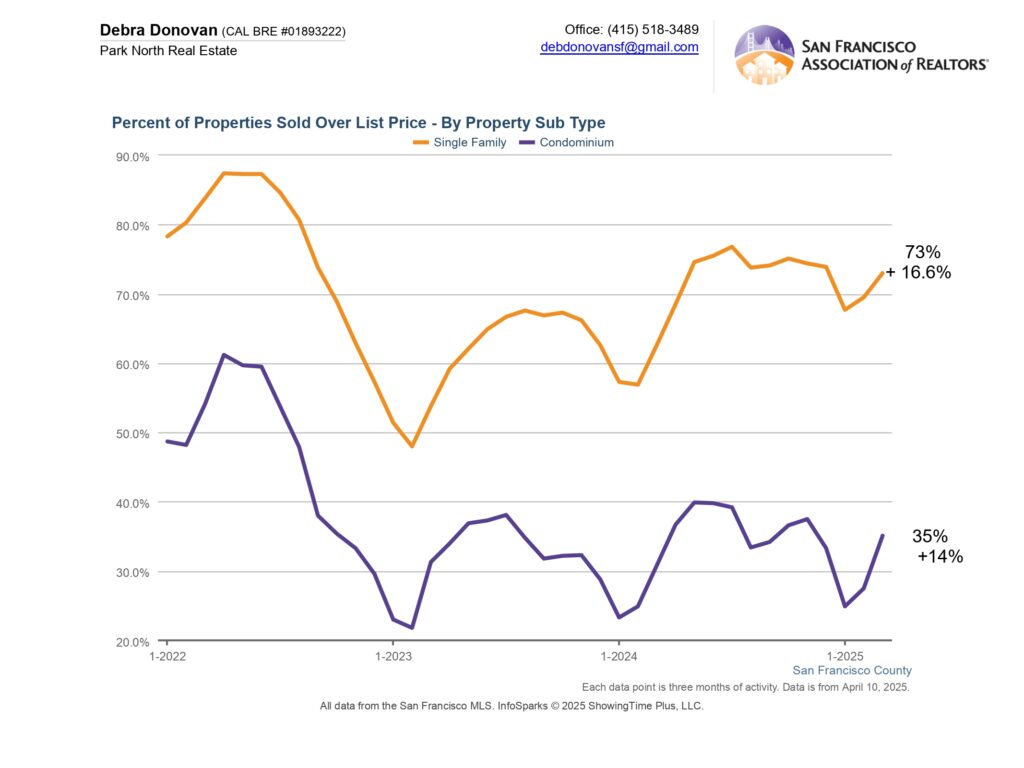
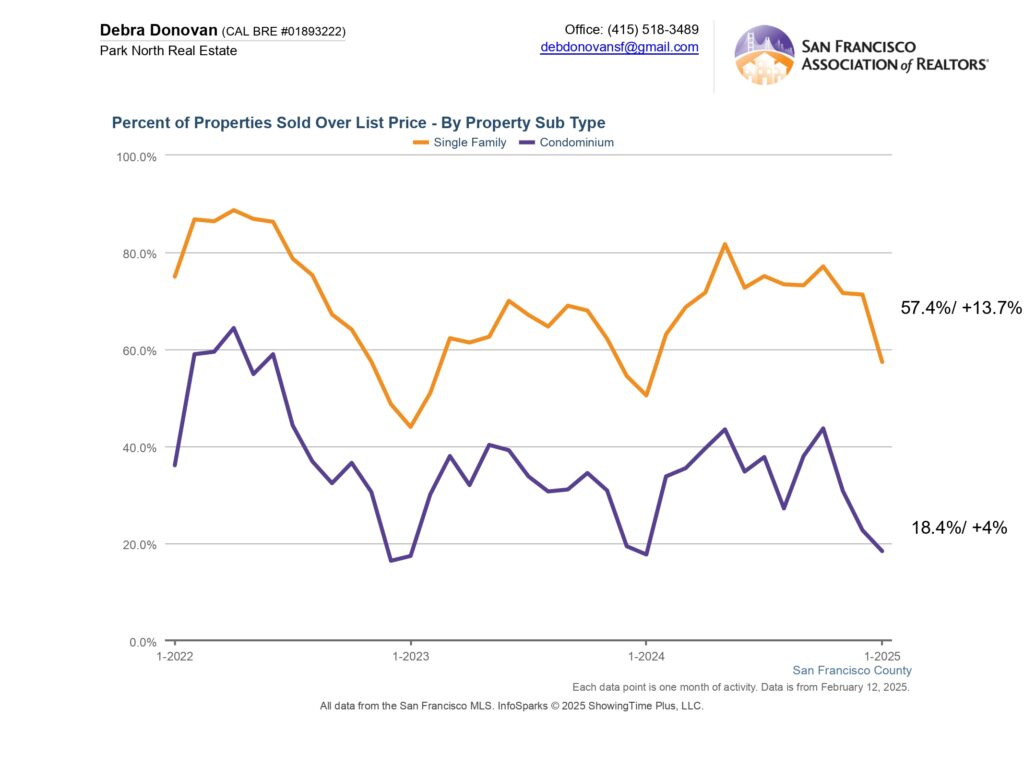
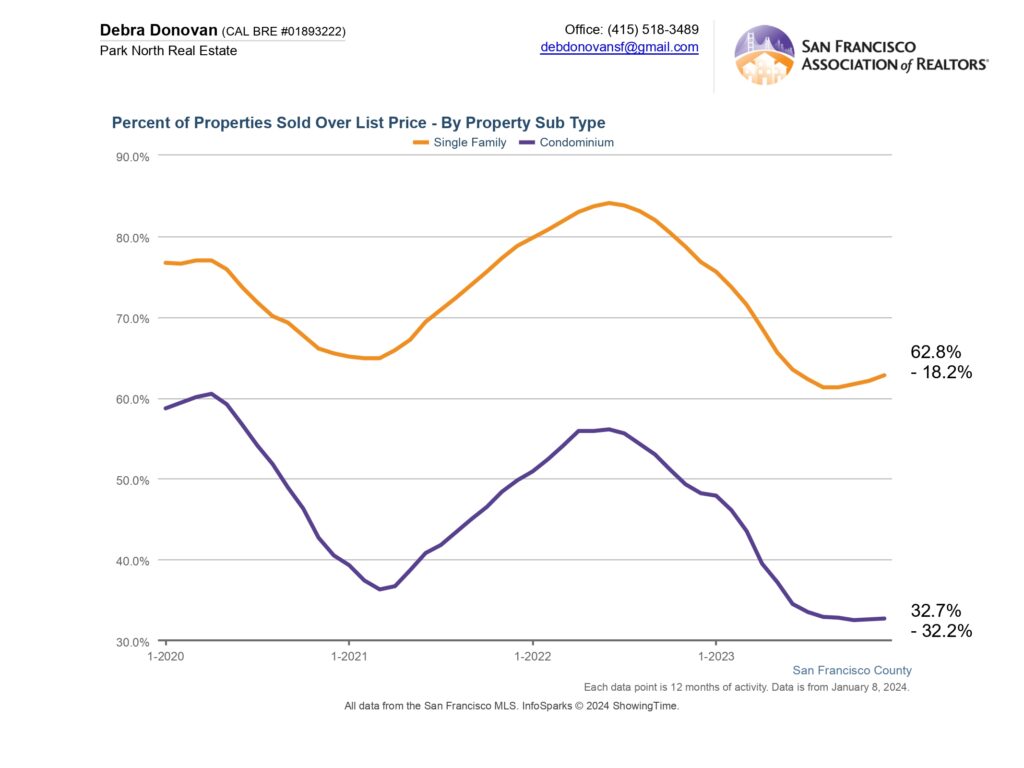
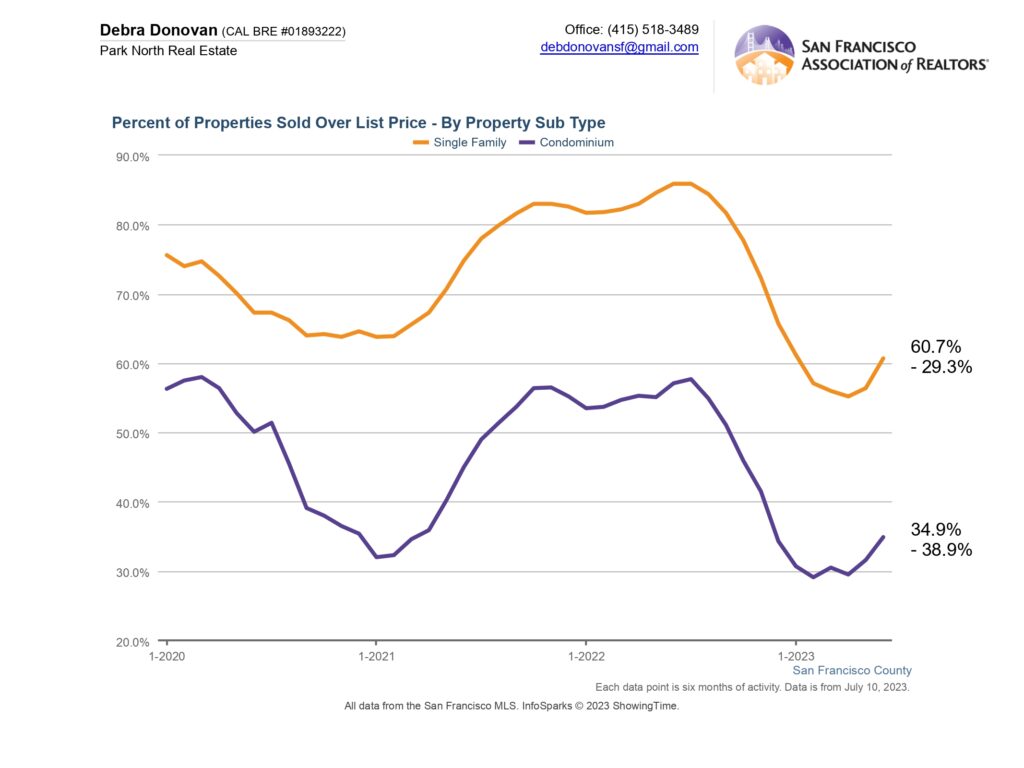
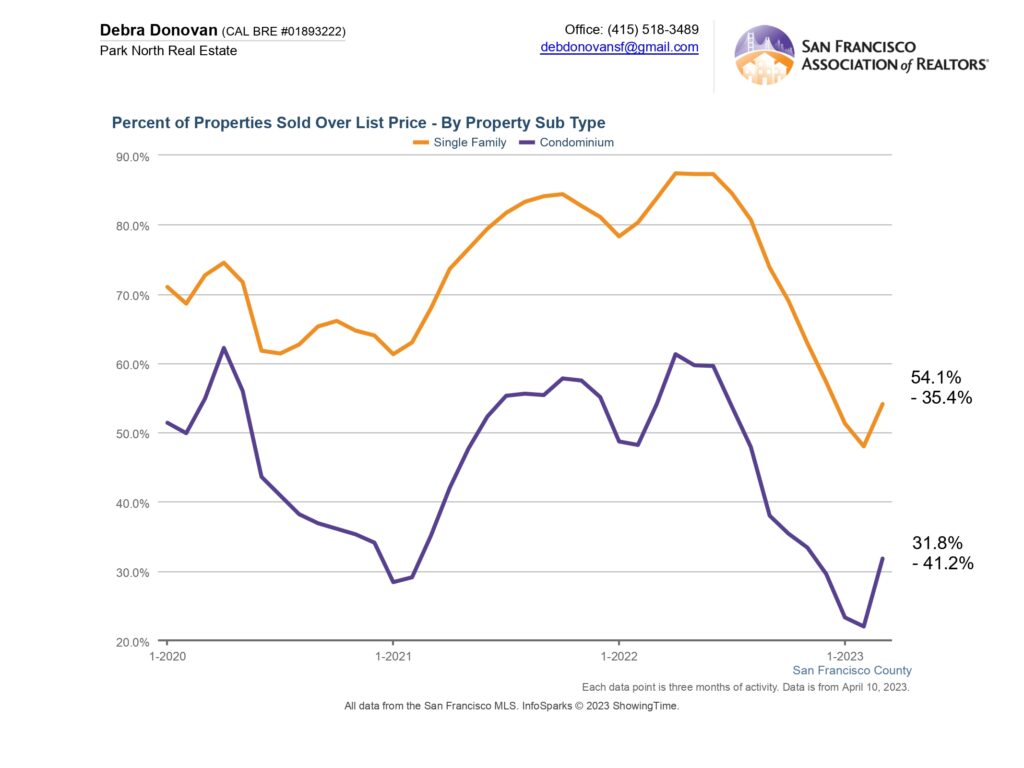
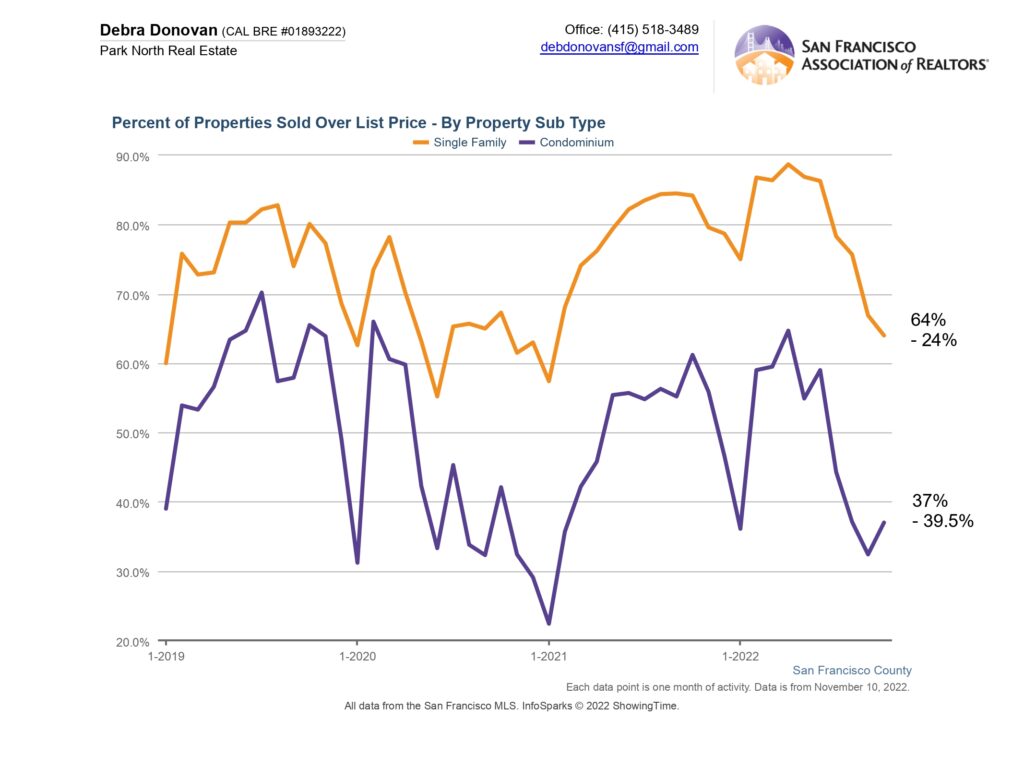
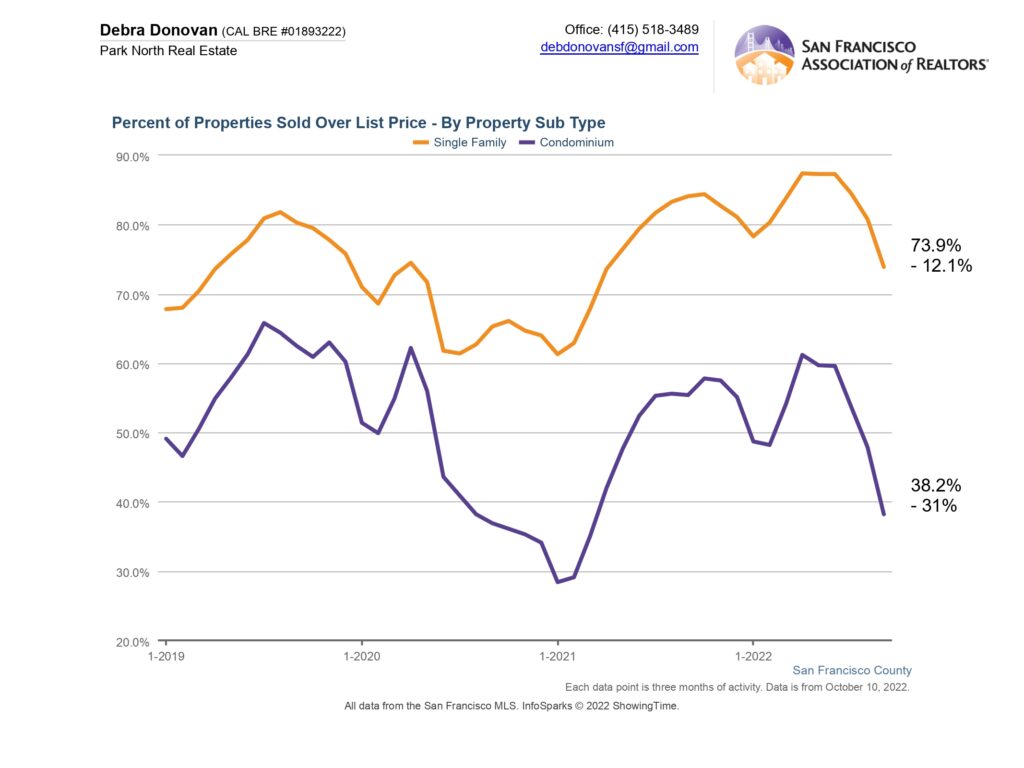
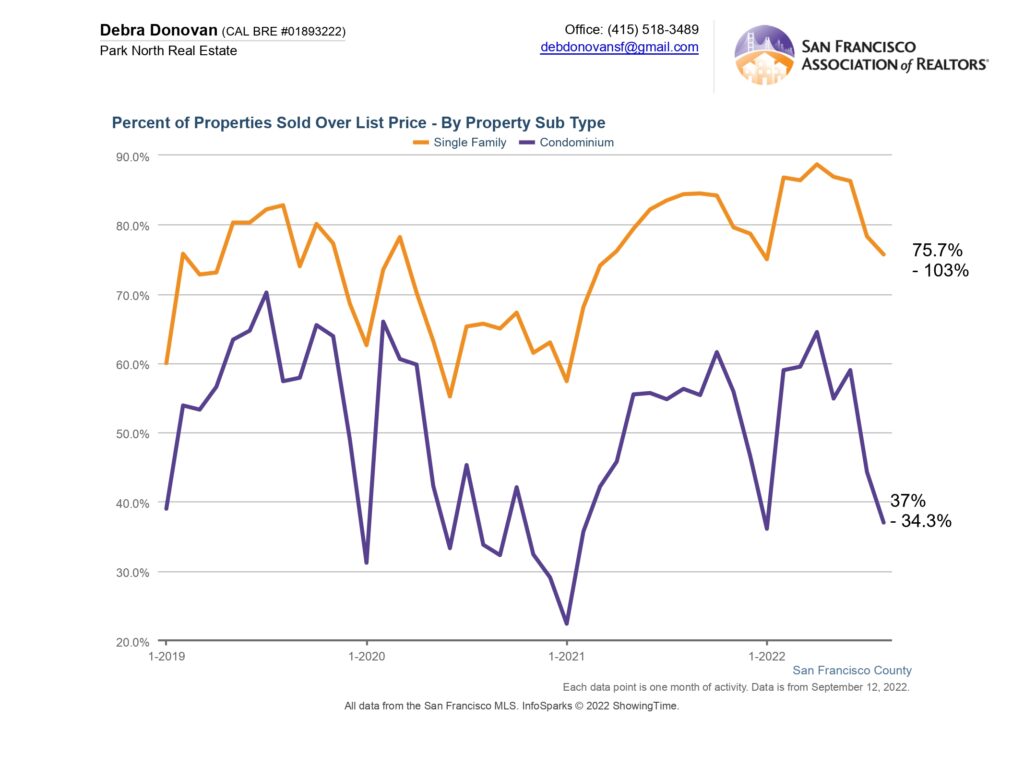
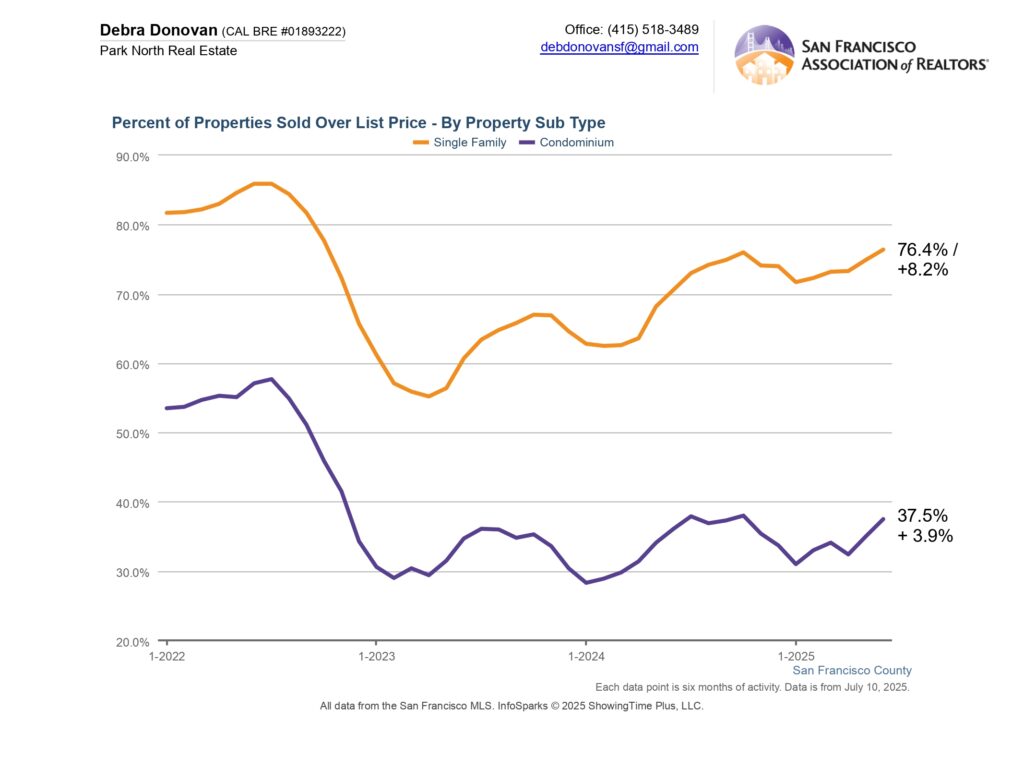
Percentage of Homes Sold Over List Price
In the first half of 2025 more than 76% of single family homes sold for over their asking price, an increase of 8% compared to the first half of 2024. Over 37% of condos sold over list price during during the same period, up almost 4% year over year.
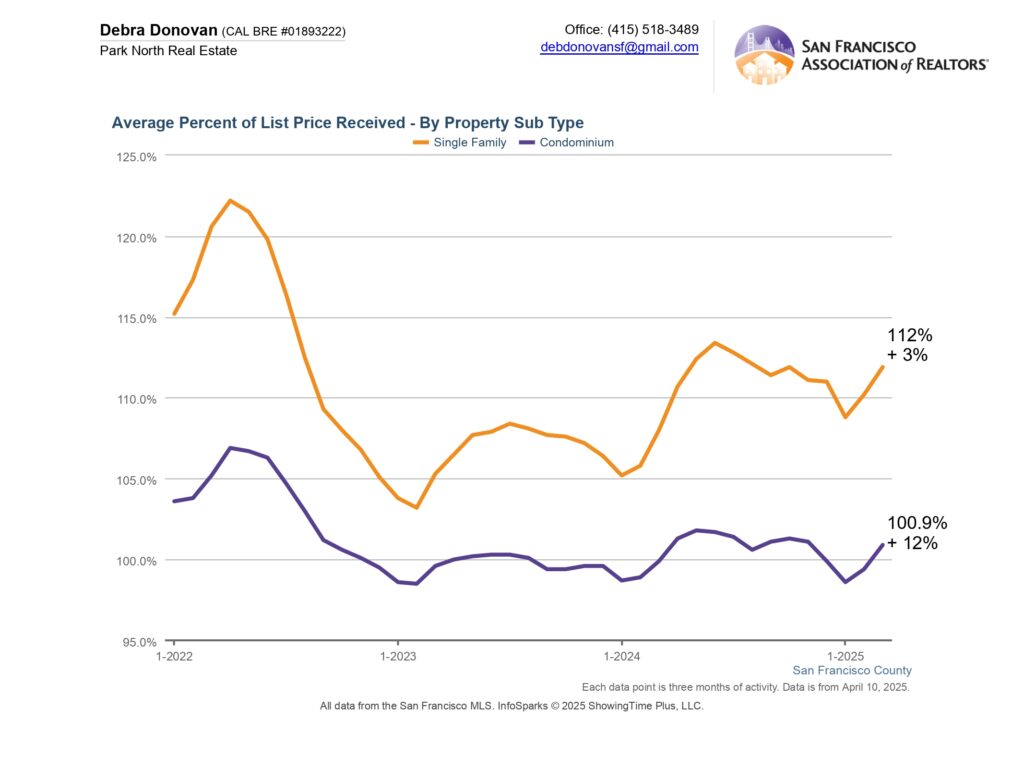
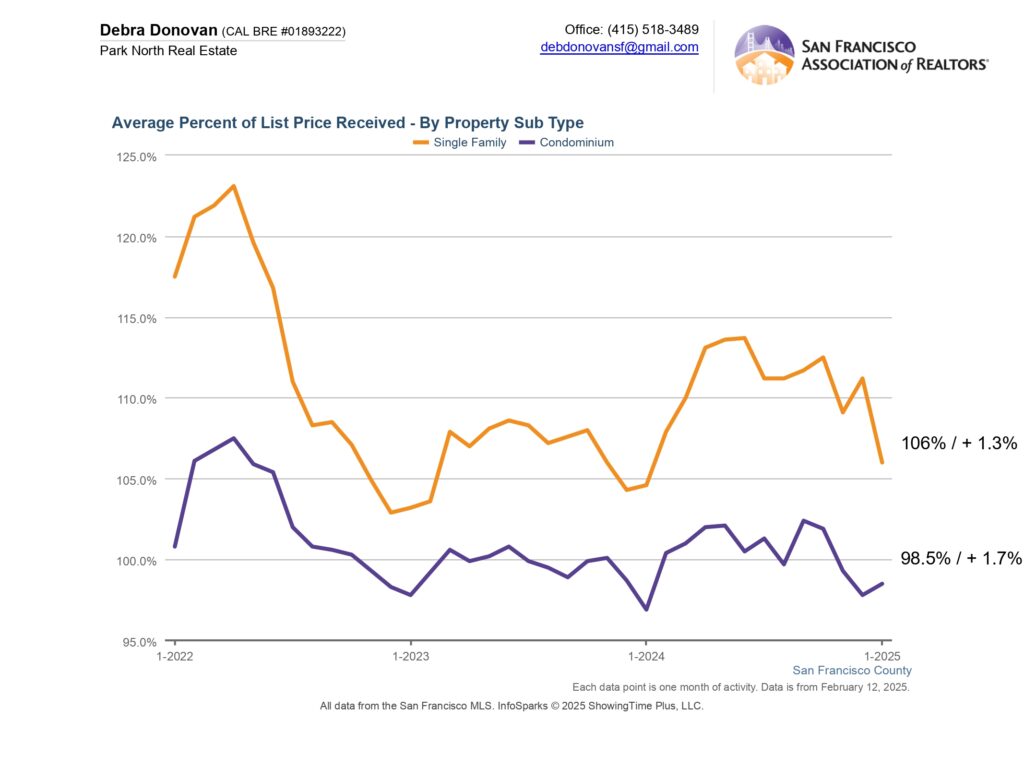
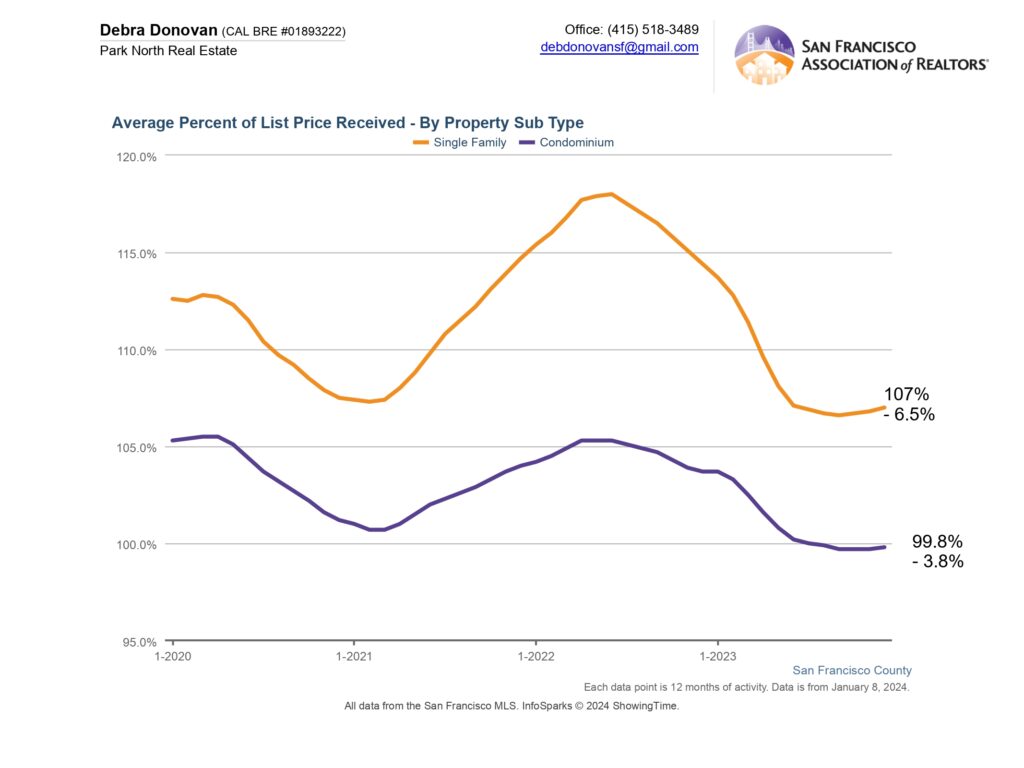
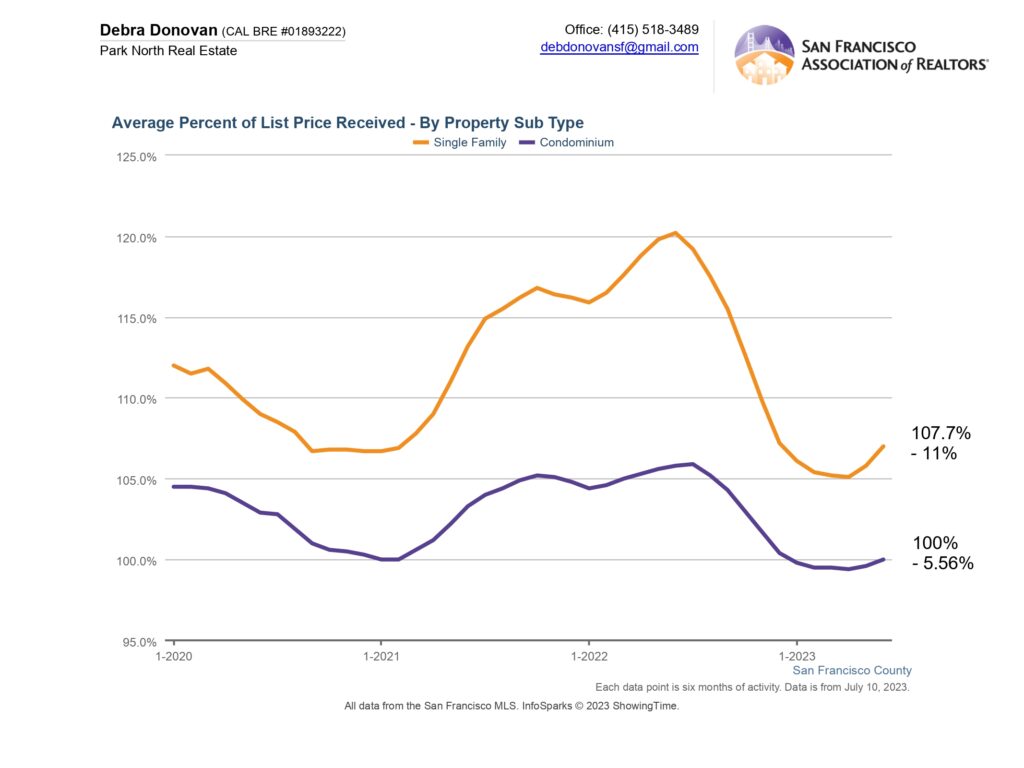
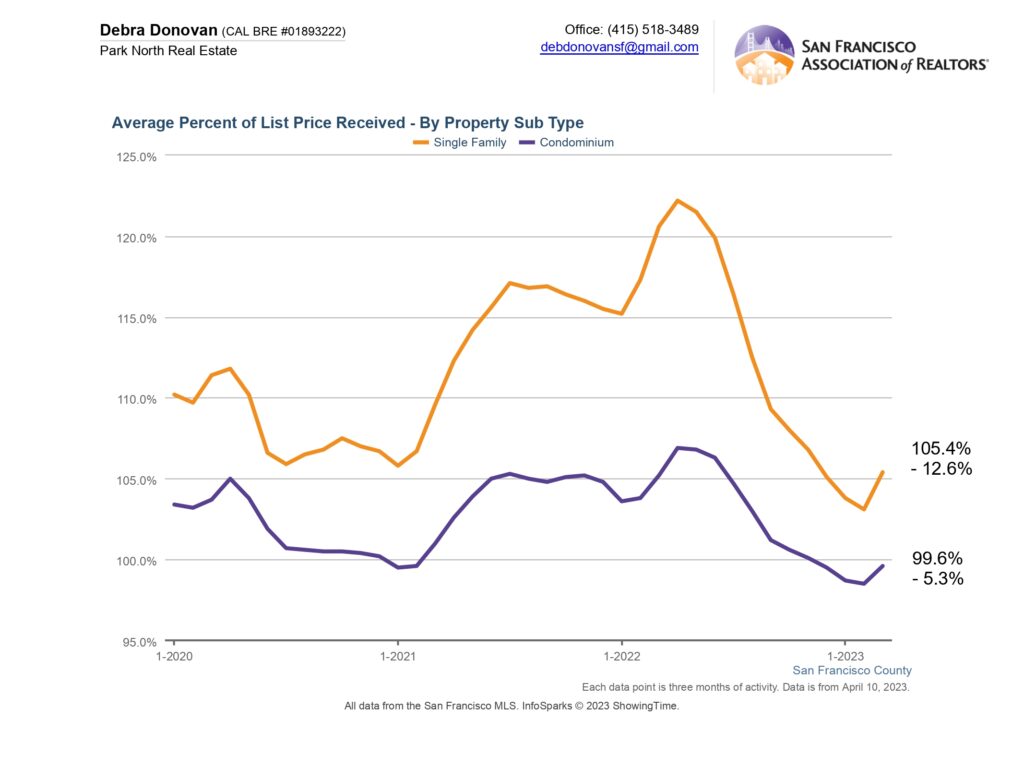
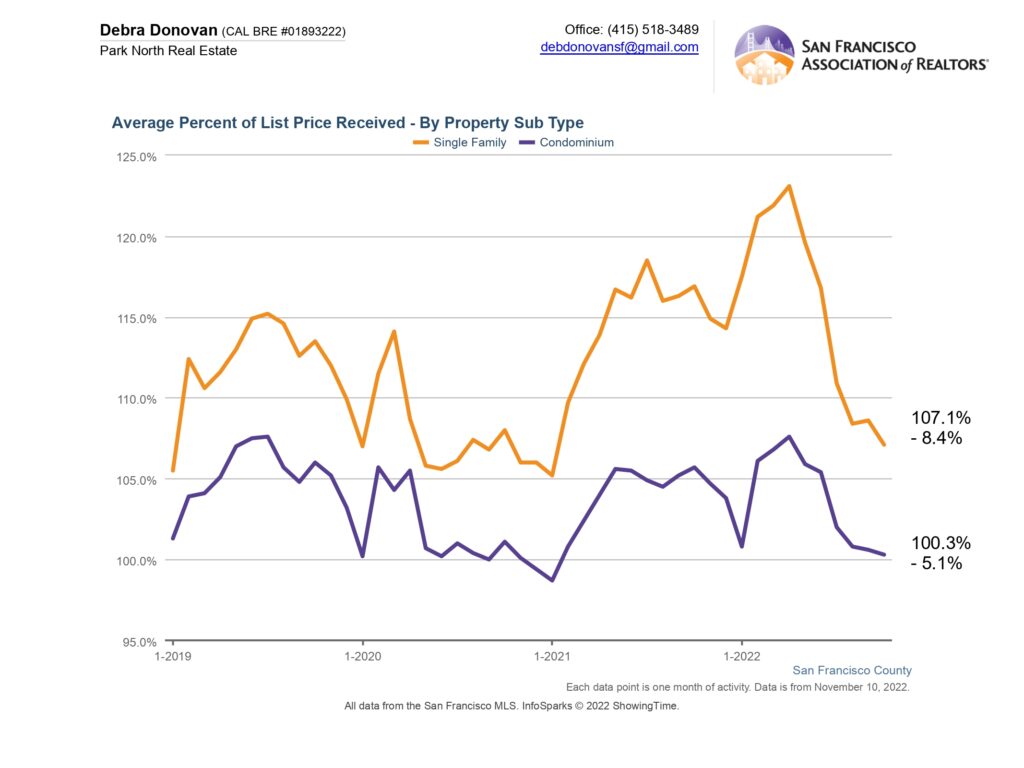
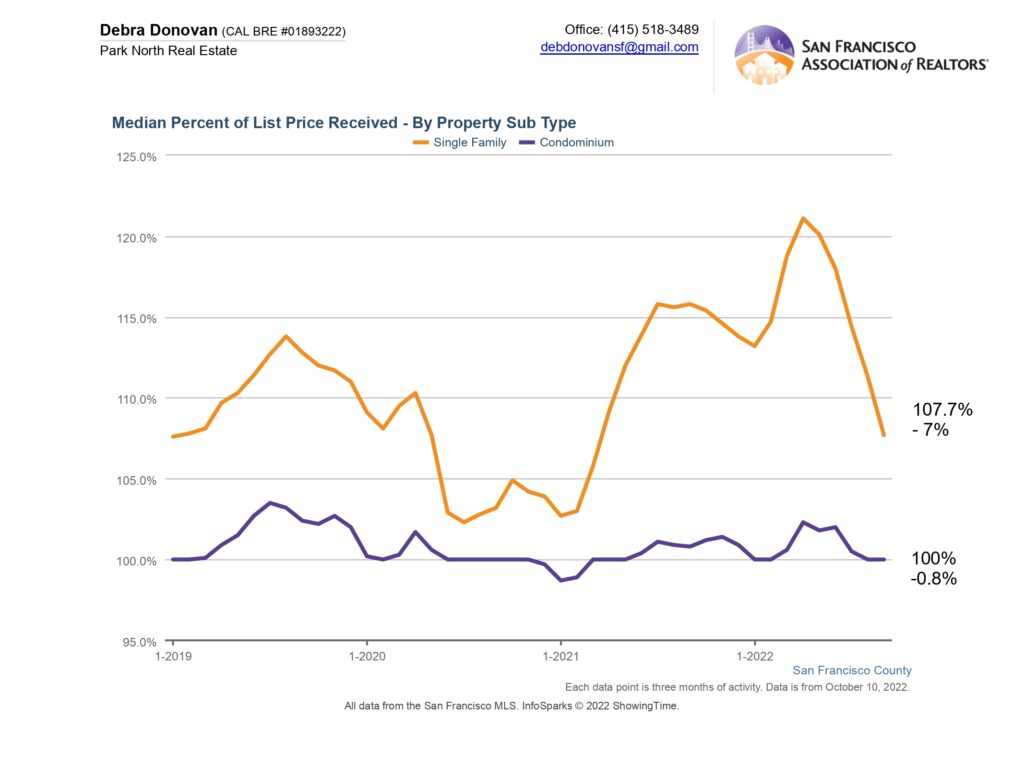
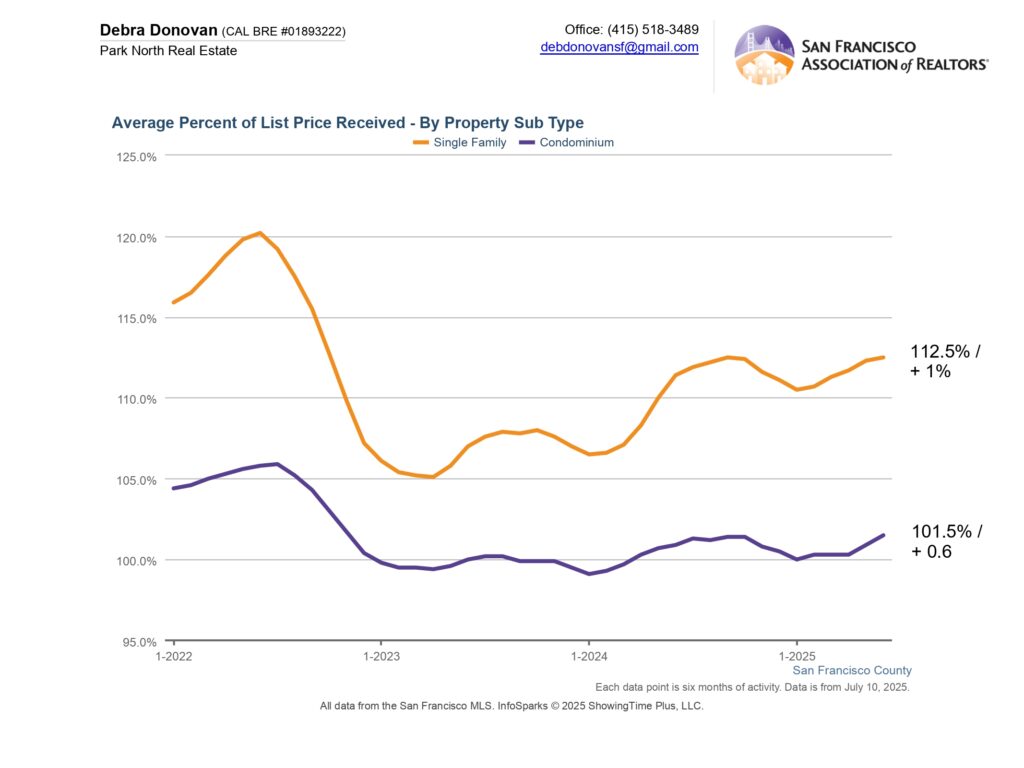
 Average Percentage of List Price Received:
The average percentage of list price single family homes received was 112.5%, a 1% increase over first half 2024. On average condos sold for 101.5% of their list price, up 0.6%.
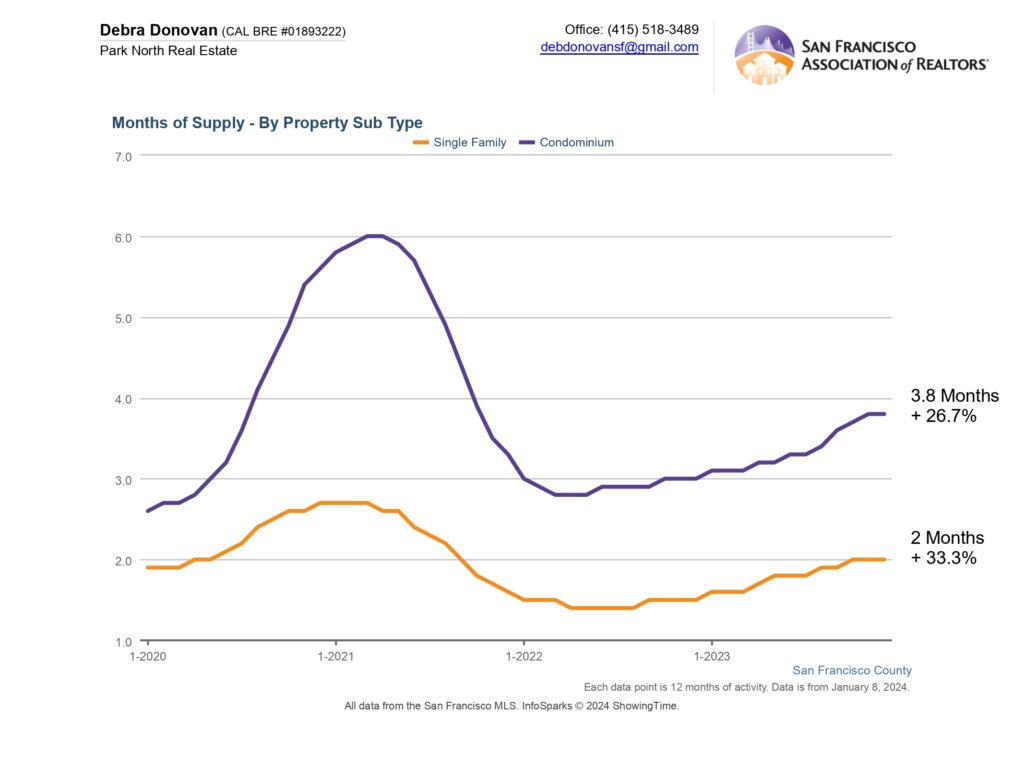
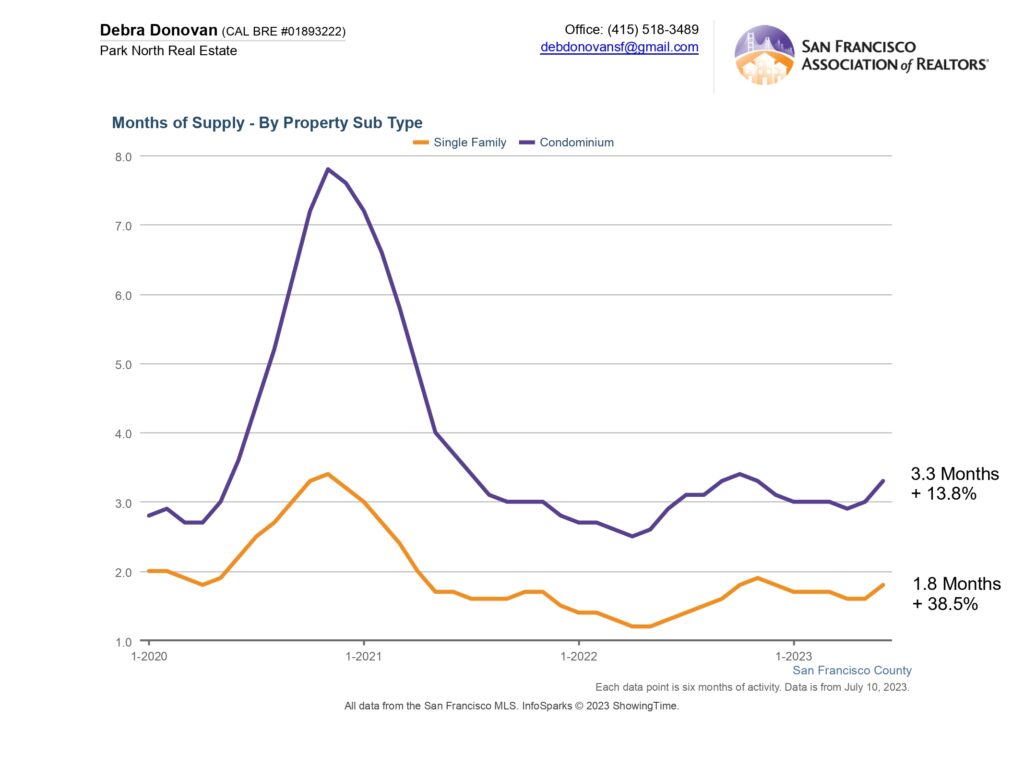
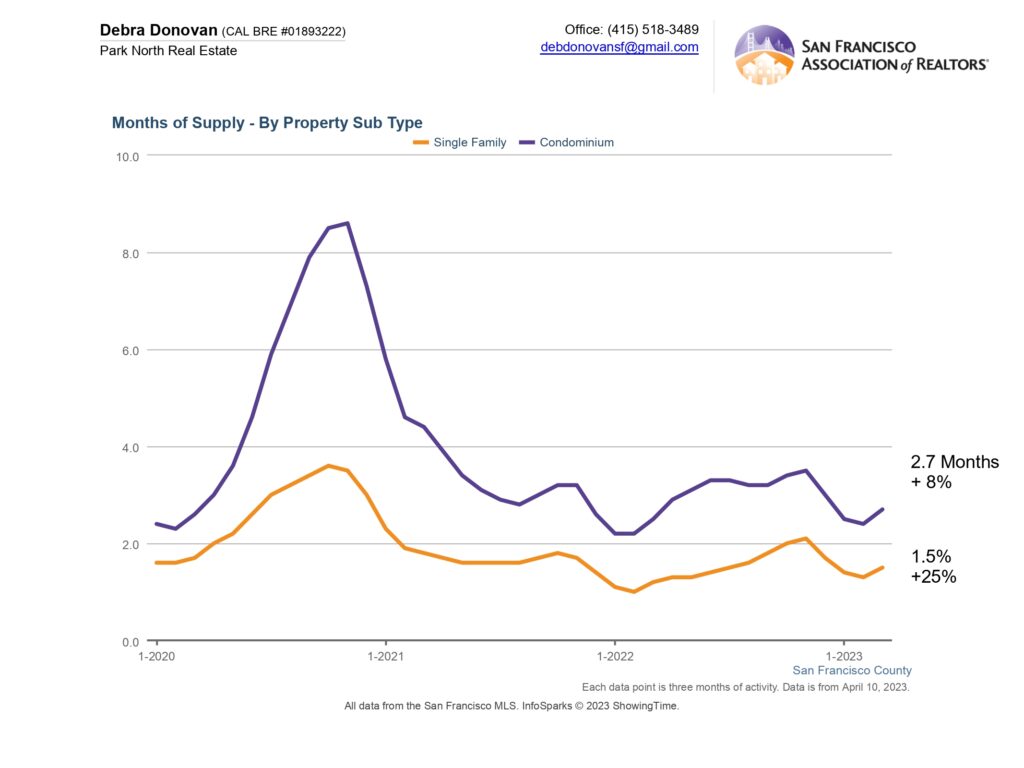
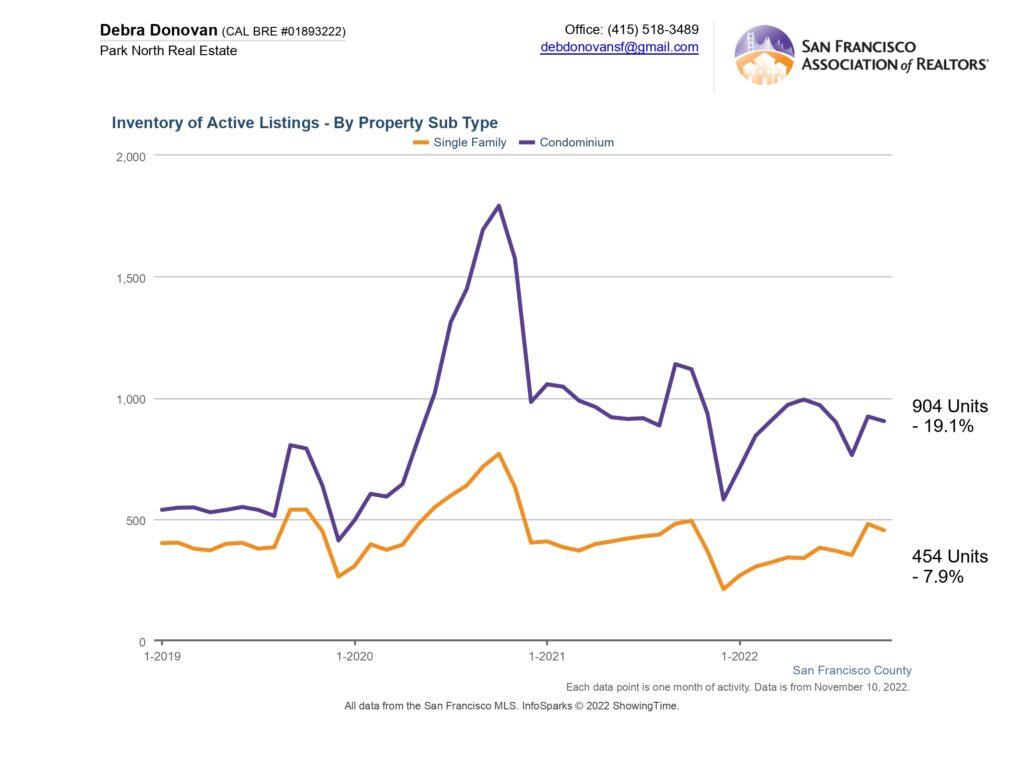
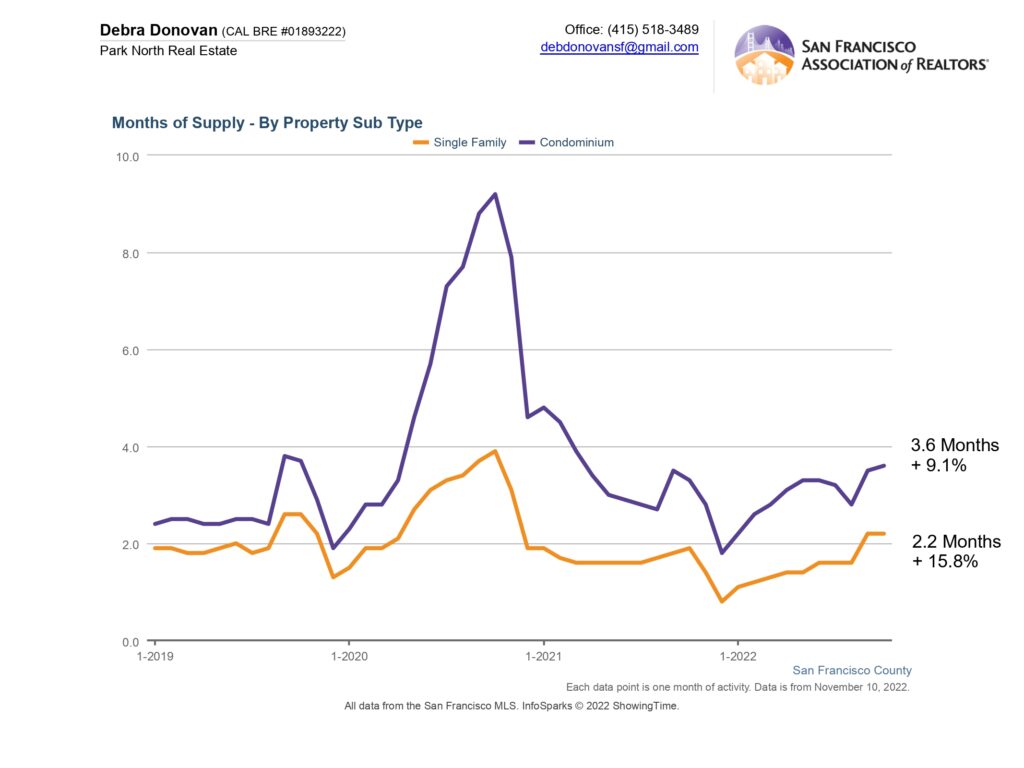
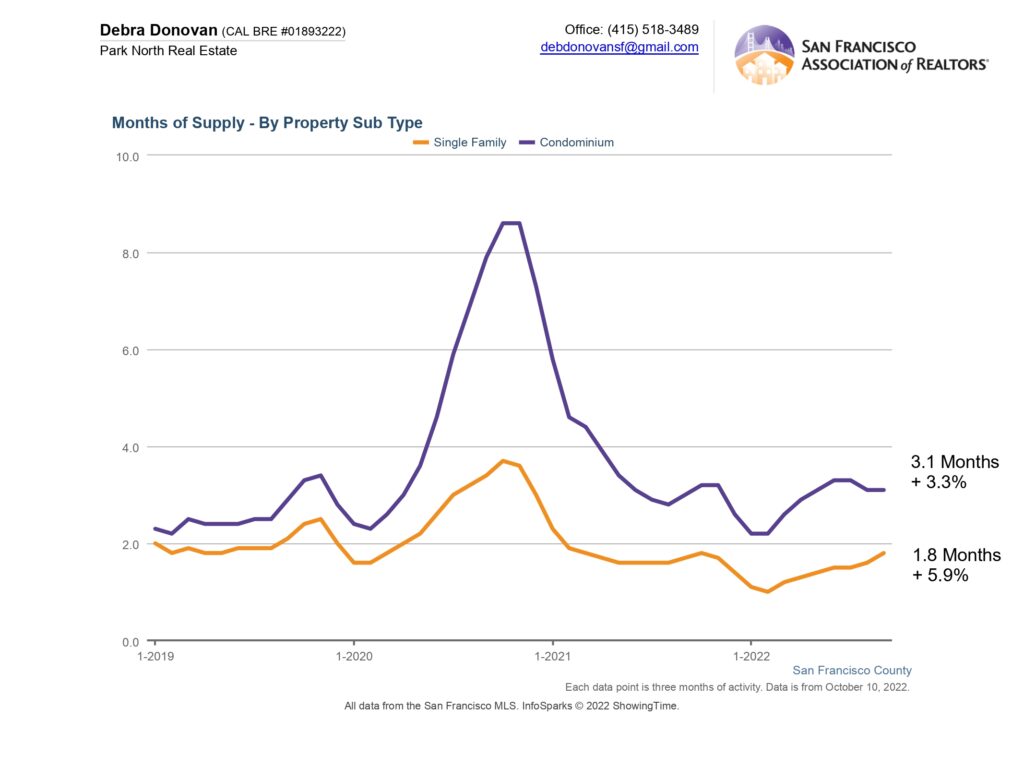
Months Supply of Inventory:
MSI measures the health of a given market and whether that market tends to advantage sellers, buyers, or is in balance between buyers and sellers. A balanced market would be 5-6 months of inventory. Anything less is considered a seller’s market, and anything above would be a buyer’s market. The lower the months supply of inventory, the more it’s a seller’s market and vice versa. Single family homes had just 1.6 months of inventory in the first half of 2025 making it clearly a seller’s market. Condo supply also decreased over 13% with 3.8 months of inventory, also putting it in more of a seller’s market.

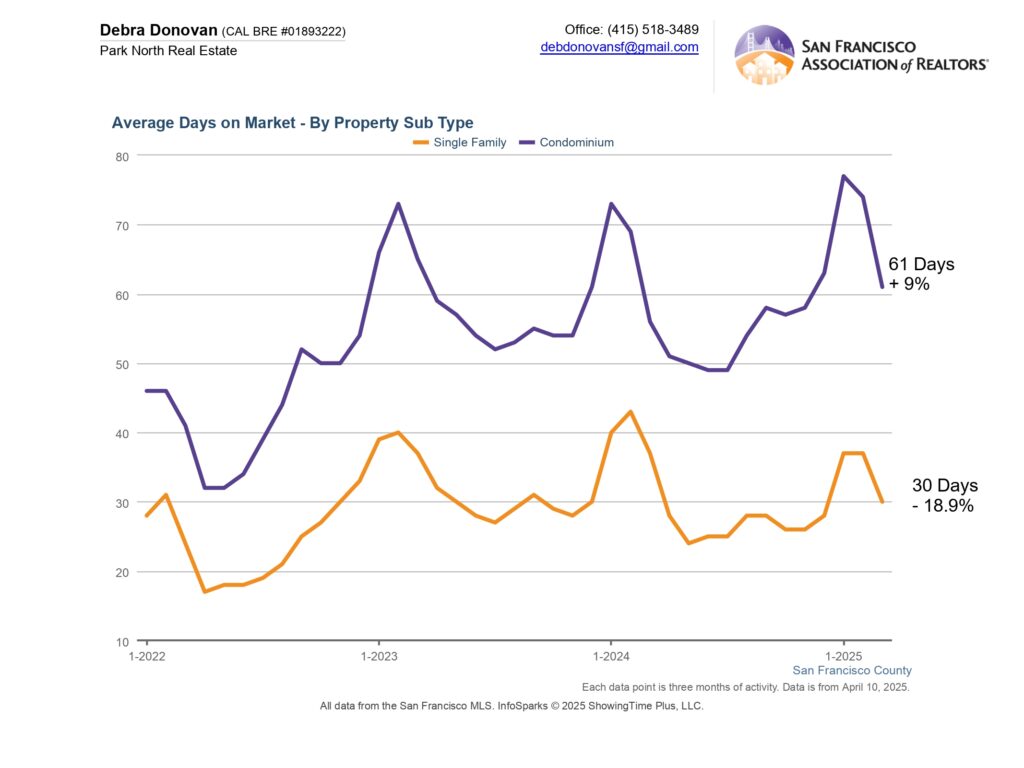
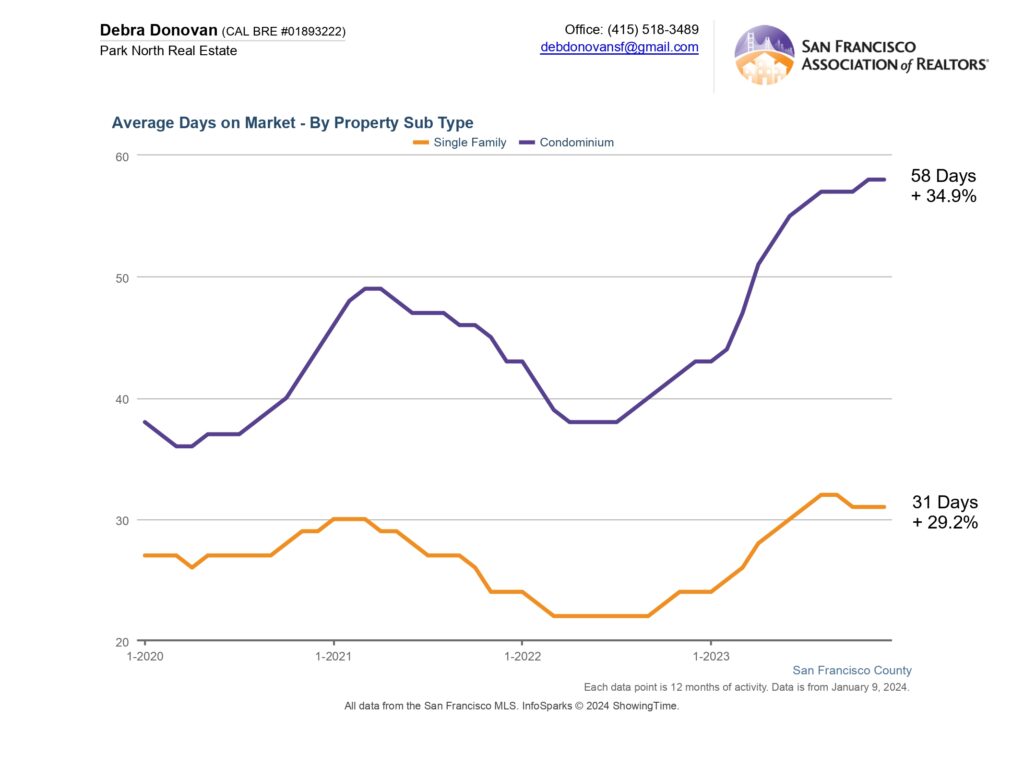
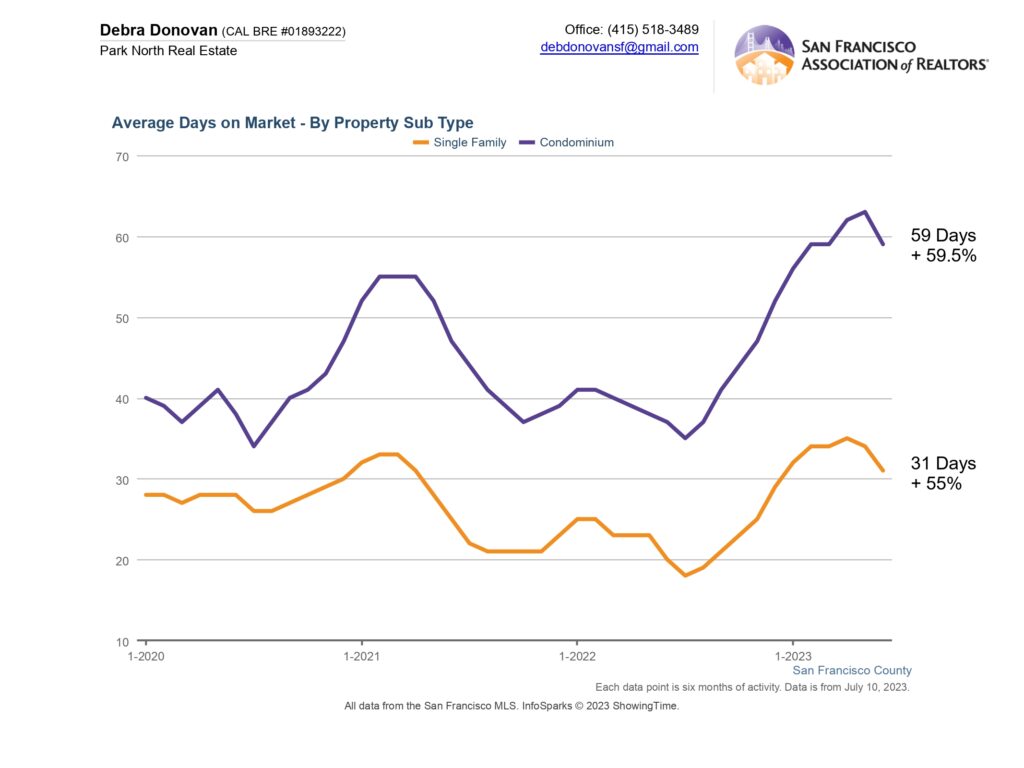
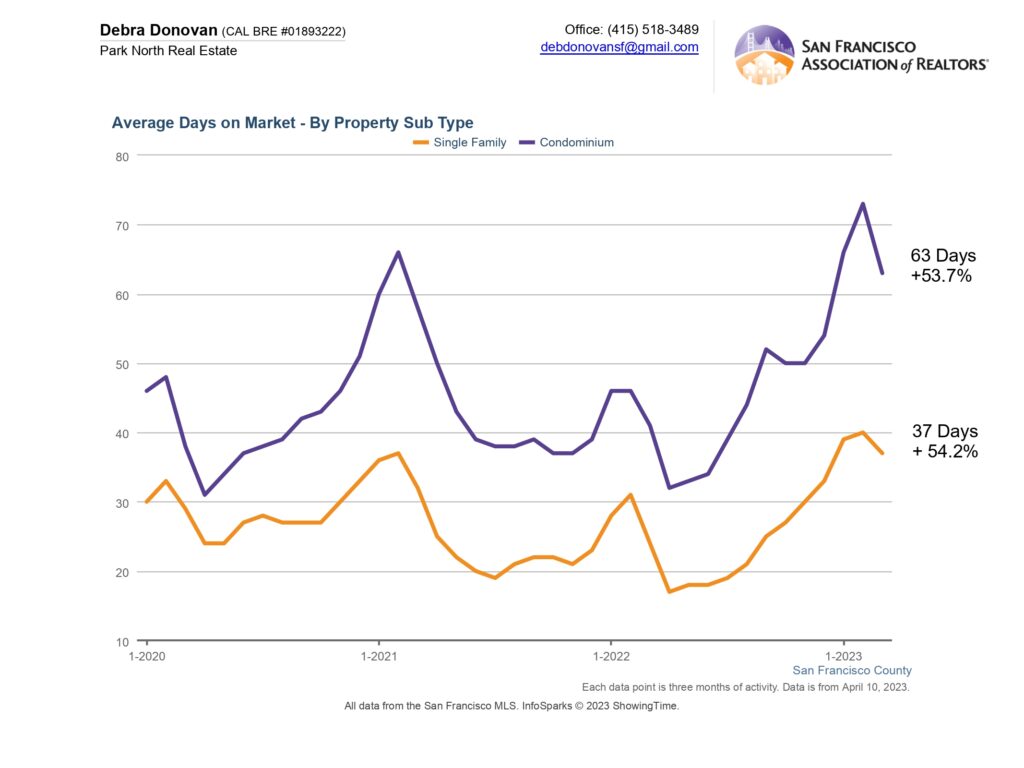
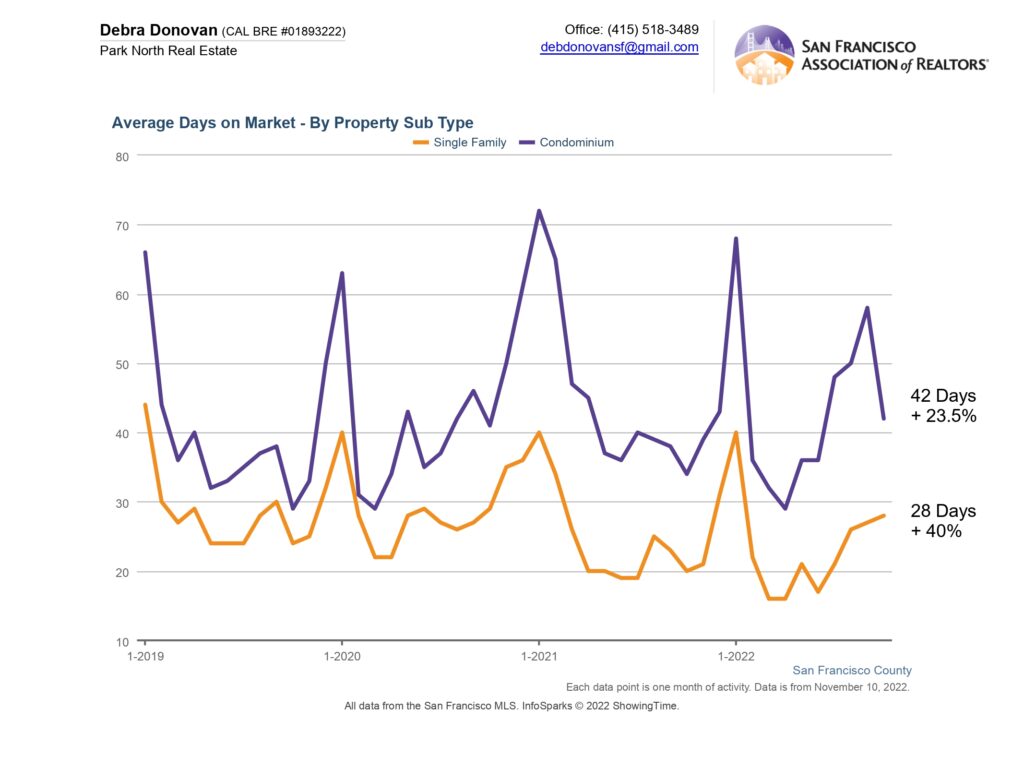
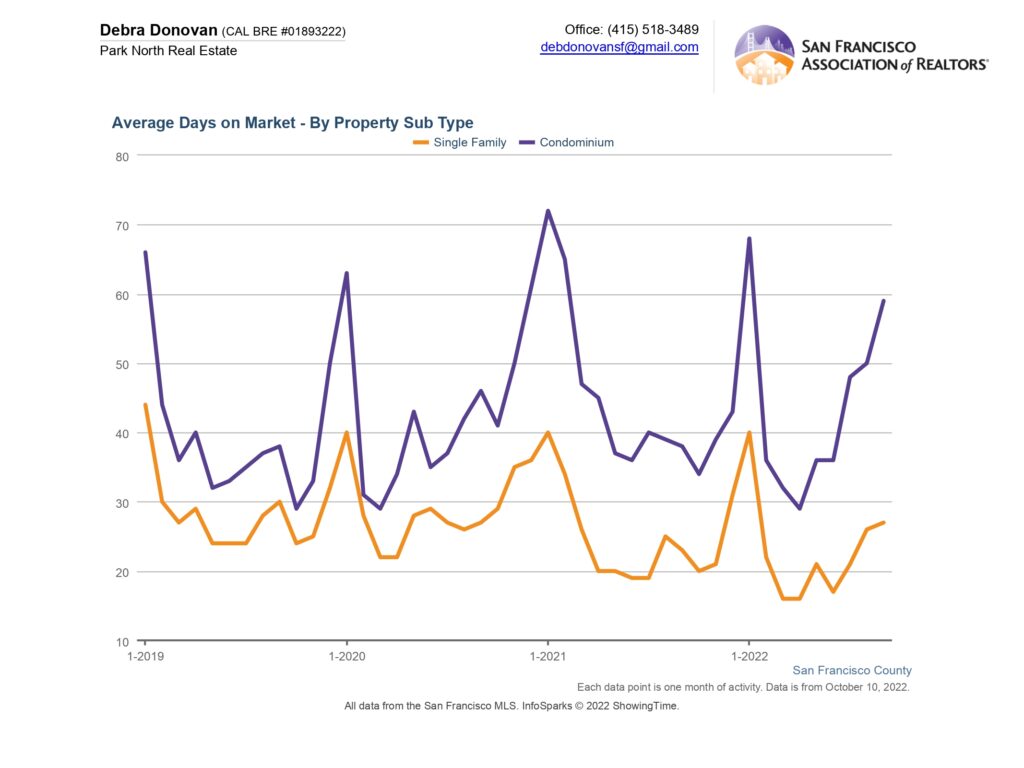
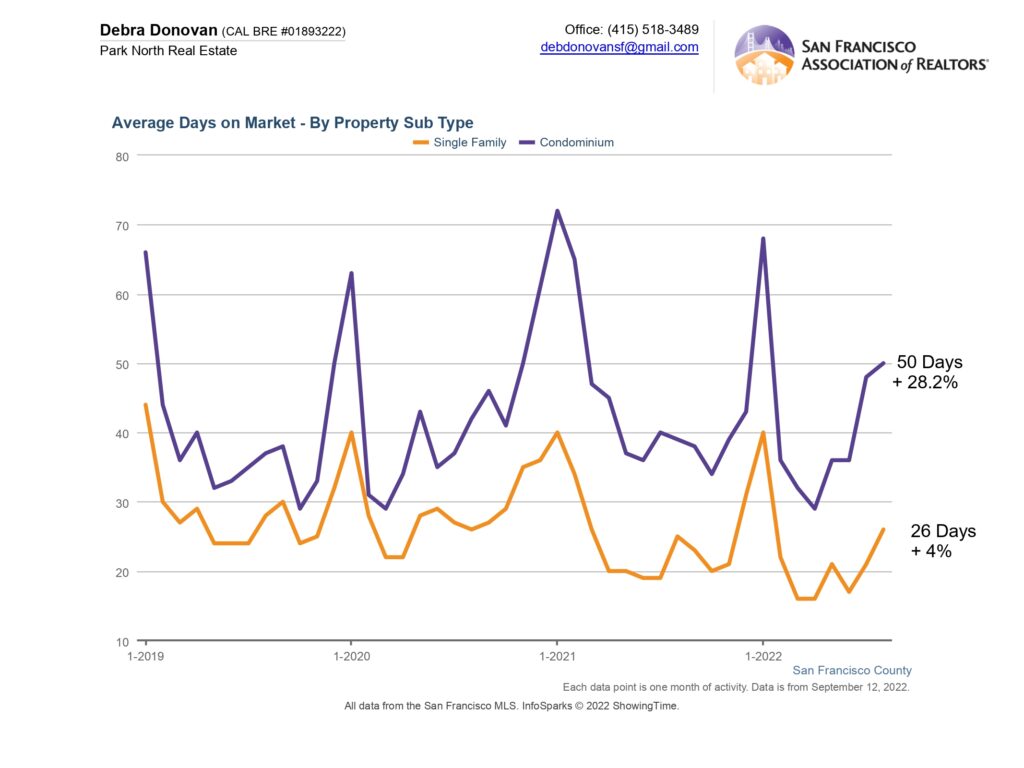
Average Days on Market:
Days on market measures the number of days a property is on the market before the seller accepts an offer. In the first half of 2025 single family homes spent an average of 25 days on the market before an offer was accepted, down over 16% compared to the first half of 2024. Condos spent an average of 55 days on the market, an increase of almost 6%.

The fine print: All information deemed reliable but not guaranteed or warranted. Data comes from the MLS so does not include off-market and most new construction condo sales. The Bay Area real estate market is dynamic so statistics can change on a daily basis. These statistics are meant to be a snapshot of the day and time they were pulled.