The first quarter of the year was a rocky one for the San Francisco real estate market. The confluence of rising interest rates, inflation, tech layoffs, and a deluge of rain all contributed to a slower than normal January and February, with buyers waiting to see what would happen and sellers postponing their home sales due to weather. Although the weather dried and buyers were back out in force in March, overall it was a lackluster quarter.
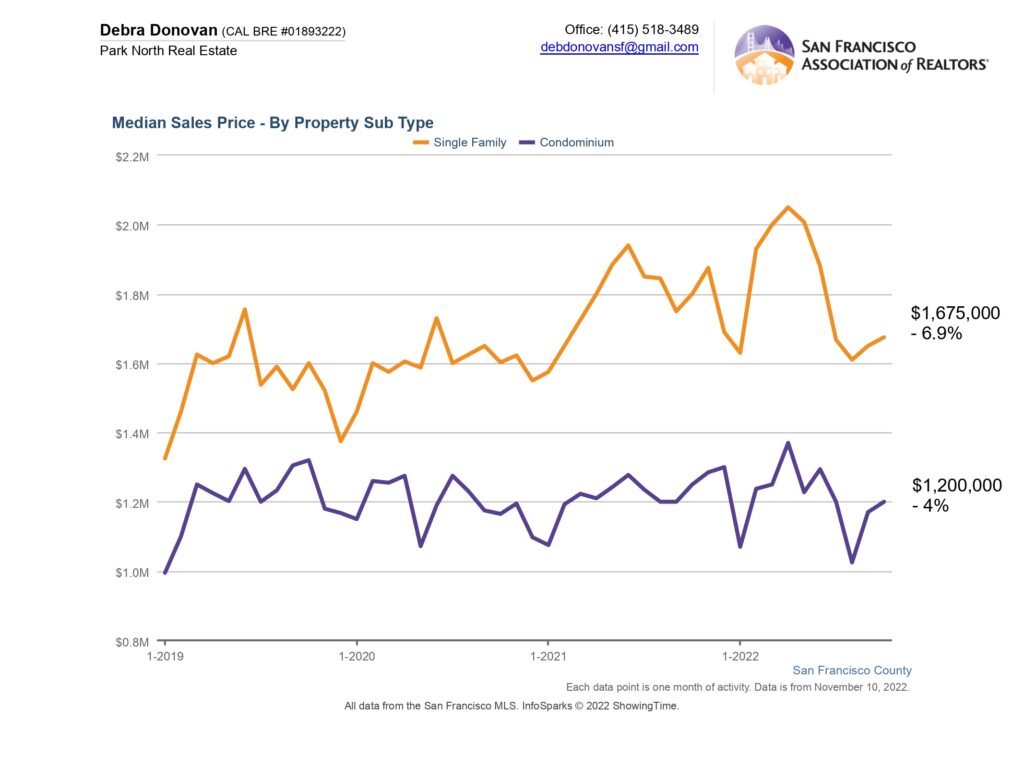
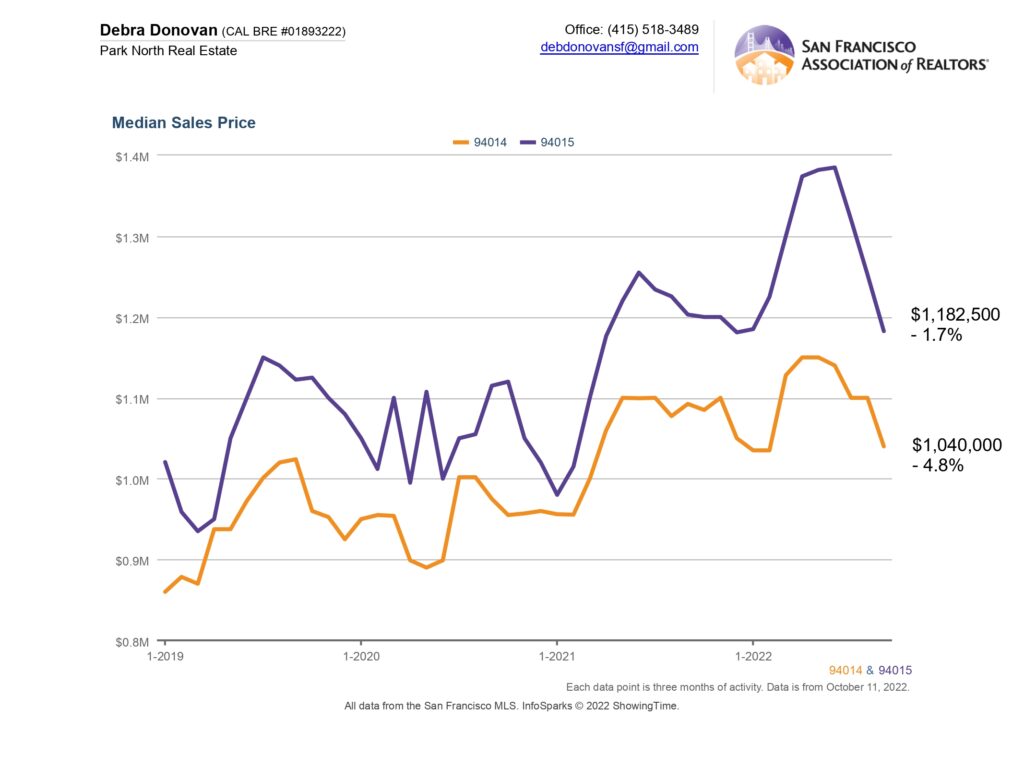
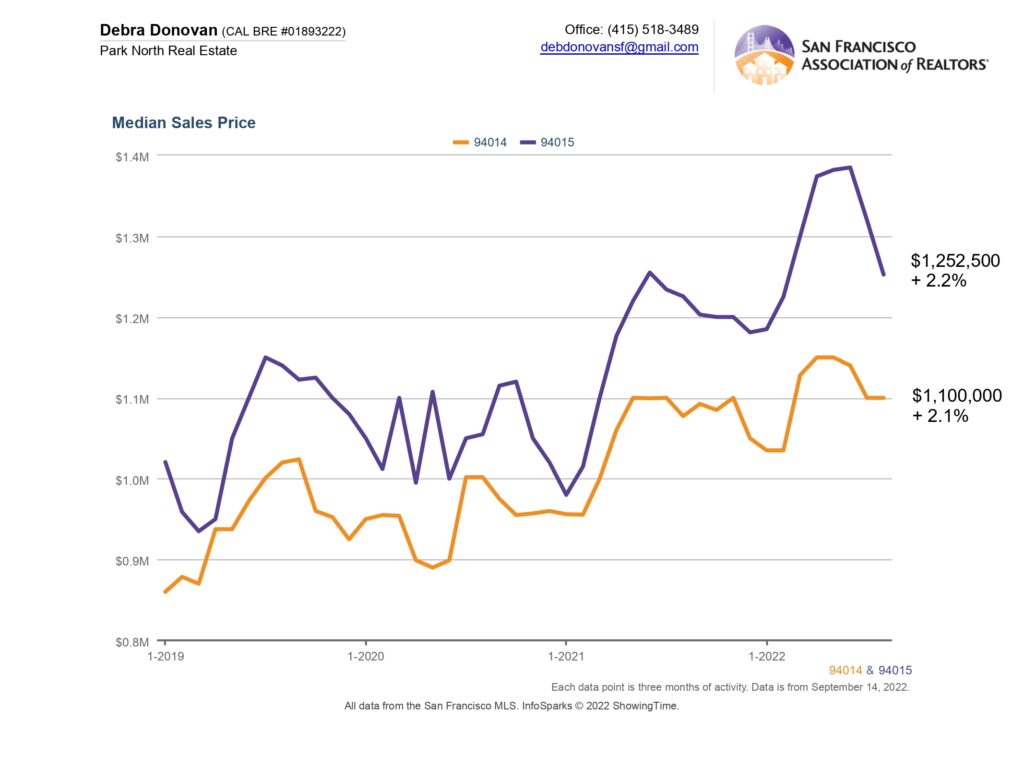
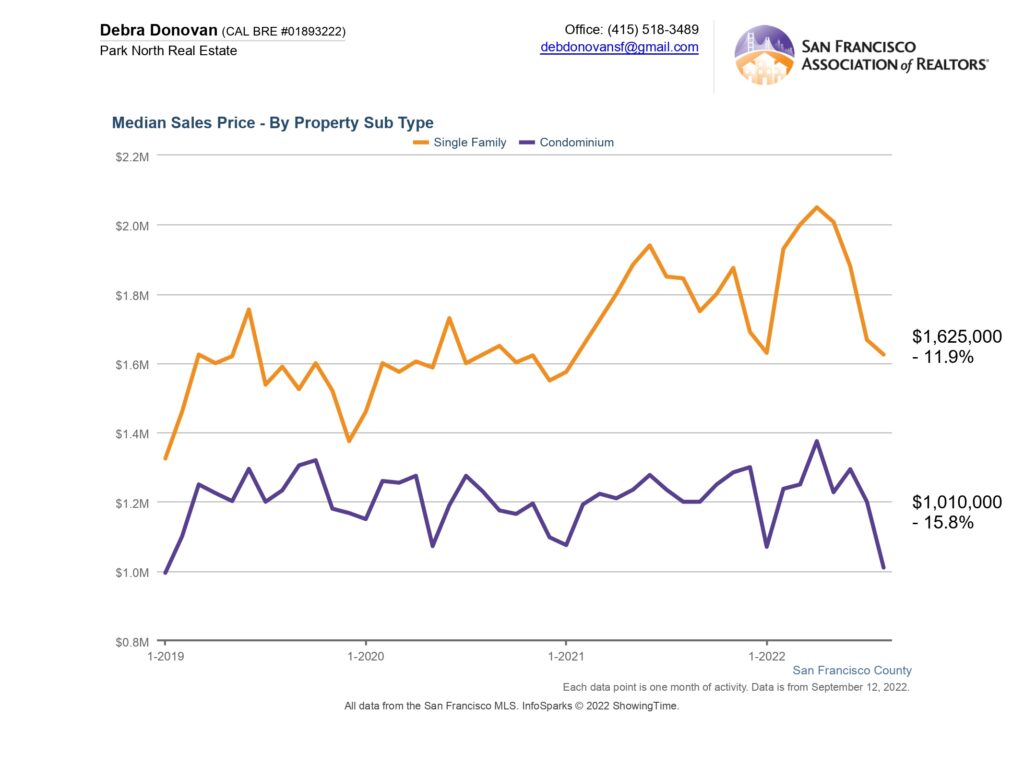
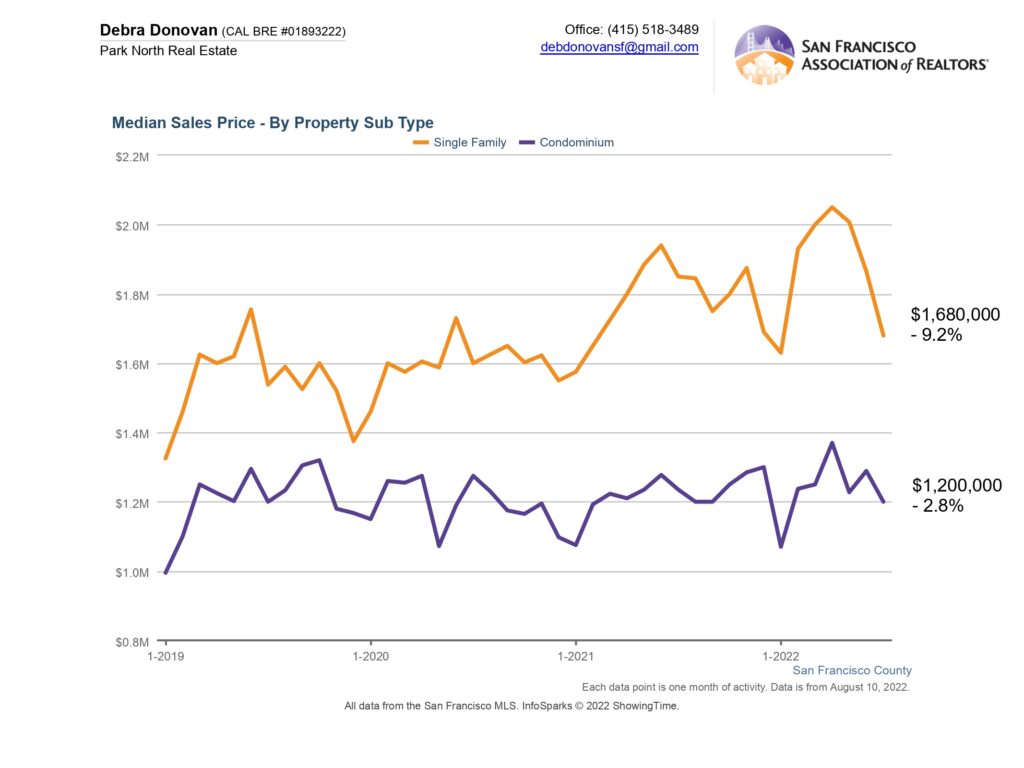
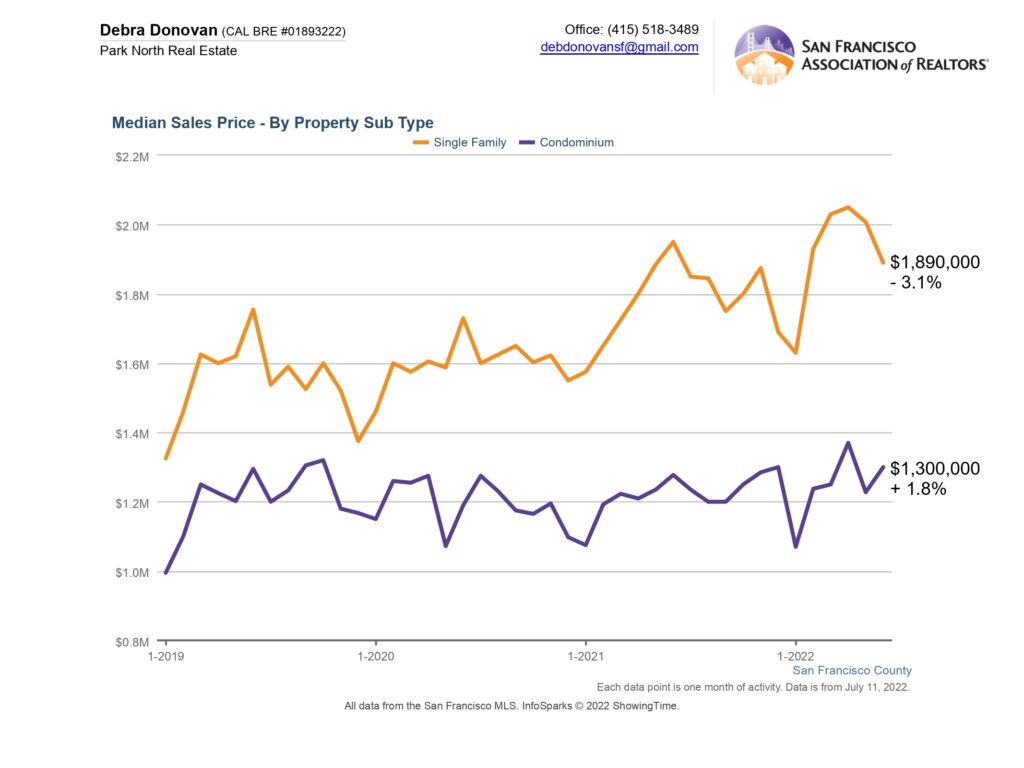
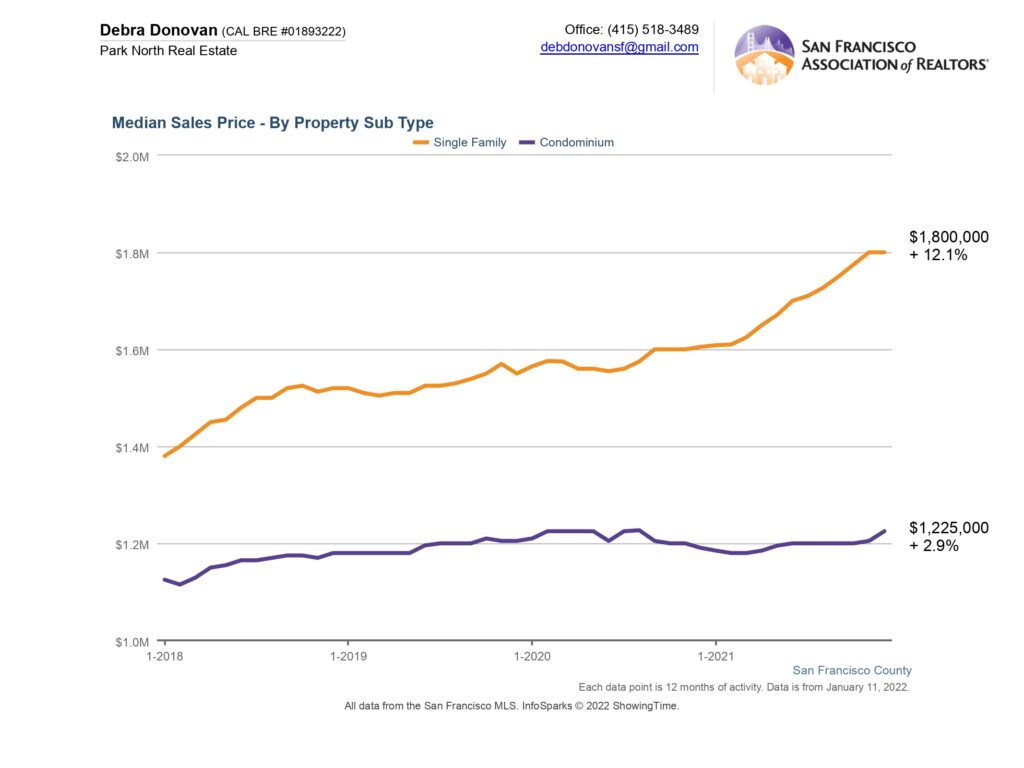
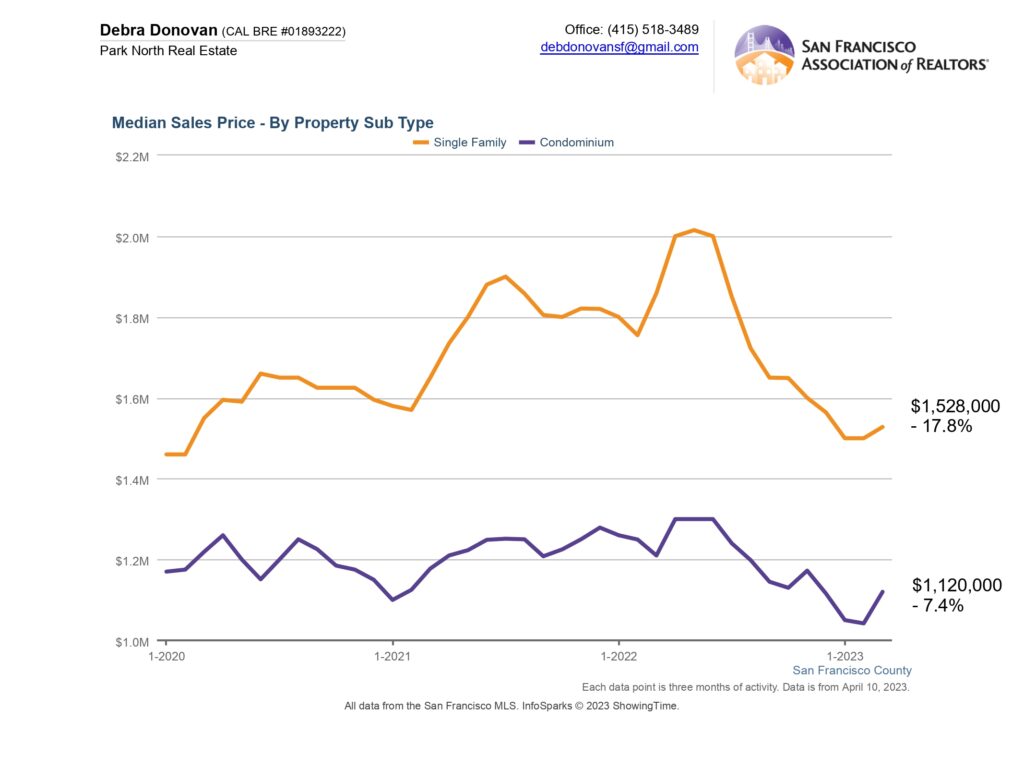
Median Sales Price:
The median price for single family homes dropped almost 18% in Q1 2023 when compared to the same quarter 2022. Condo prices were off over 7% compared to last year.
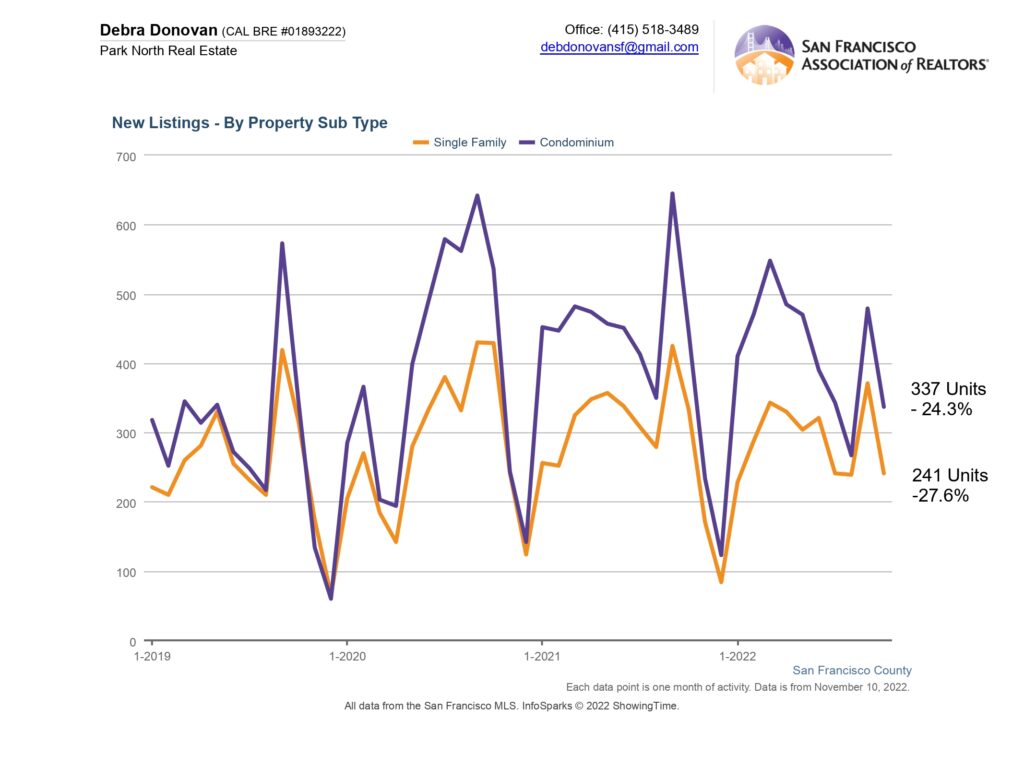
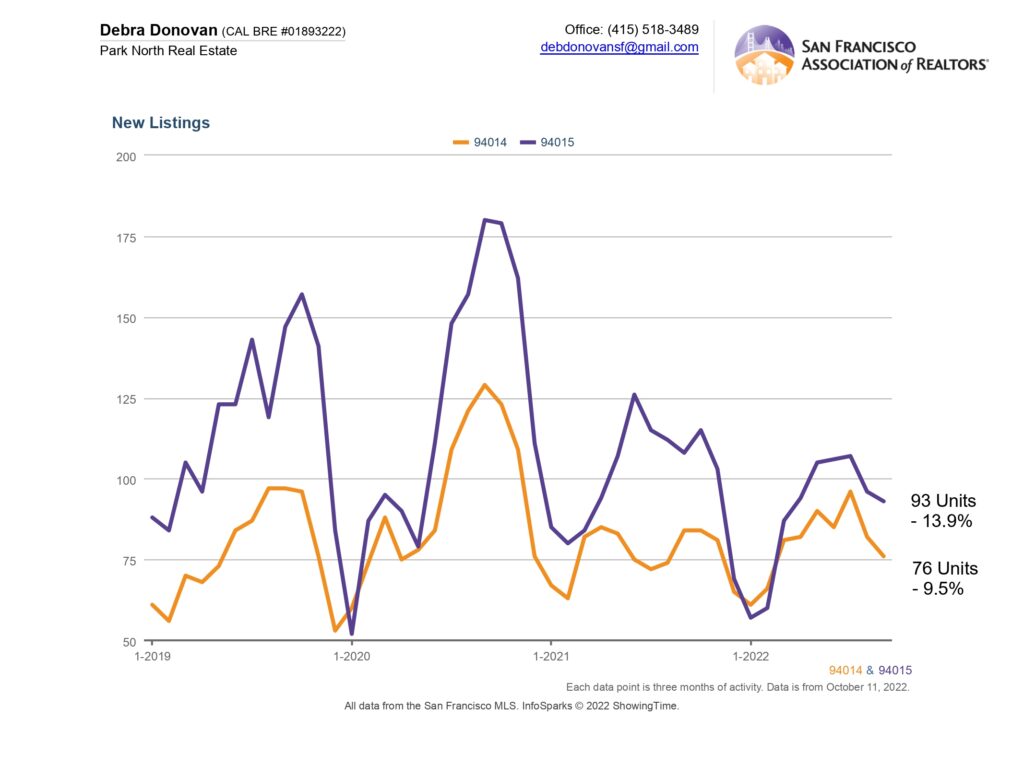
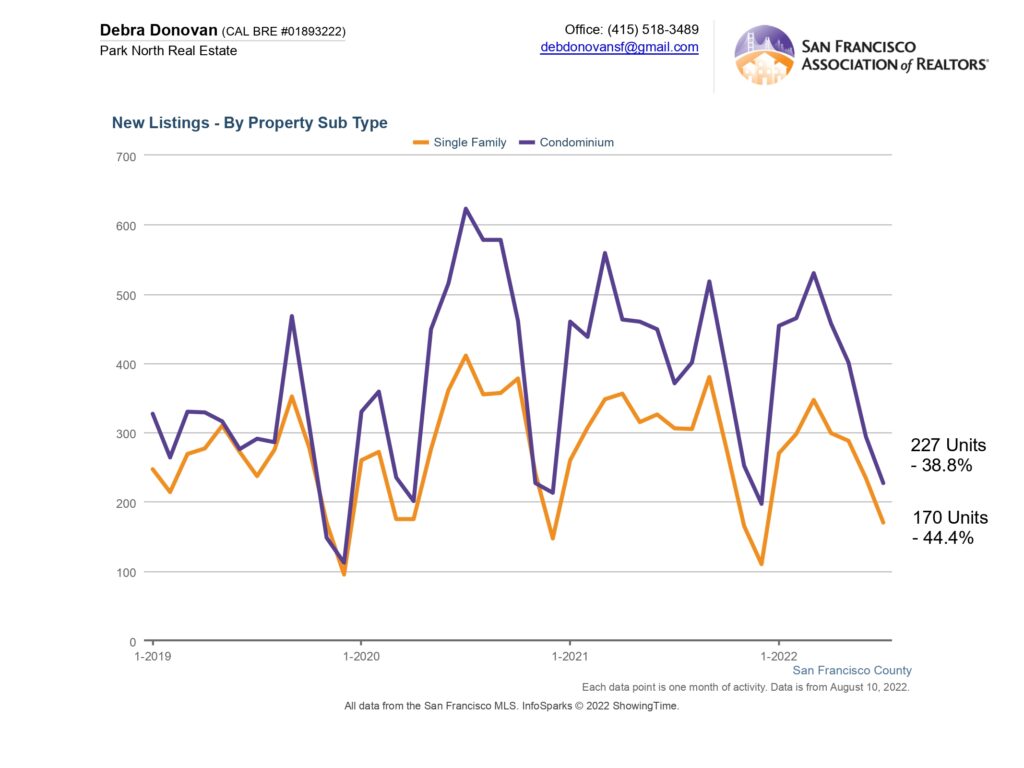
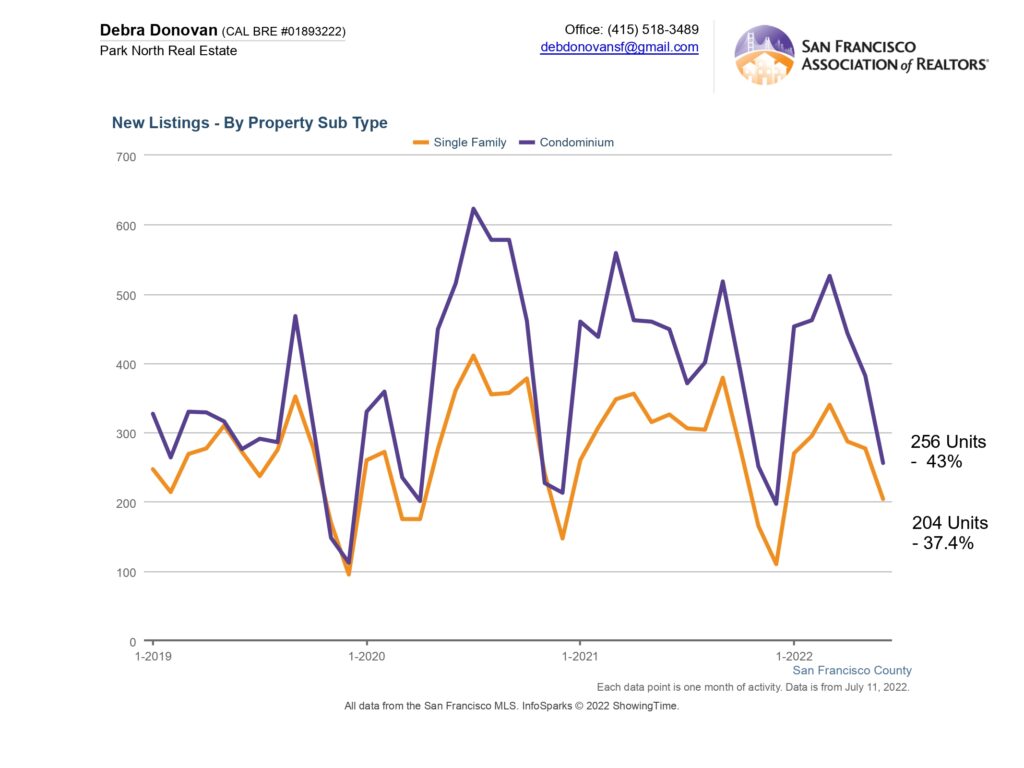
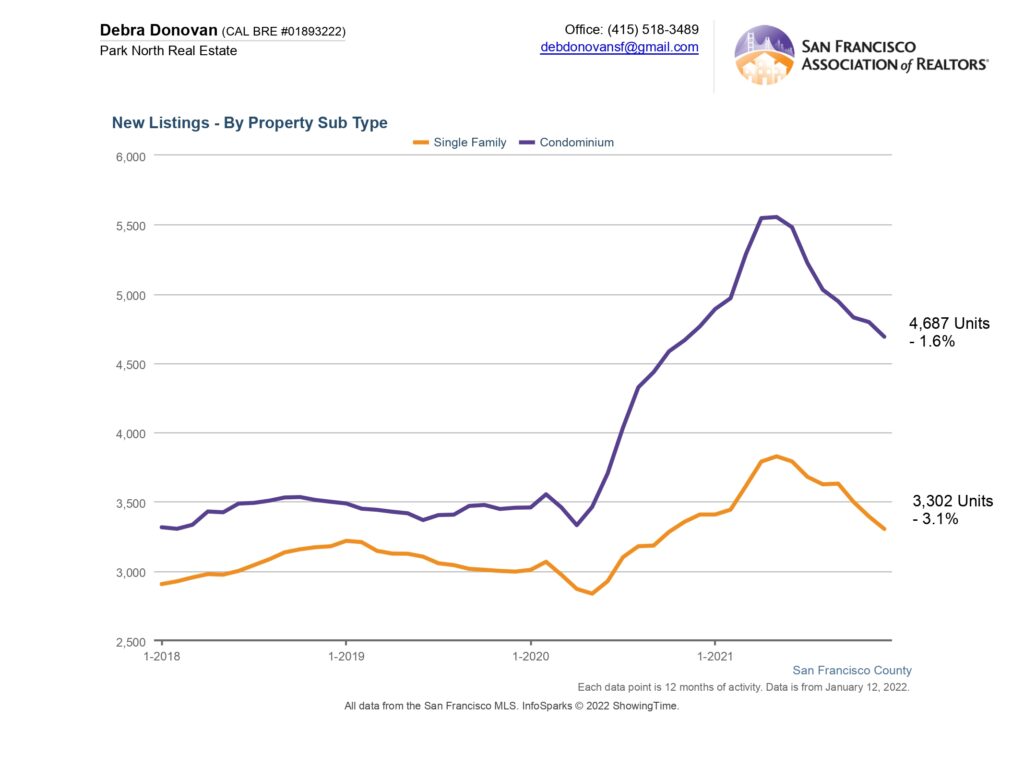
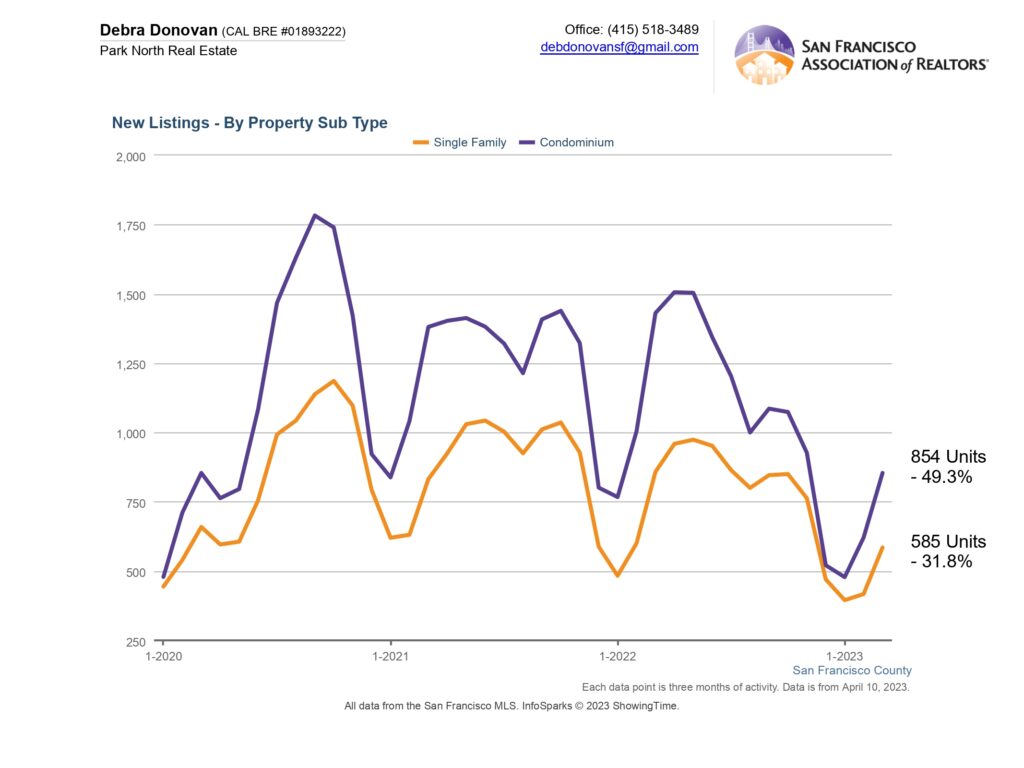
New Listings:
New listings were down significantly for both single family homes and condos. Single family home listings were down almost 32% while new condo listings were down almost 50%. Many who have bought or refinanced for incredibly low interest rates are not as motivated to sell if they don’t have to, leaving a dearth of new properties.
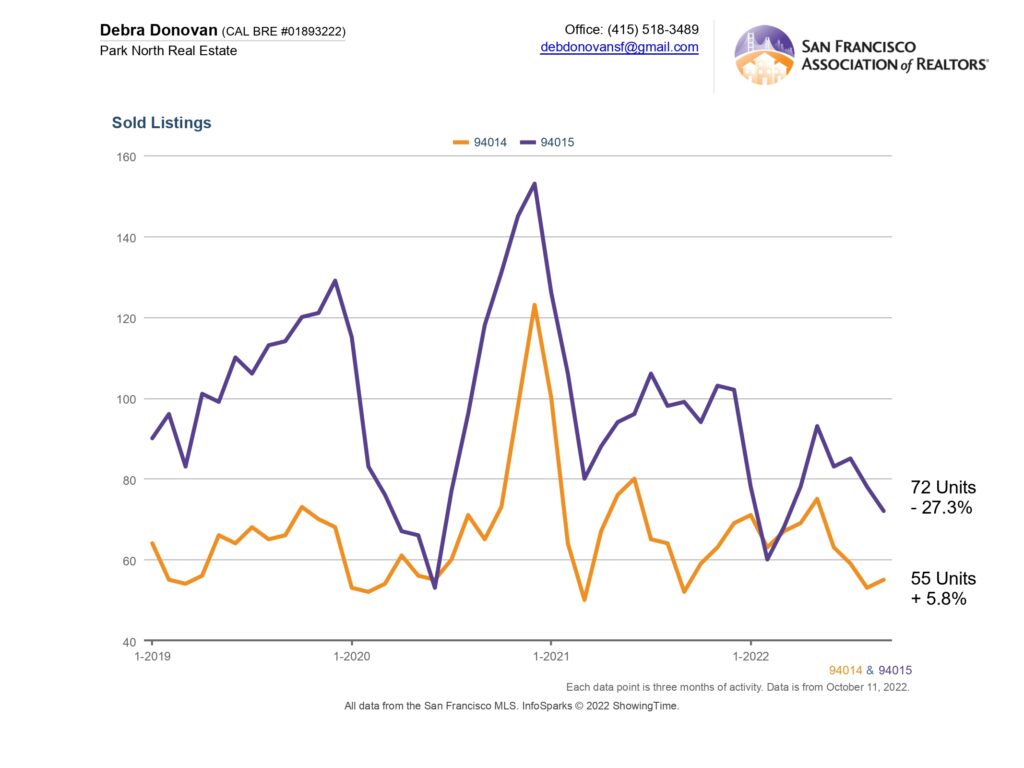
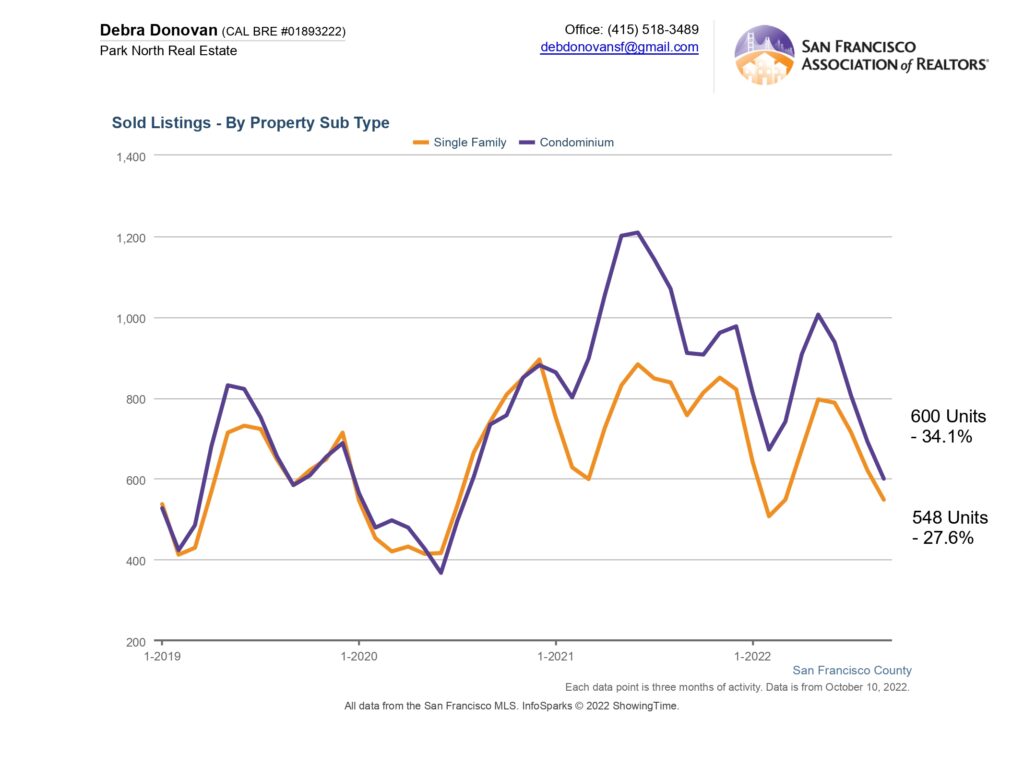
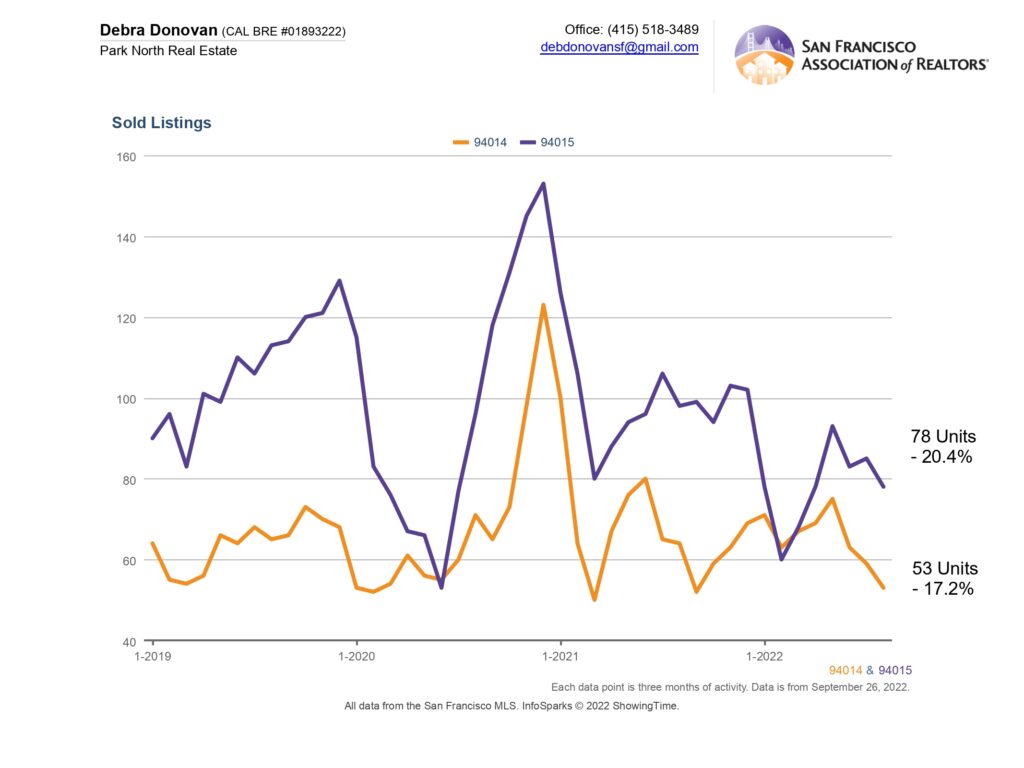
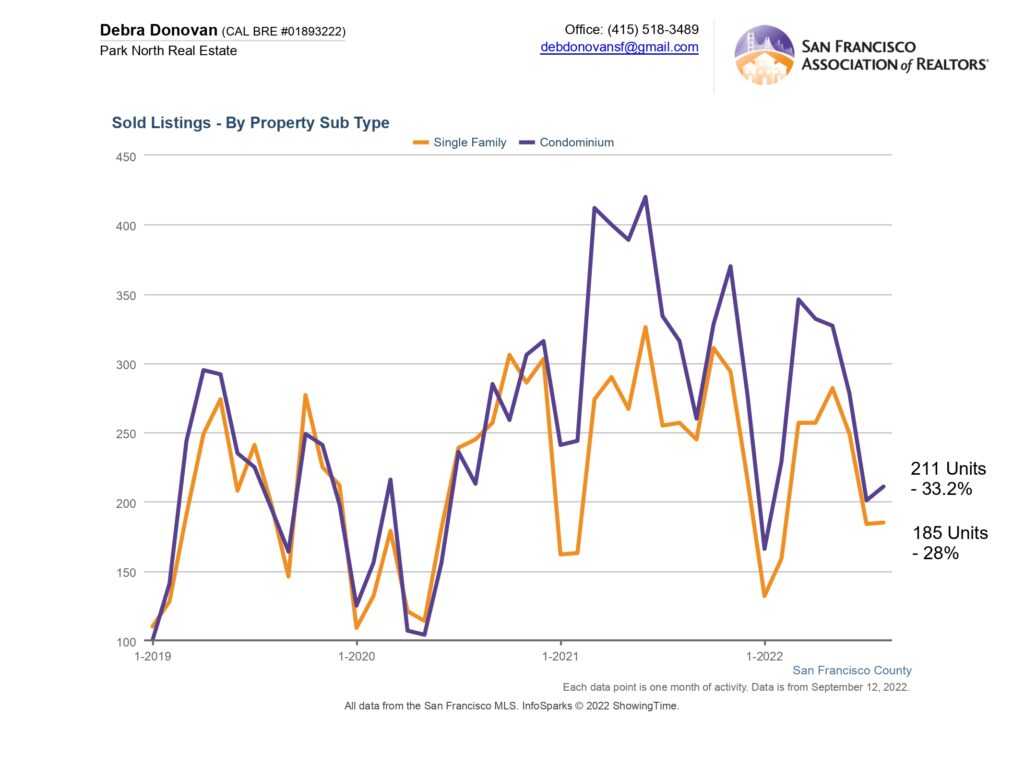
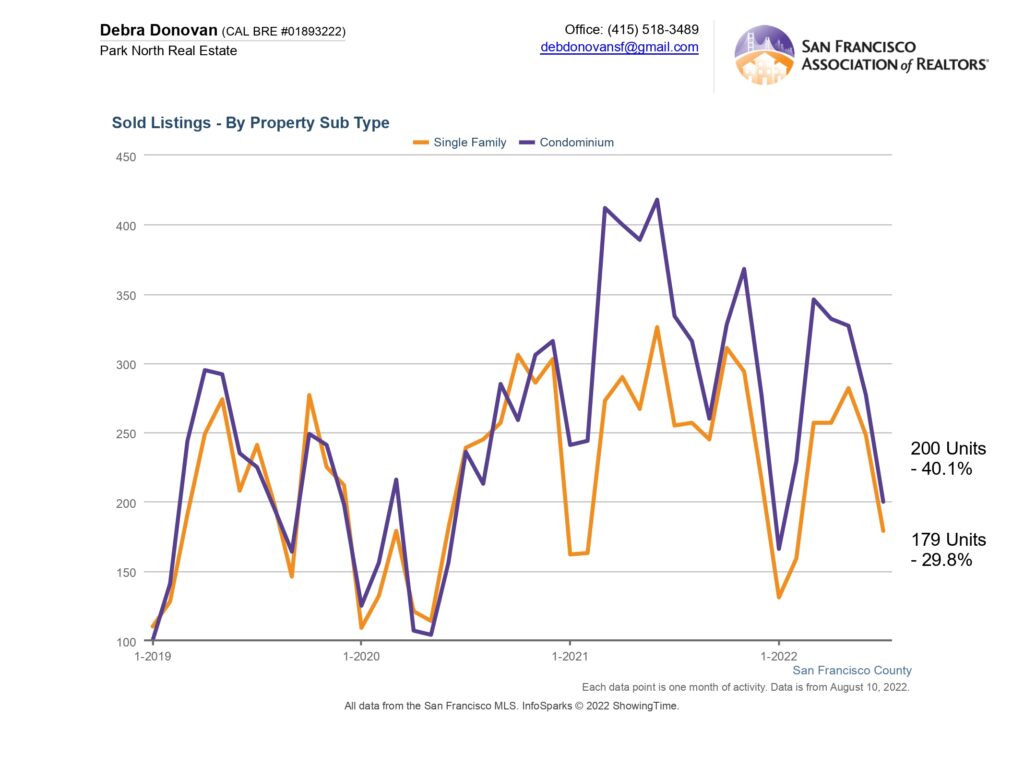
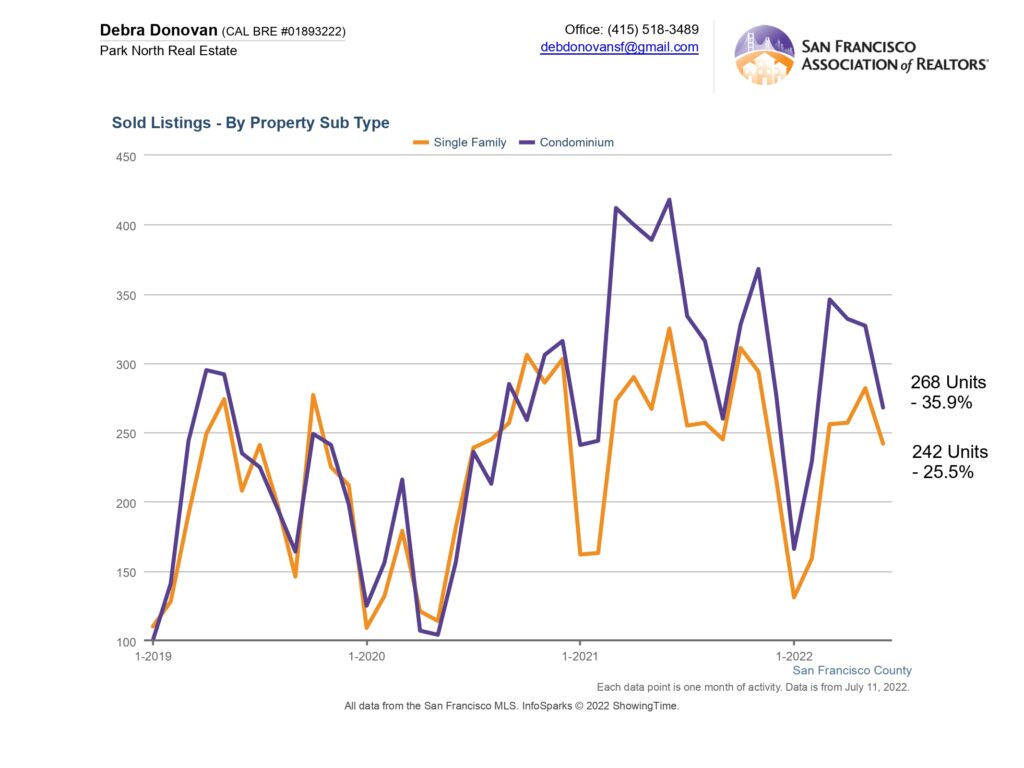
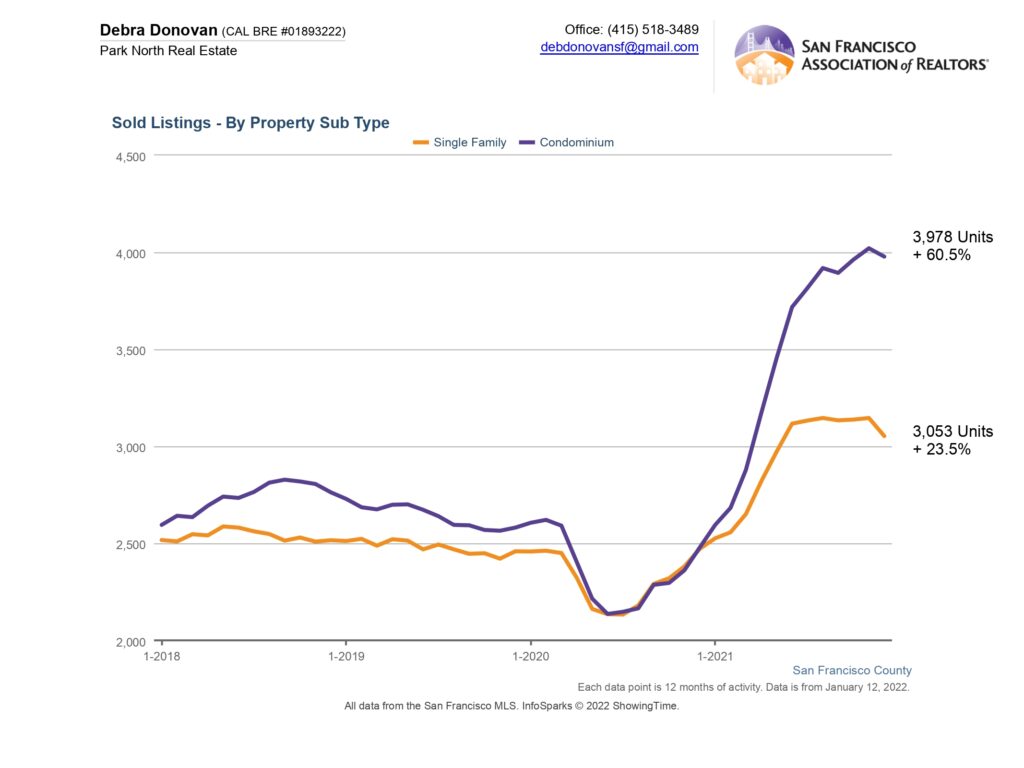
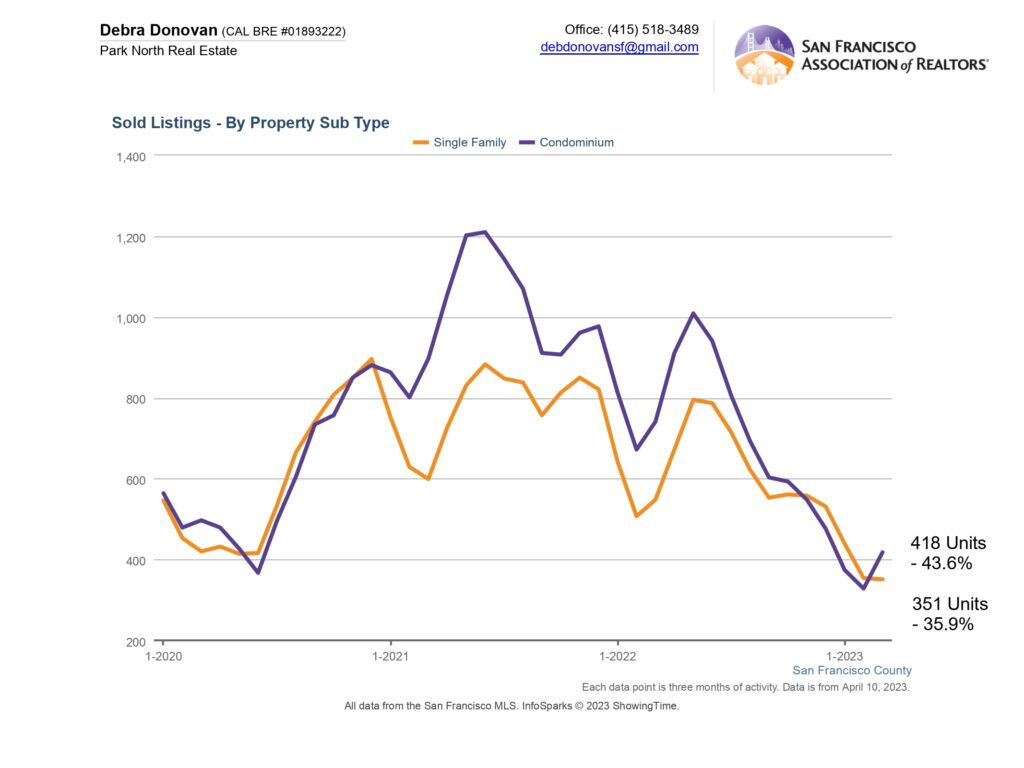
Sold Listings:
The number of listings that sold also decreased in Q1 2023 vs. Q1 2022. Partly this is due to fewer homes on the market, but it’s also because January and February were rainy and slow so homes stayed on the market longer.
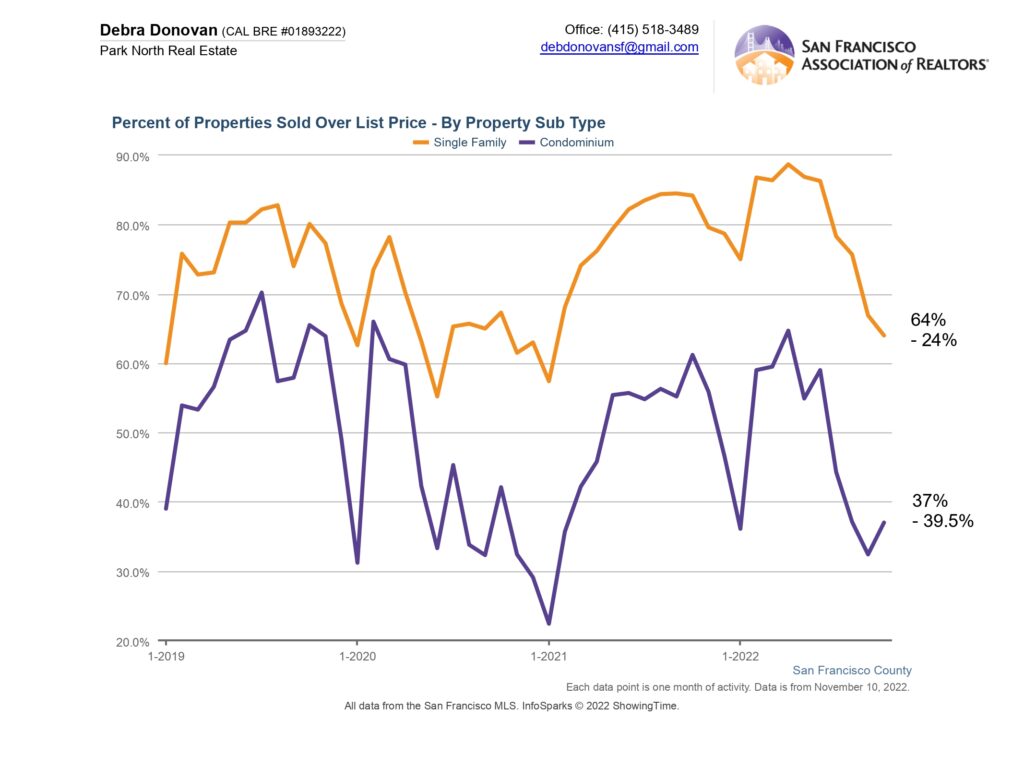
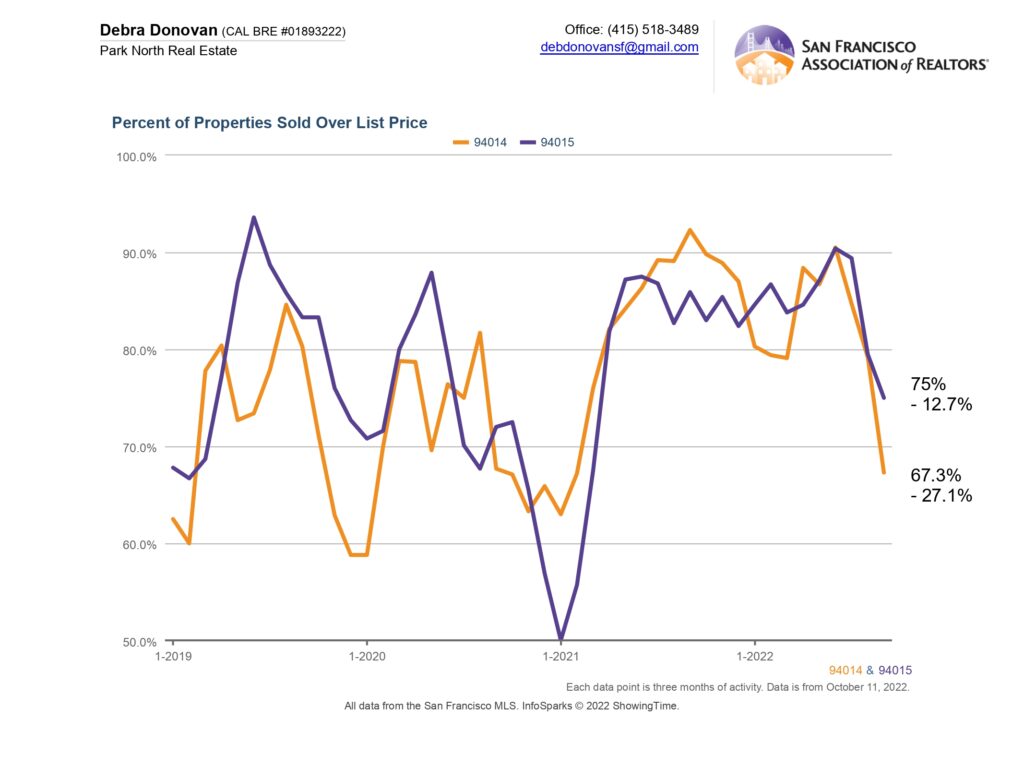
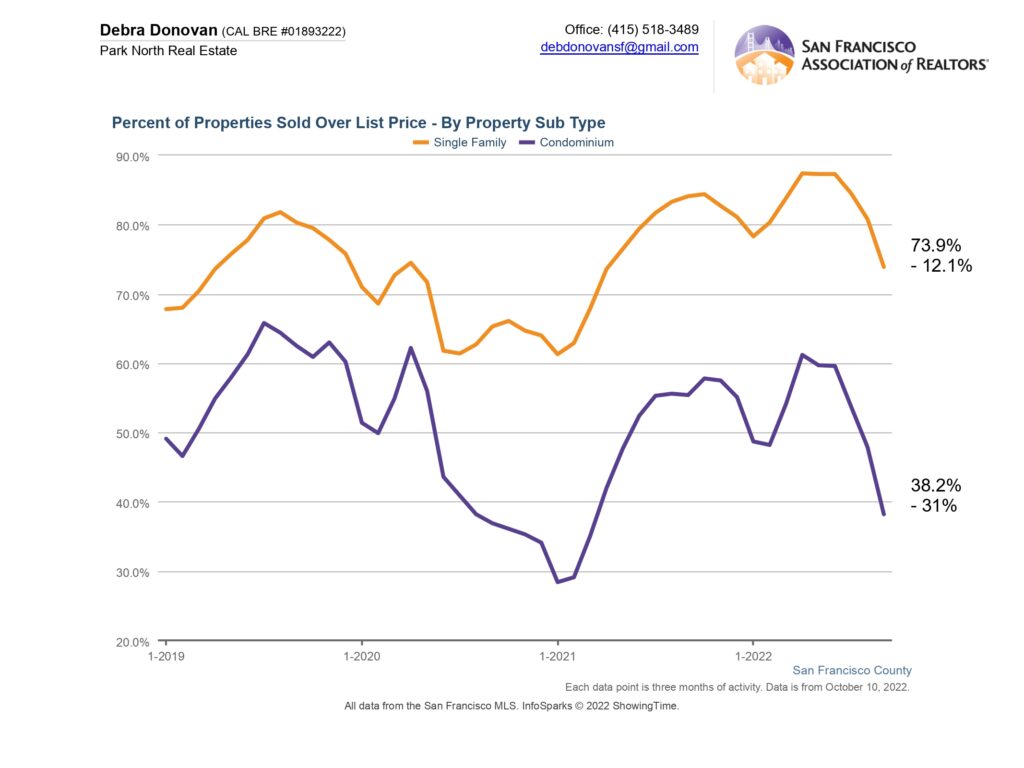
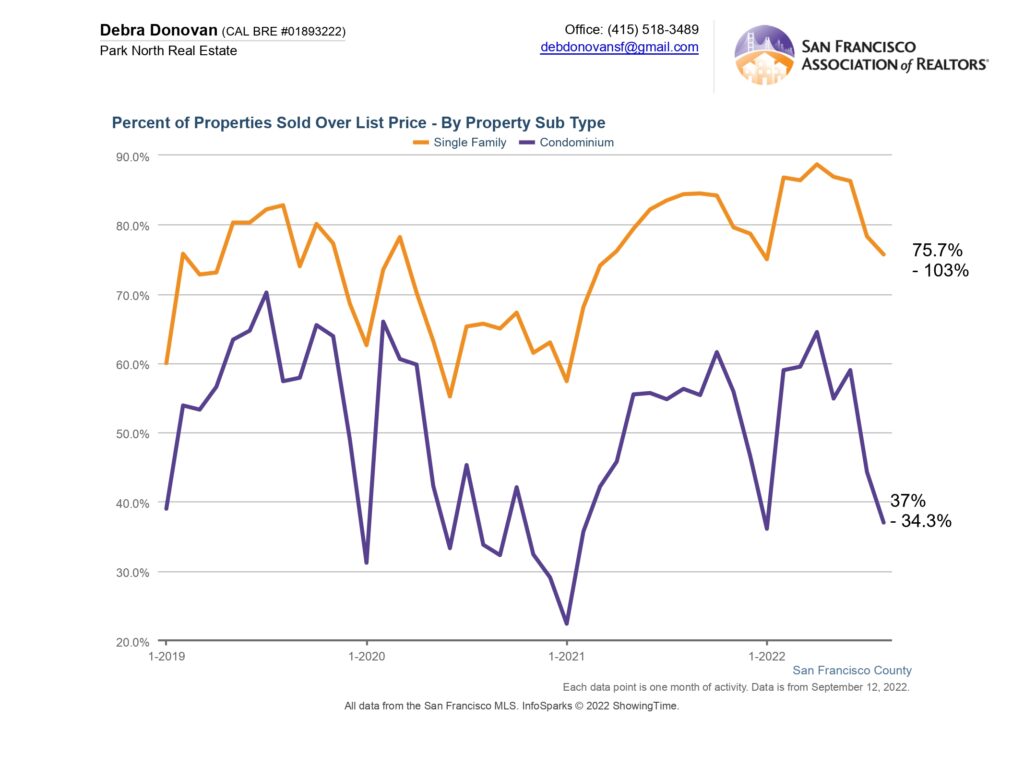
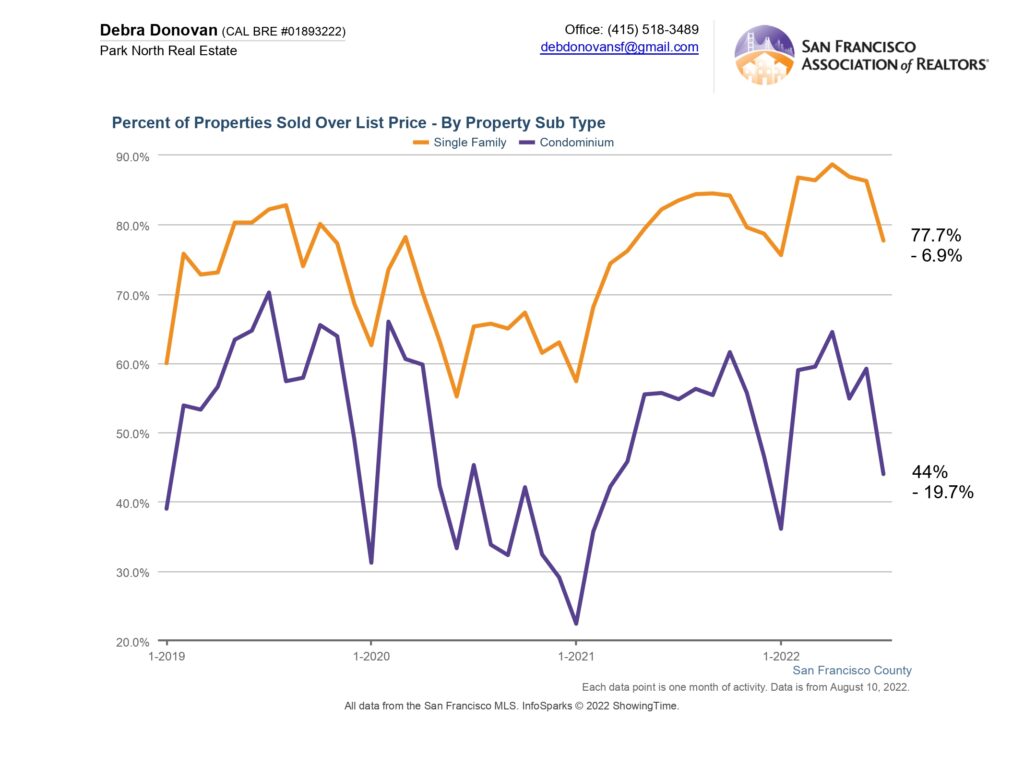
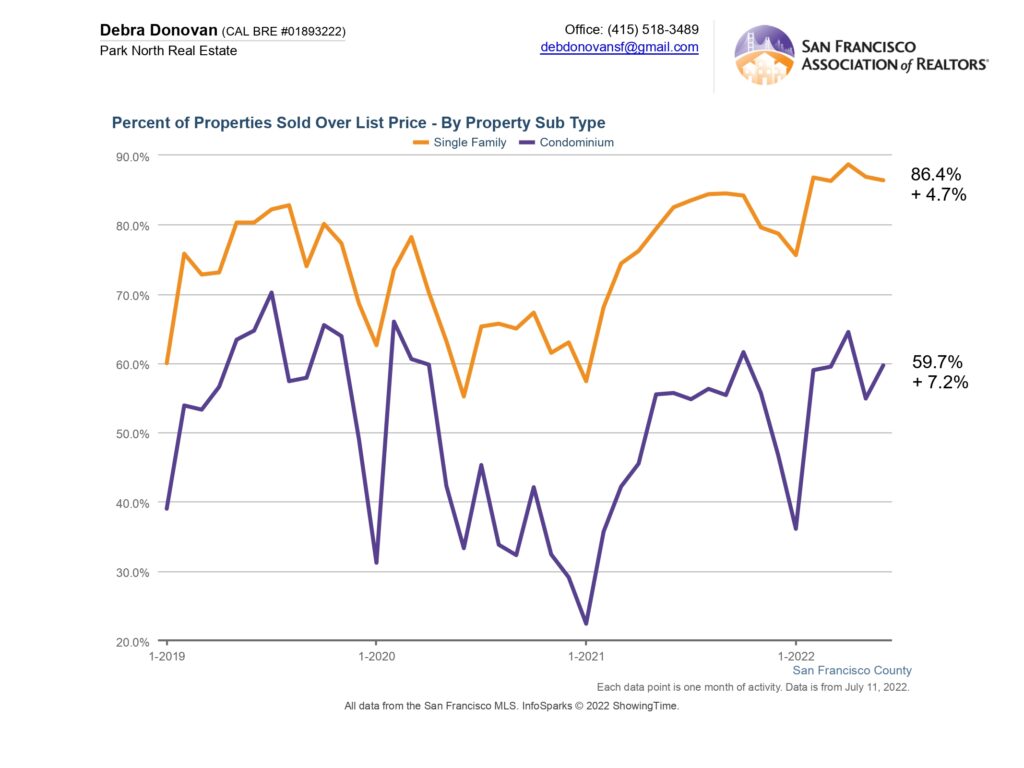
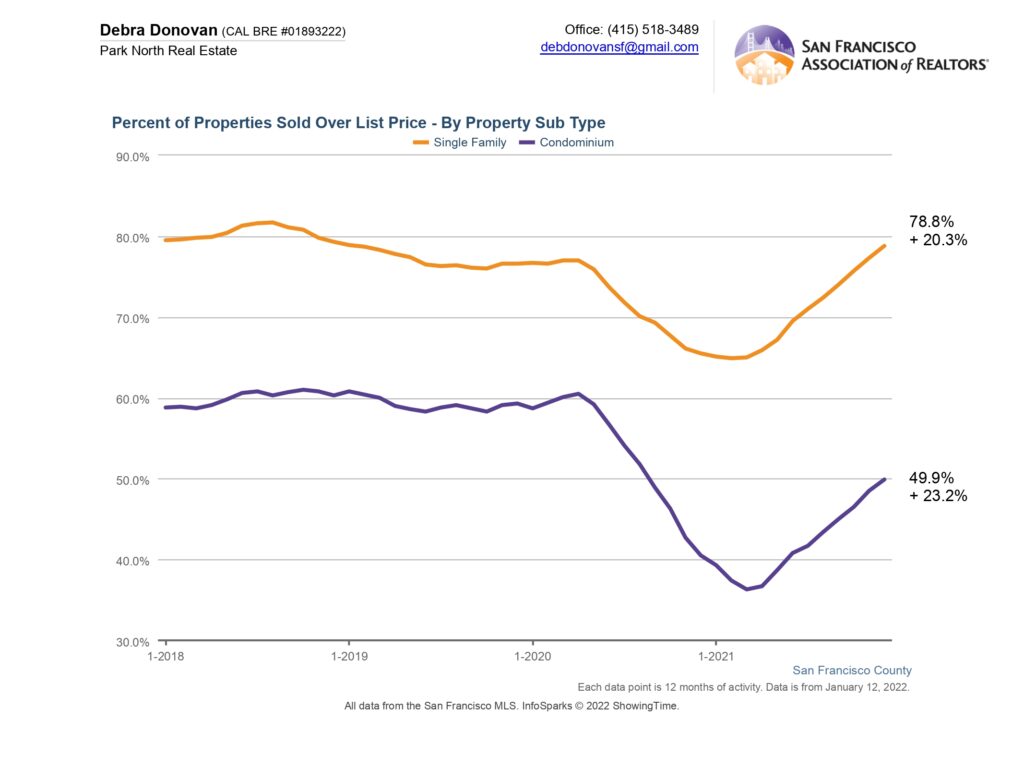
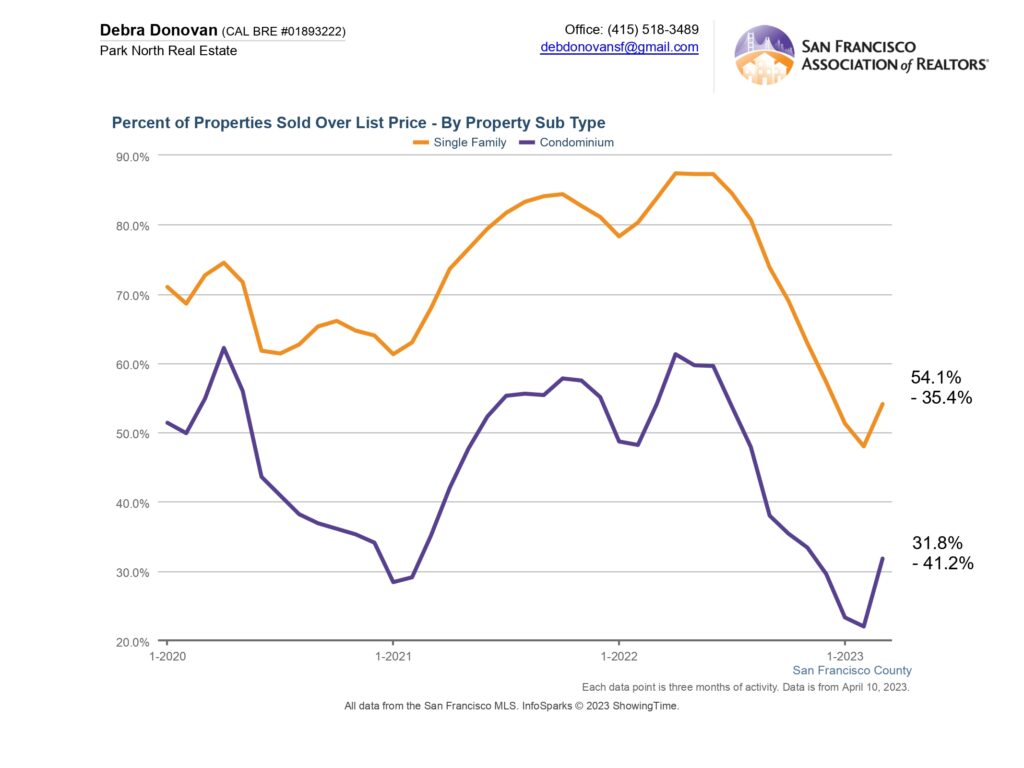
Percentage of Properties Sold Over List Price:
During slow Q1 fewer buyers meant fewer competitive offers and thus, fewer properties selling over their list price. Almost 55% of single family homes sold for over their asking price, down over 35% compared to the same quarter last year. About 32% of condos sold for more than their list price, down 41% compared to Q1 2022.
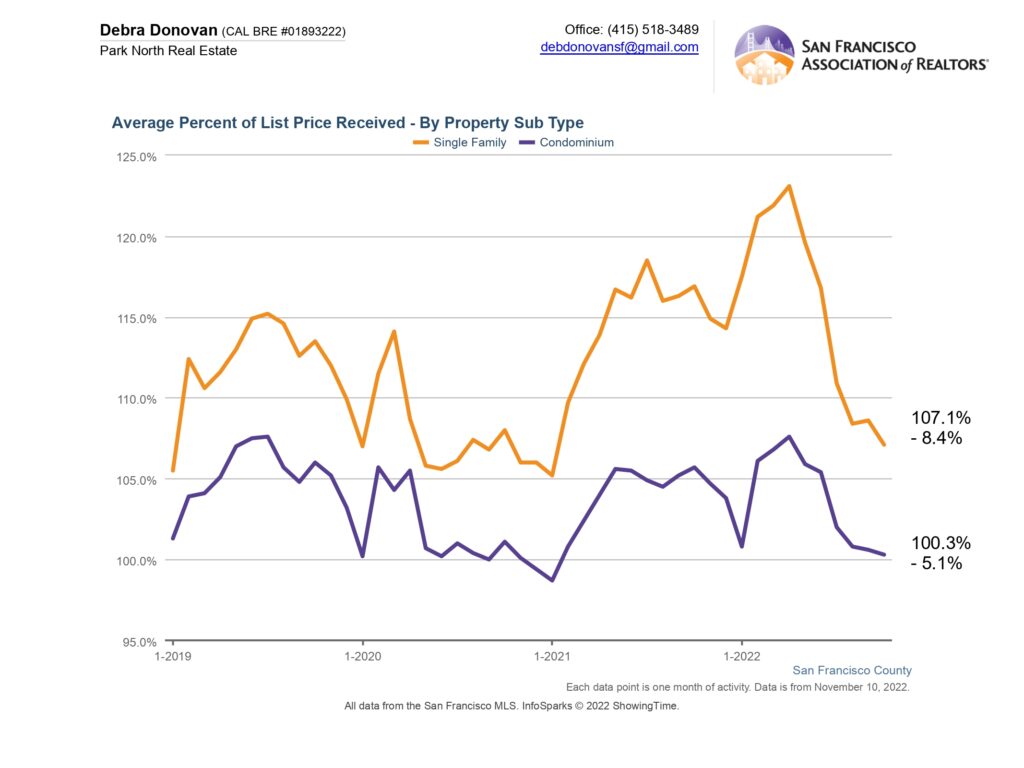
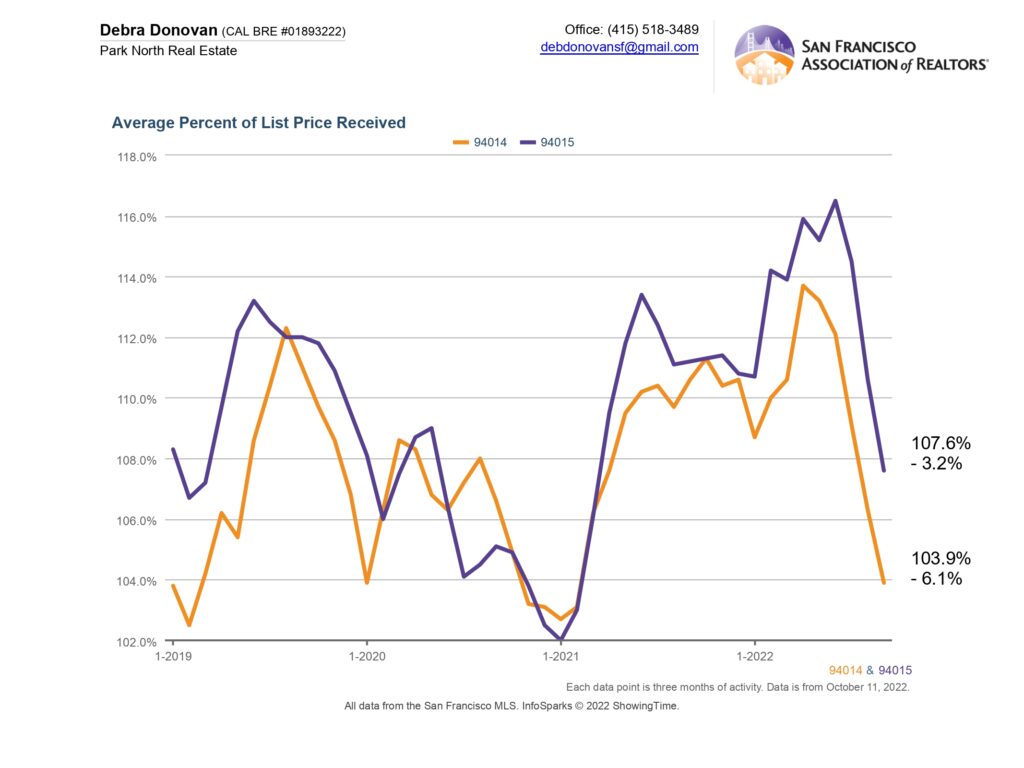
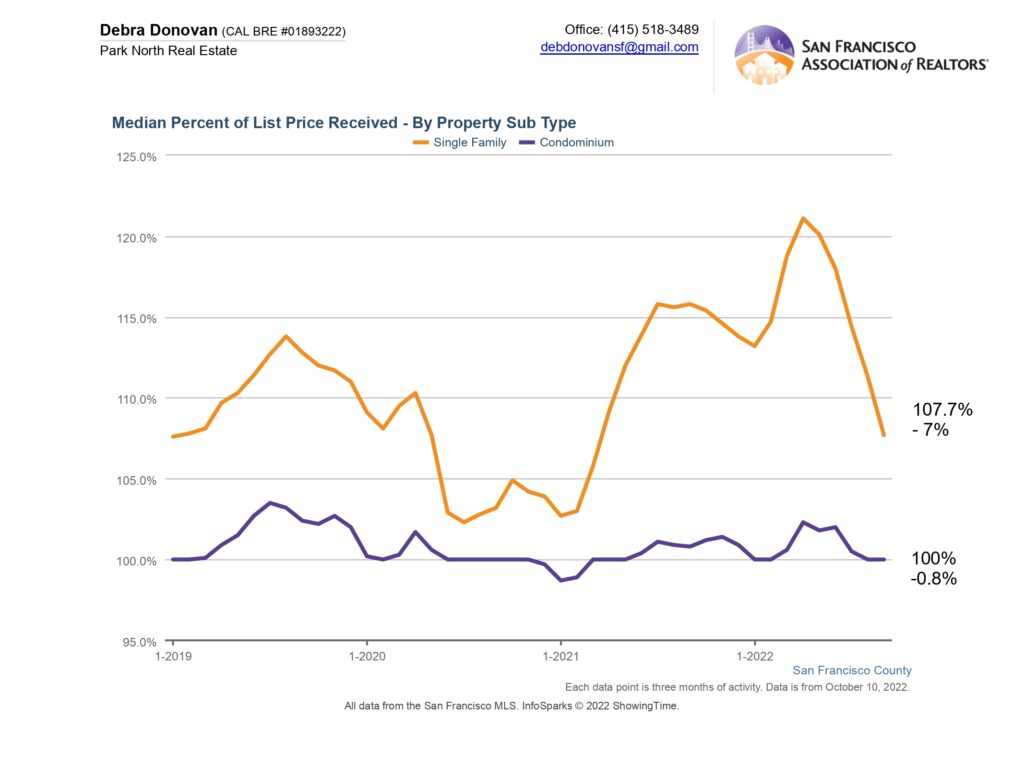
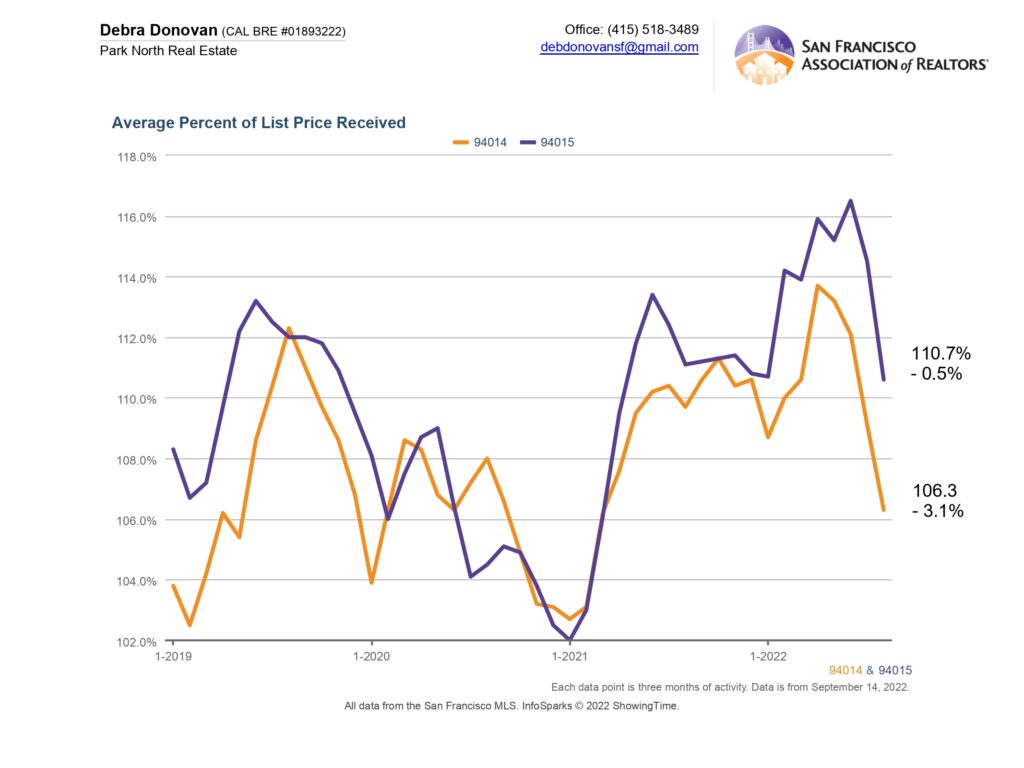
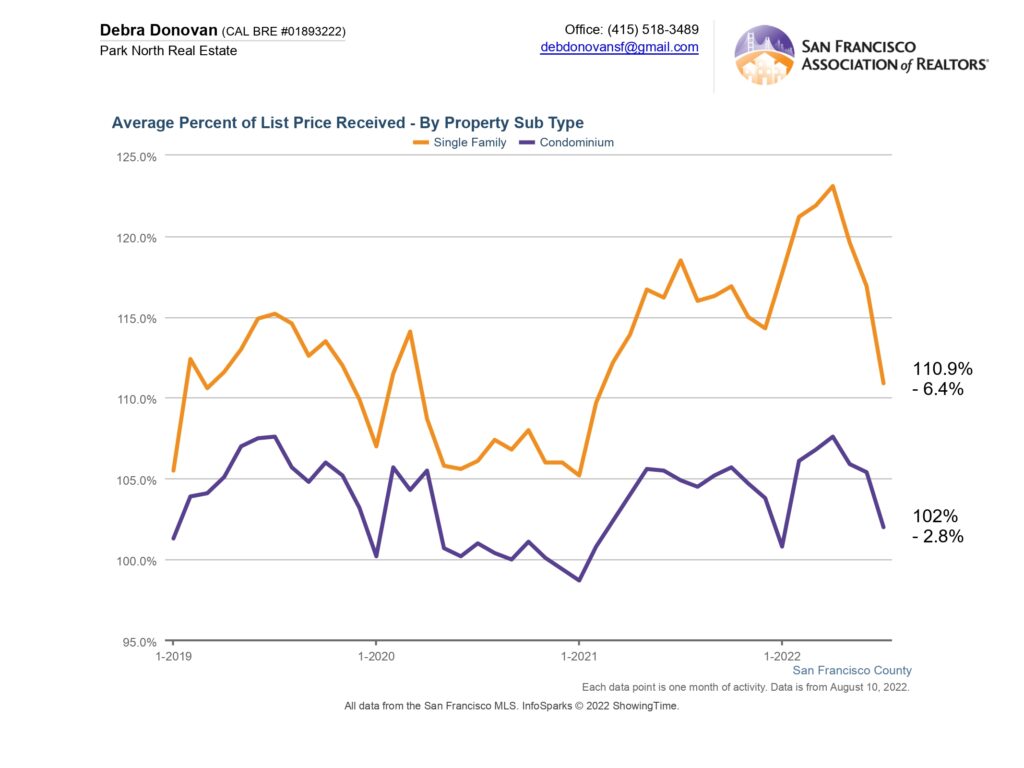
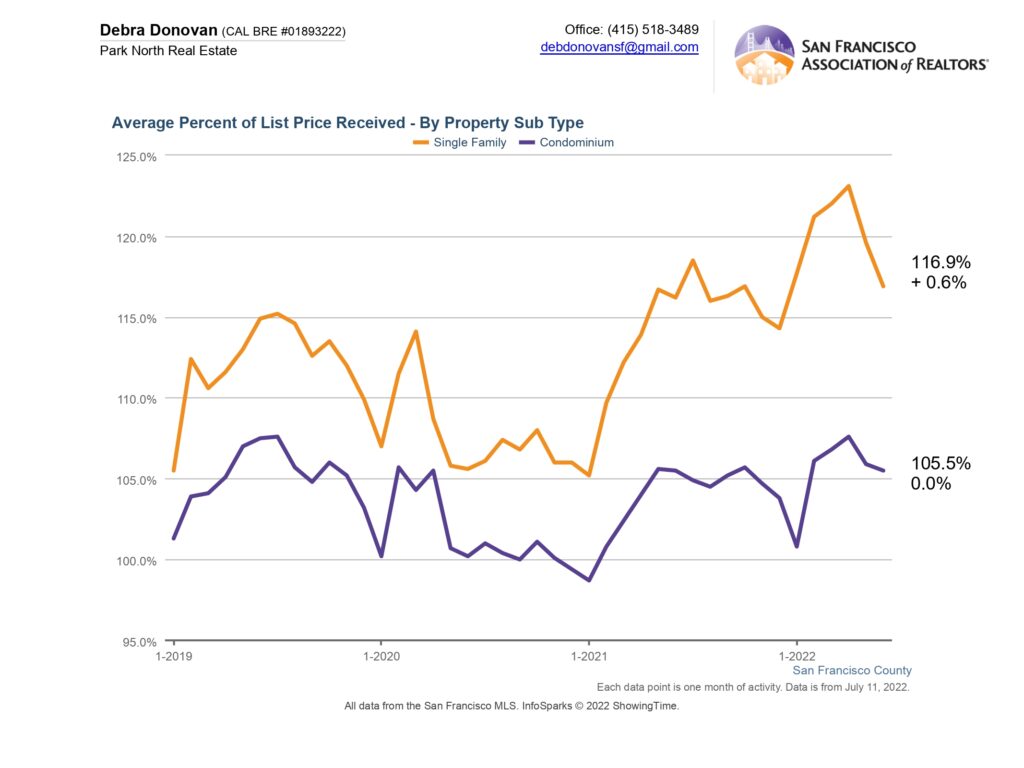
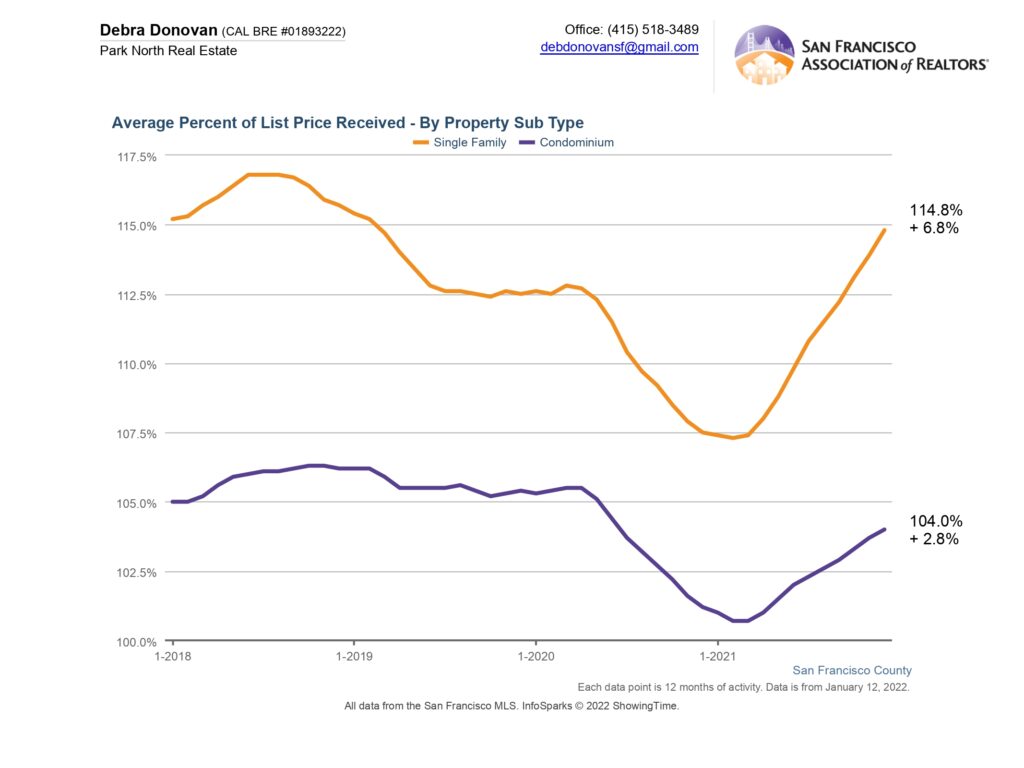
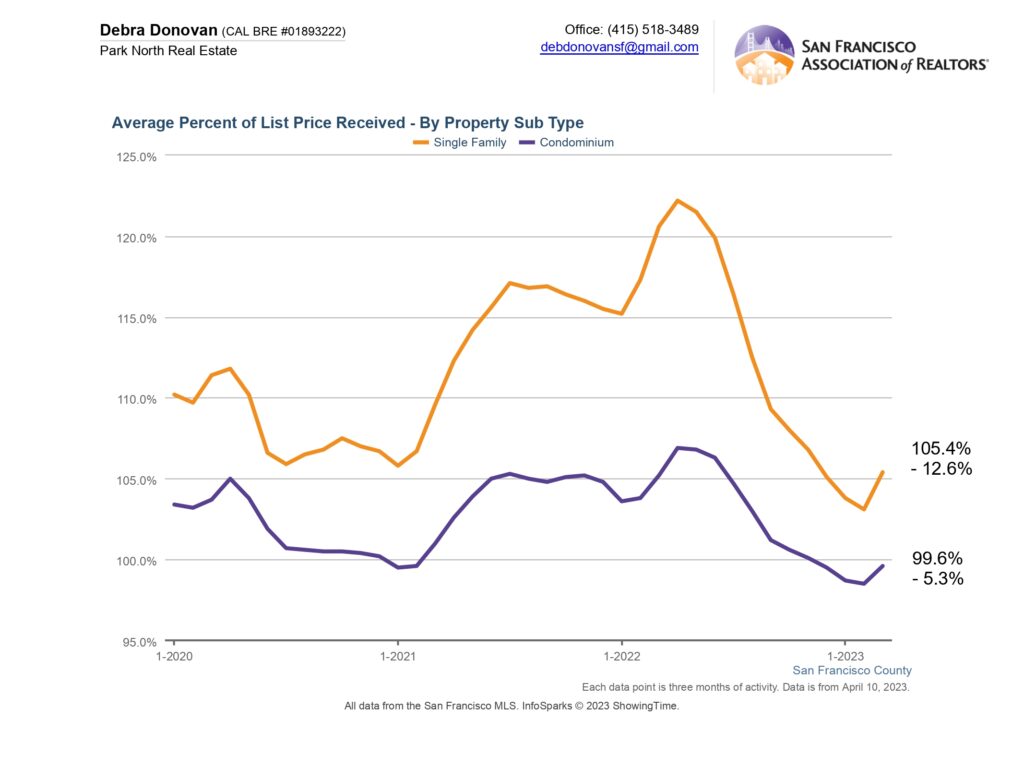
Average Percentage of List Price Received:
Single family homes sold for an average of 105.4% of list price, down 12.6% compared to over 120% in Q1 2022. Condos sold for an average of 99.6%, or just under list price, in the first quarter. This was down over 5% compared to the same quarter last year.
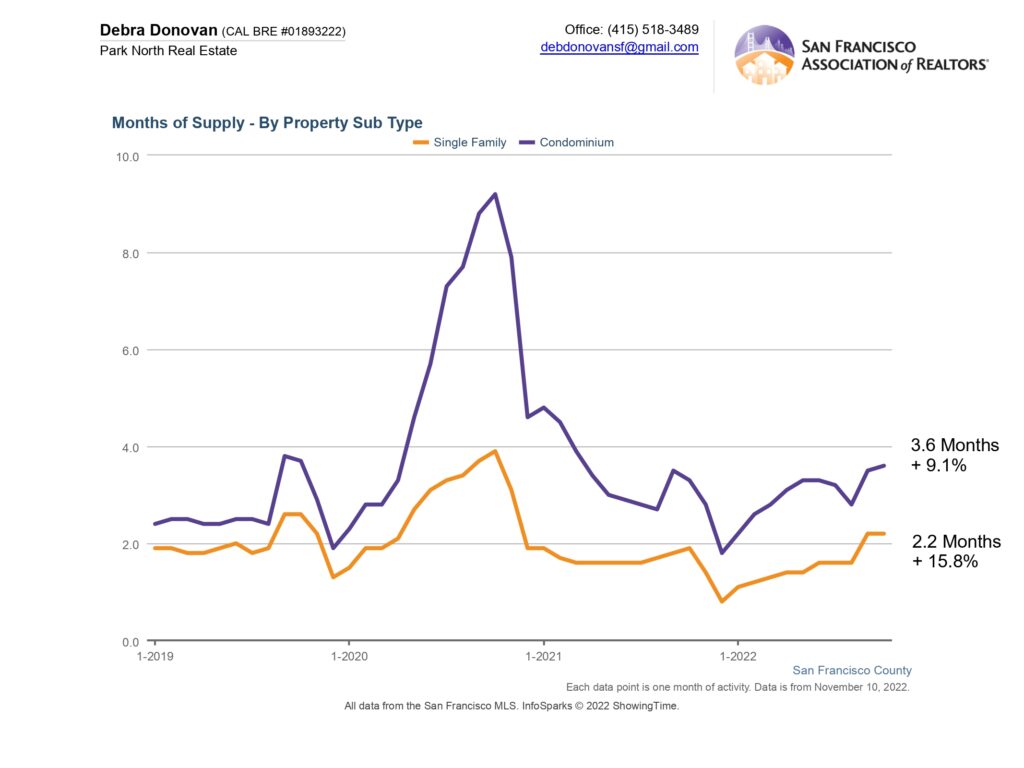
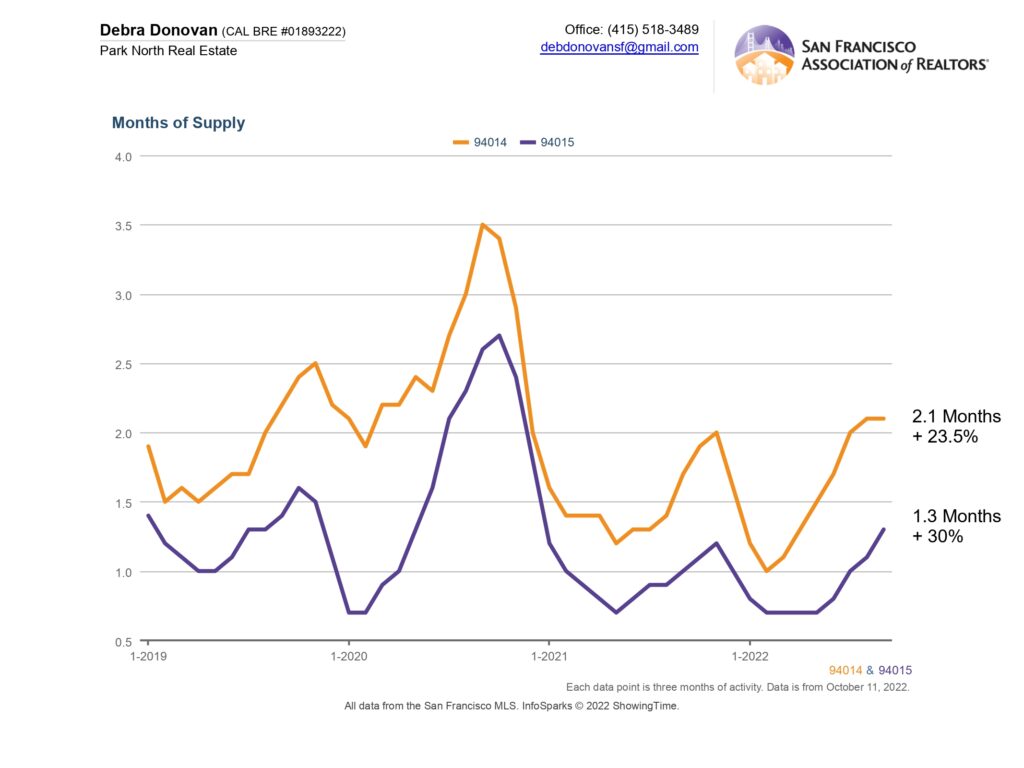
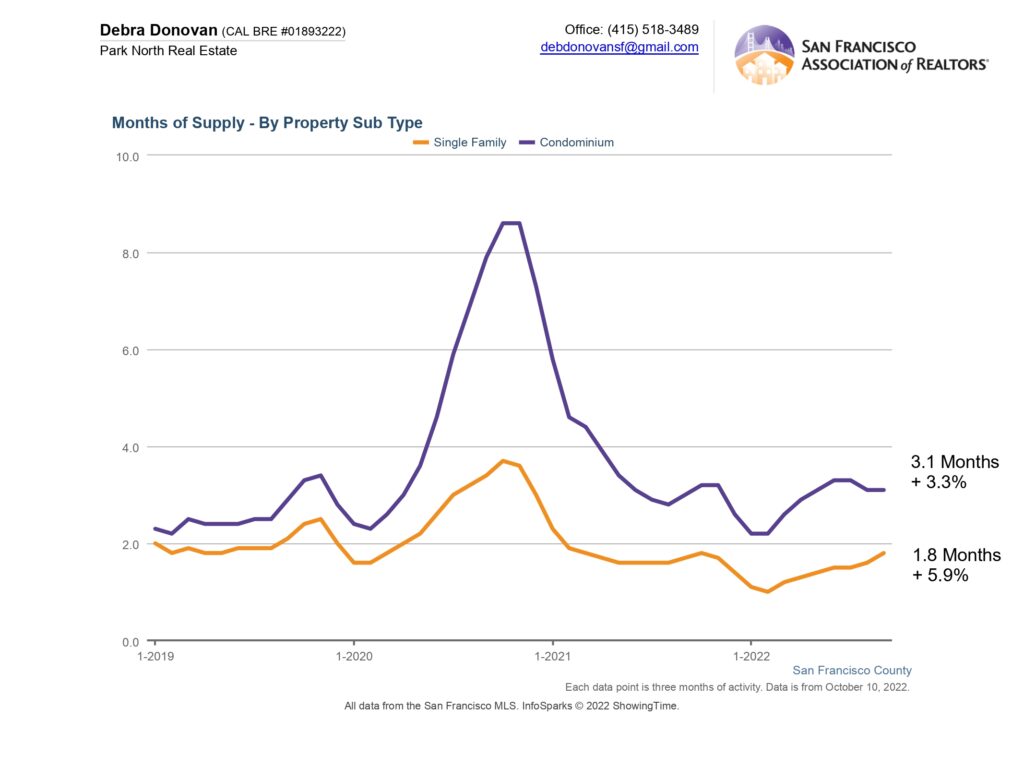
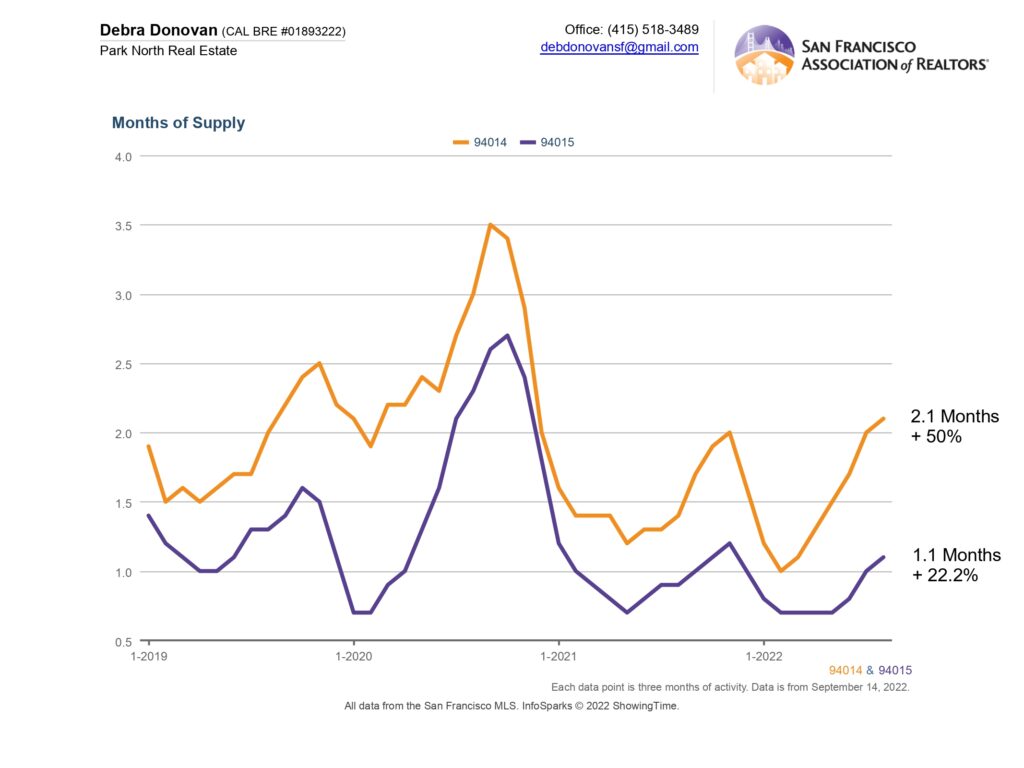
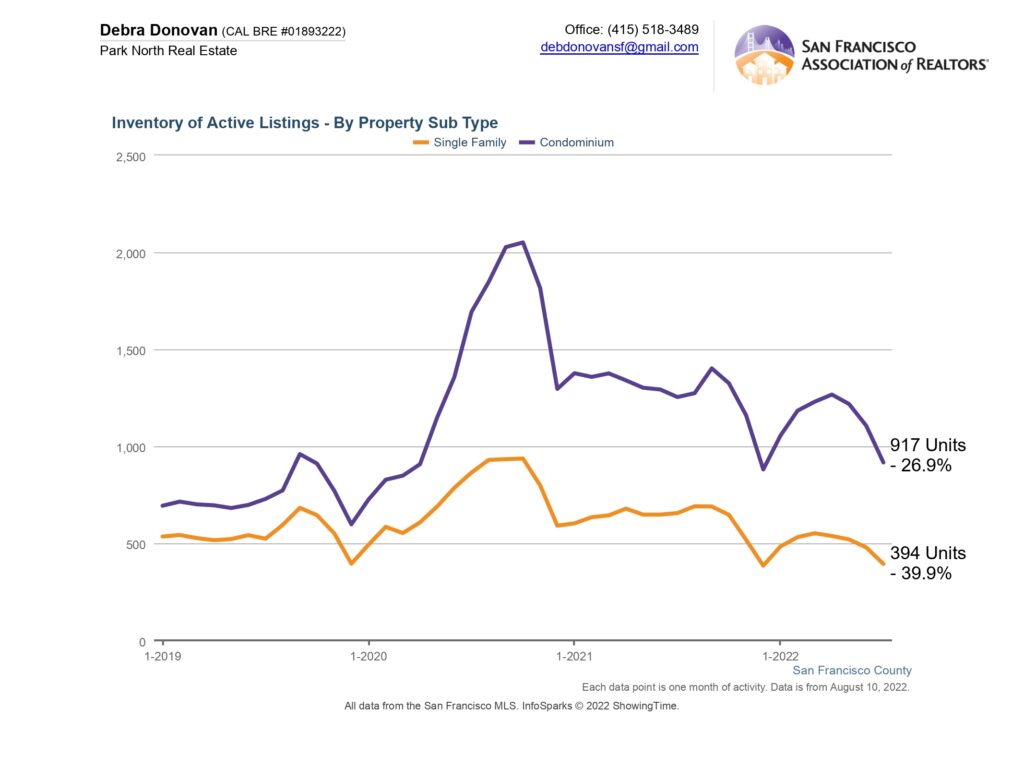
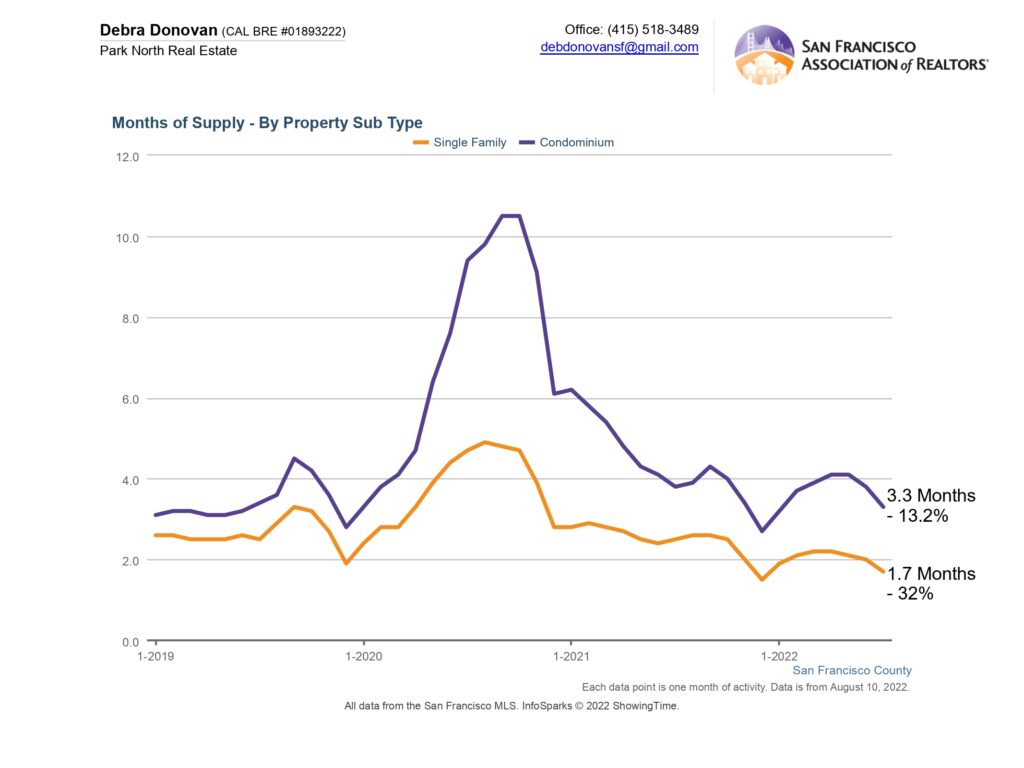
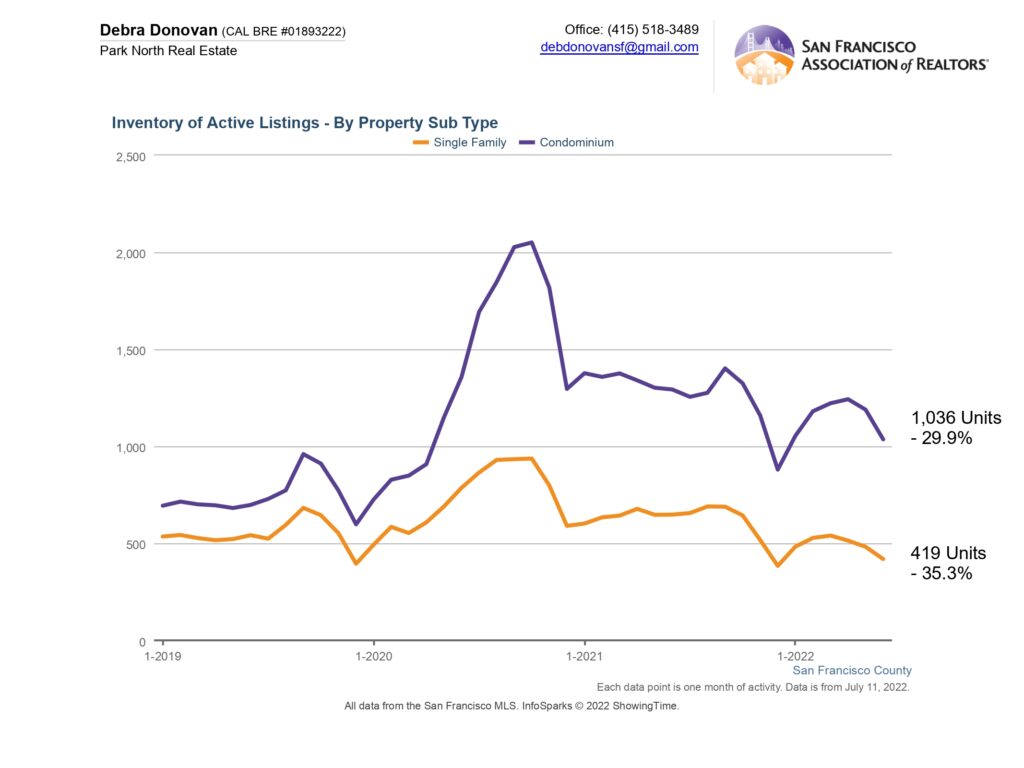
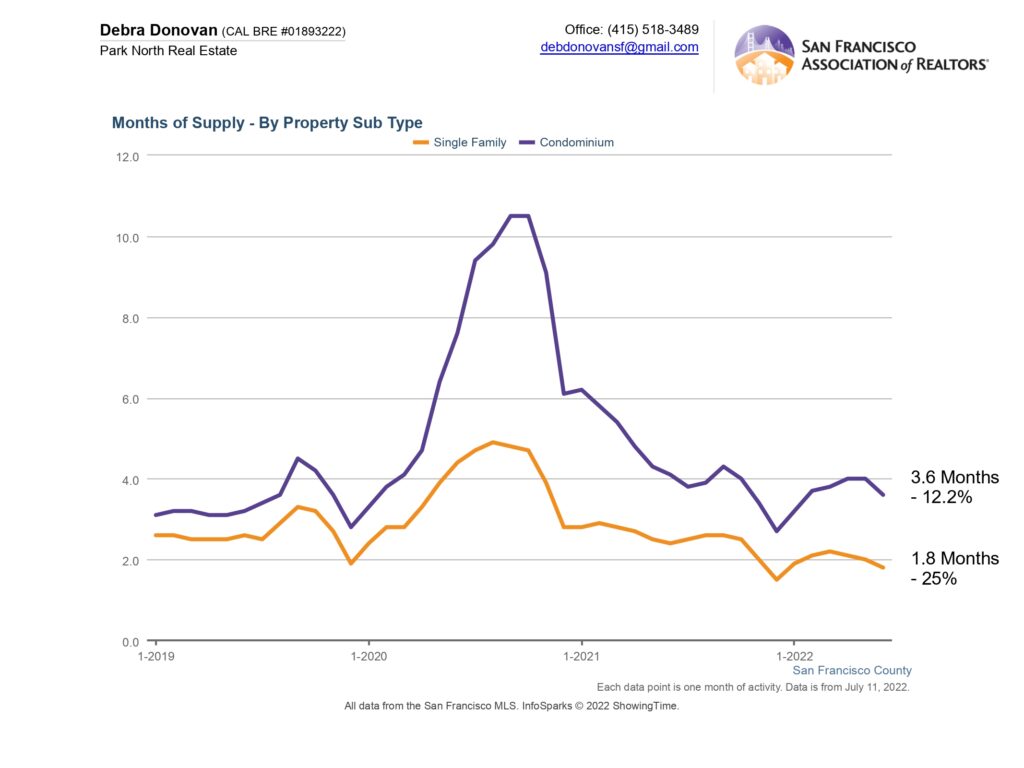
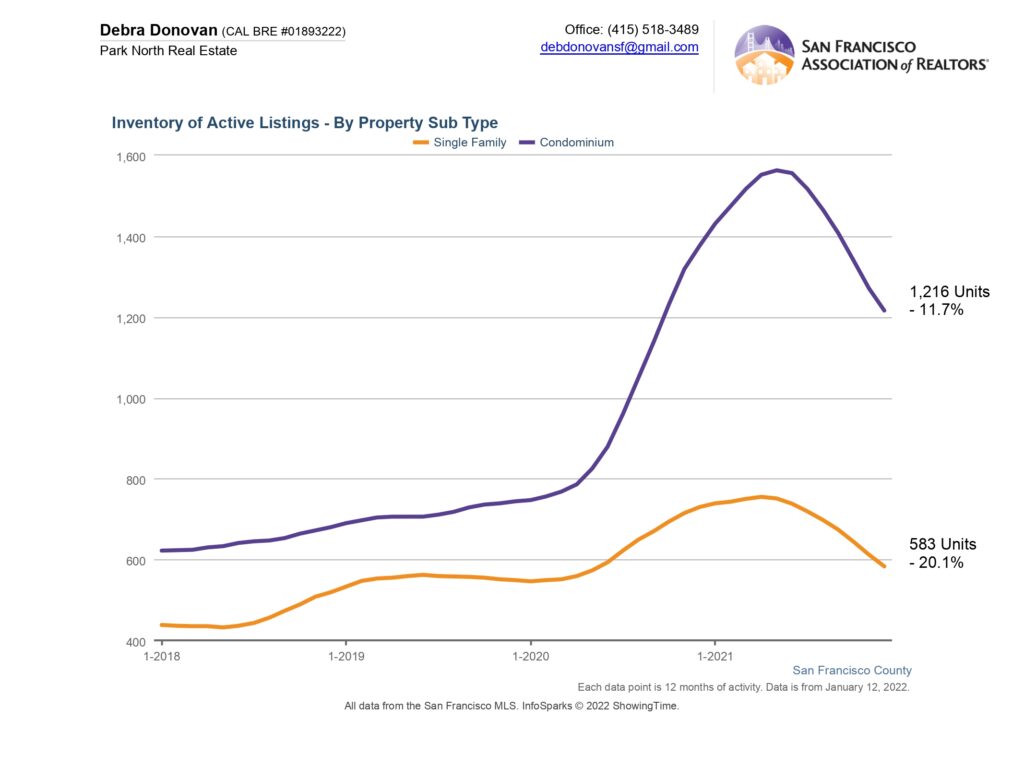
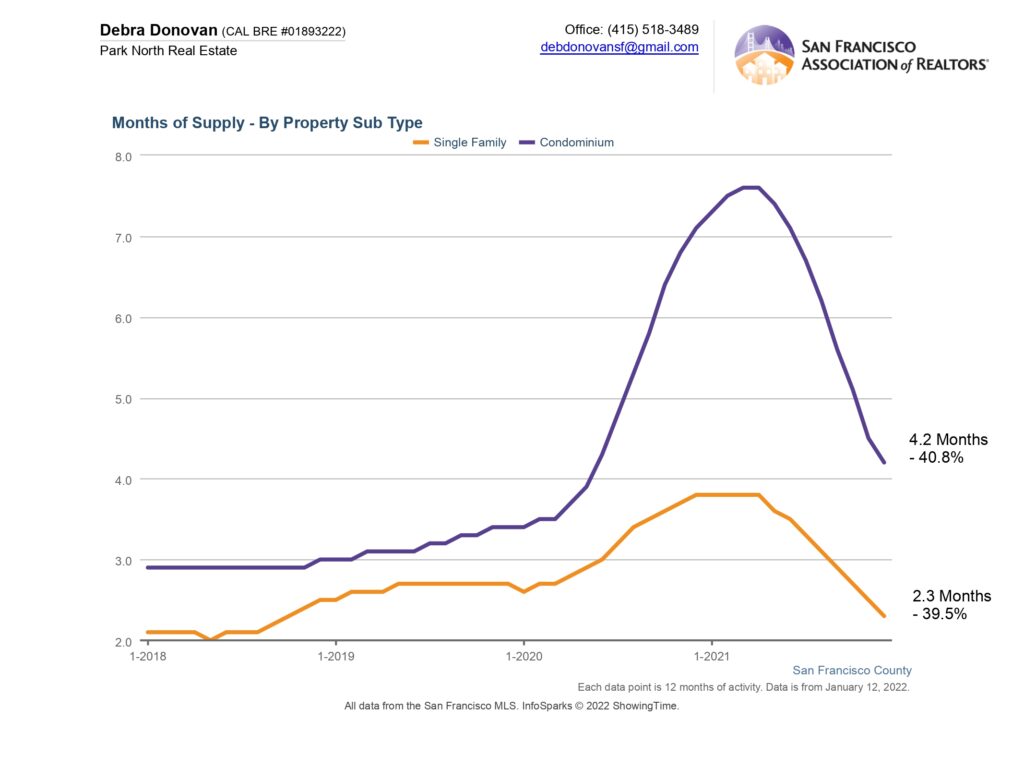
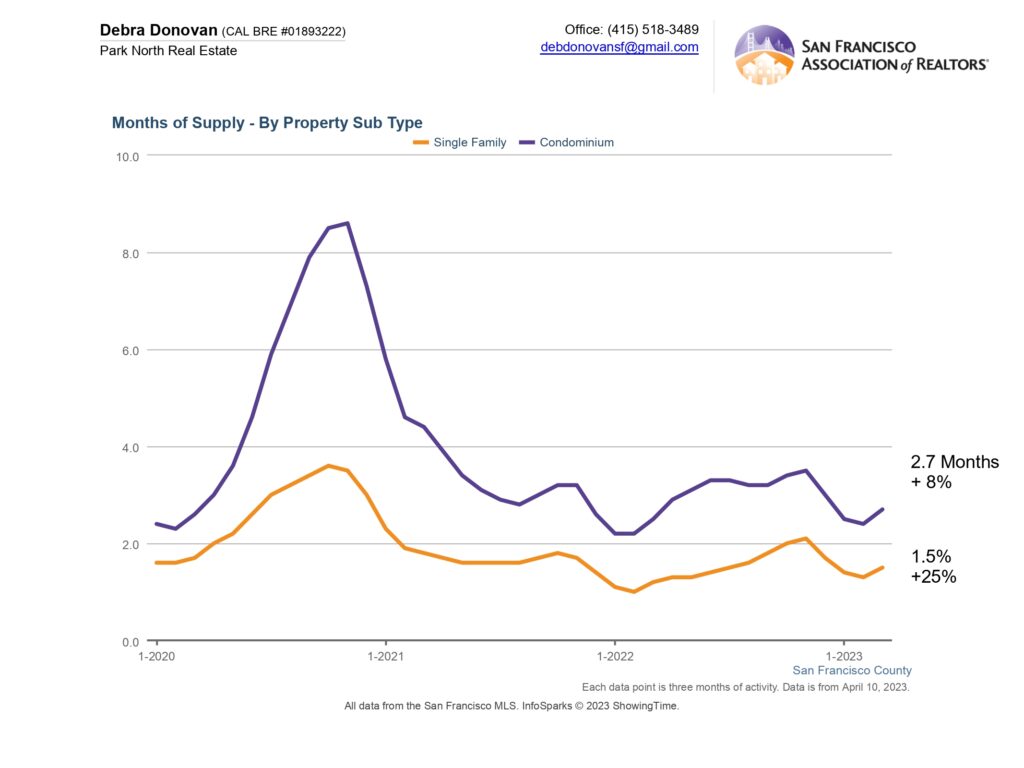
Months Supply of Inventory:
Month’s supply of inventory, or MSI, measures how quickly homes are selling through in the current market. An MSI of 5 months or less is usually considered a seller’s market, and 6+ months of inventory indicates a buyer’s market. In Q1 2023 single family homes had an MSI or about 1.5 months, still a seller’s market and yet up 25% compared to the same quarter last year. Condos had 2.7 months of inventory, up 8% compared to last year but still in seller’s market territory.
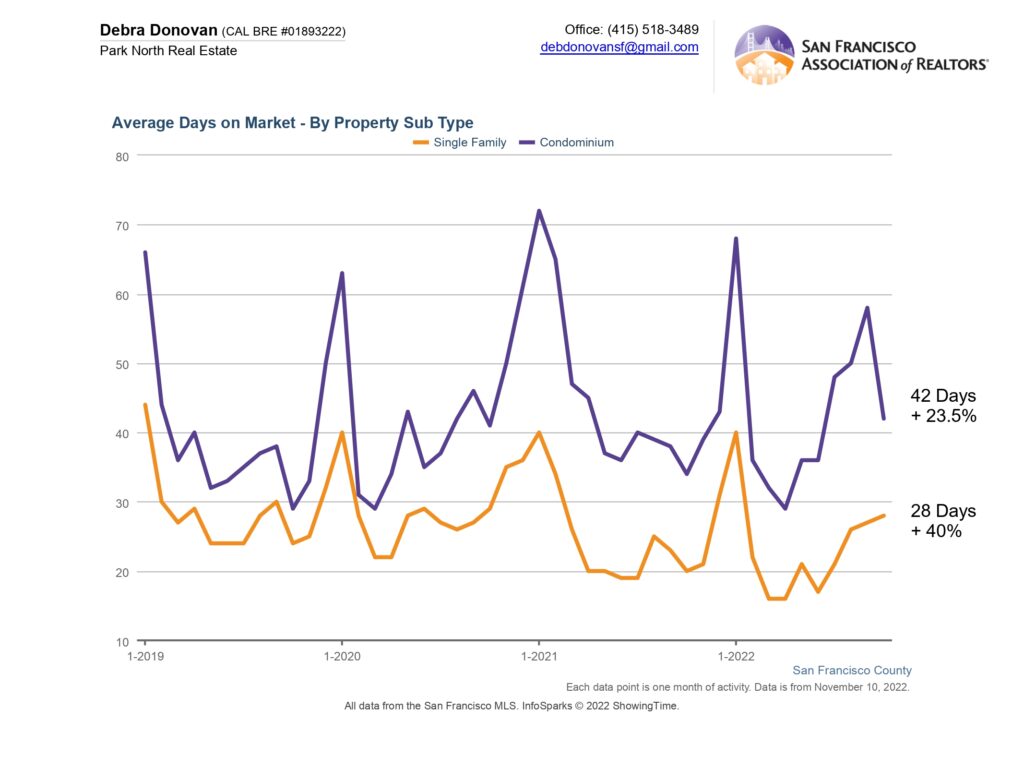
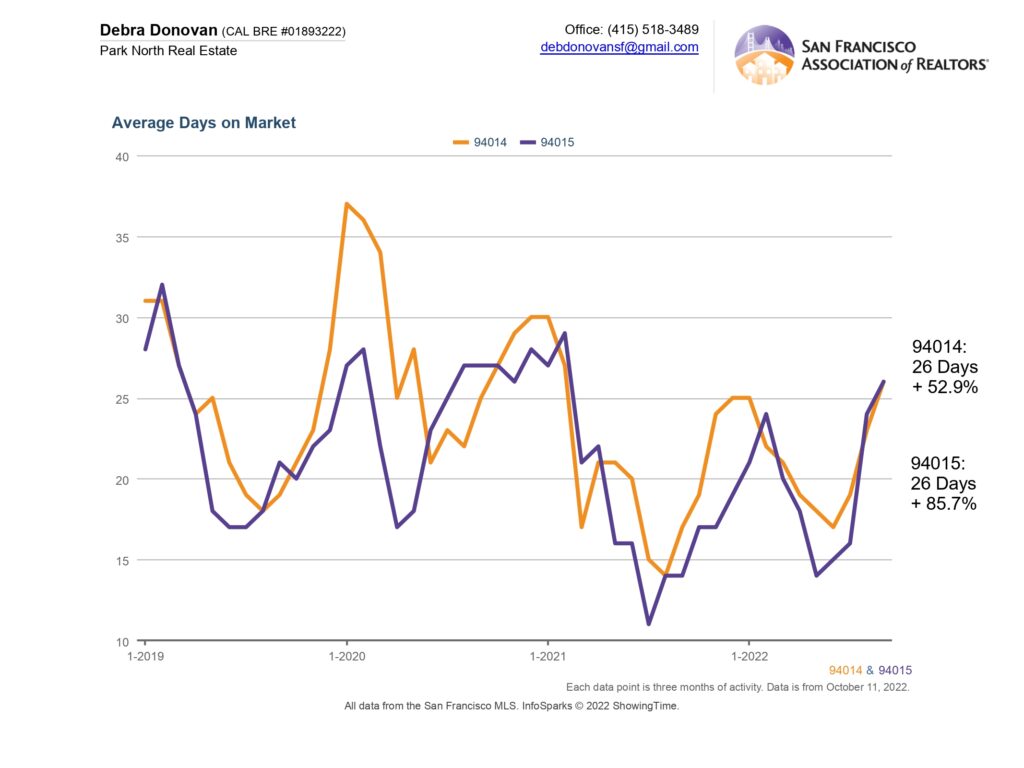
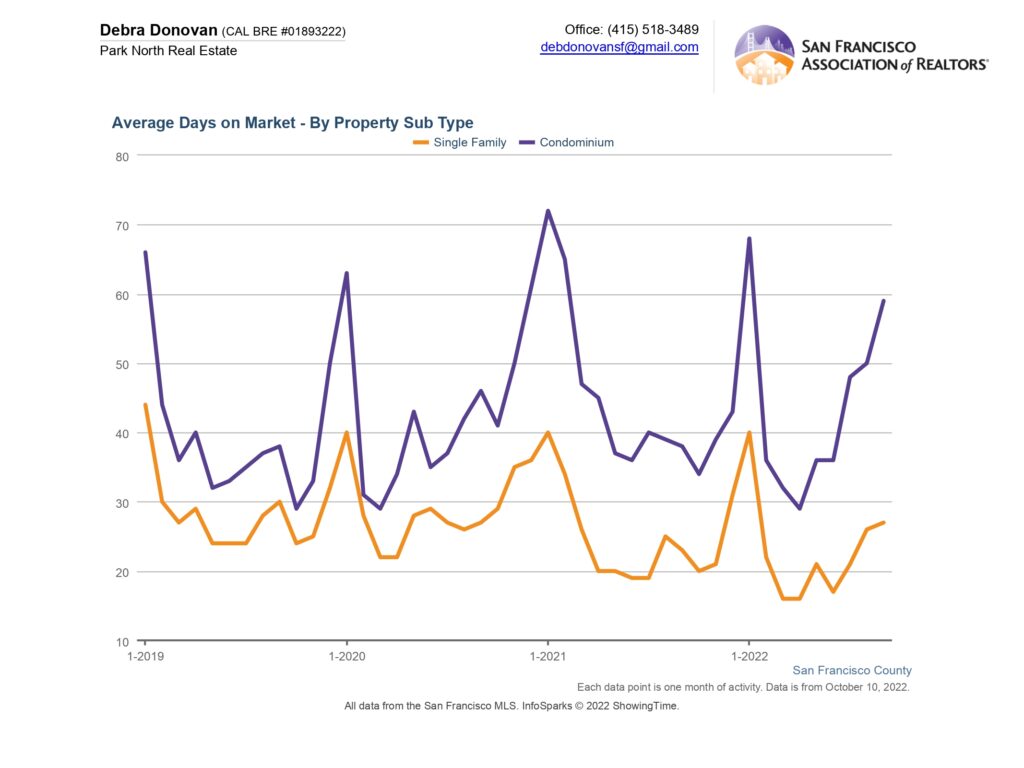
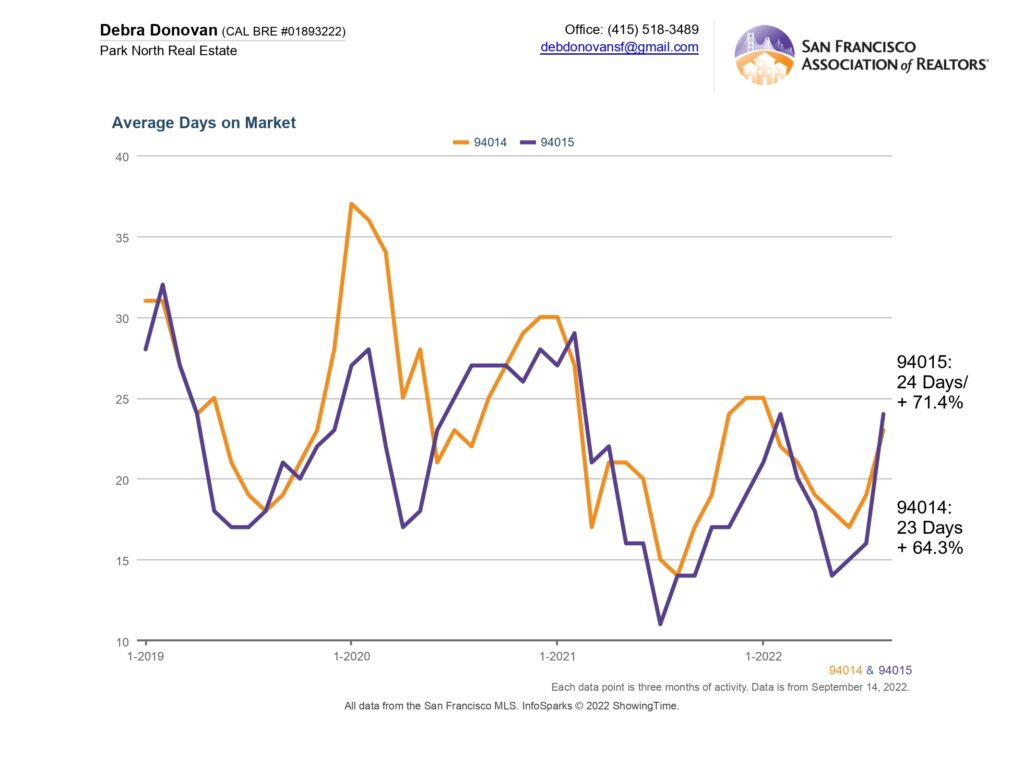
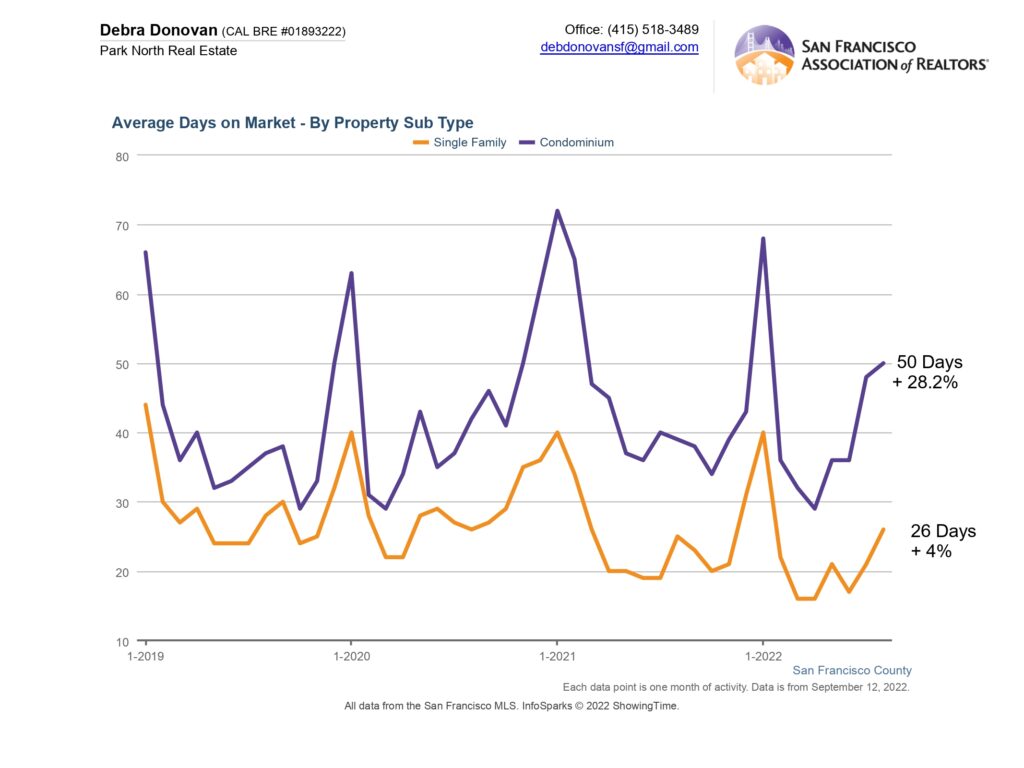
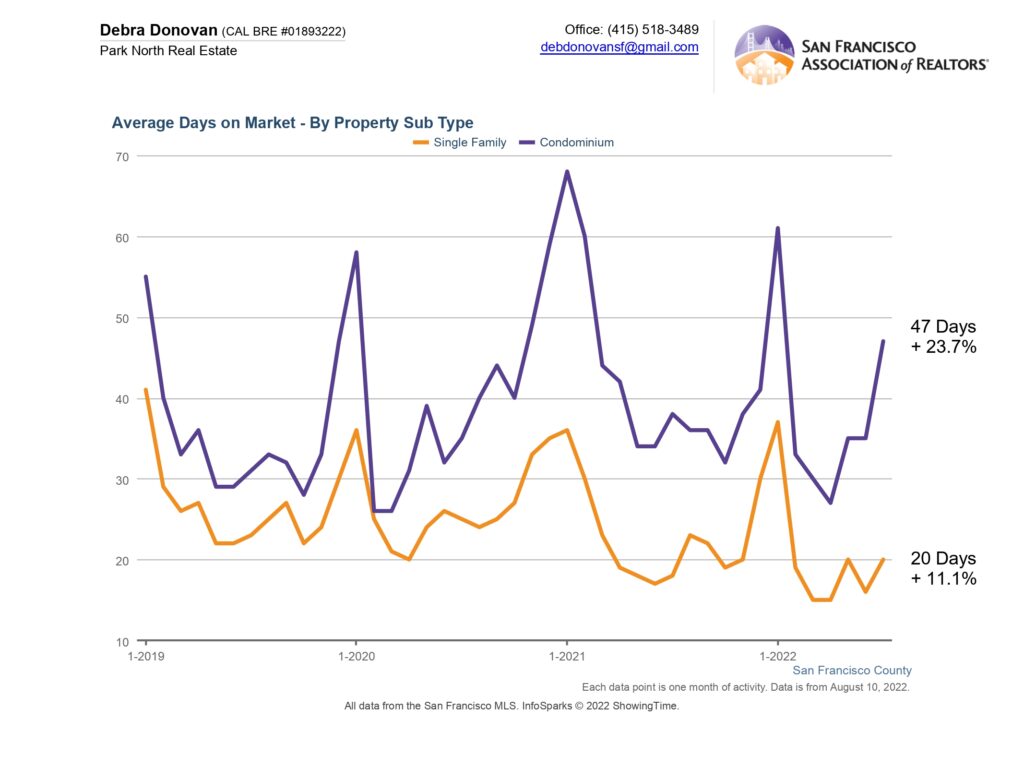
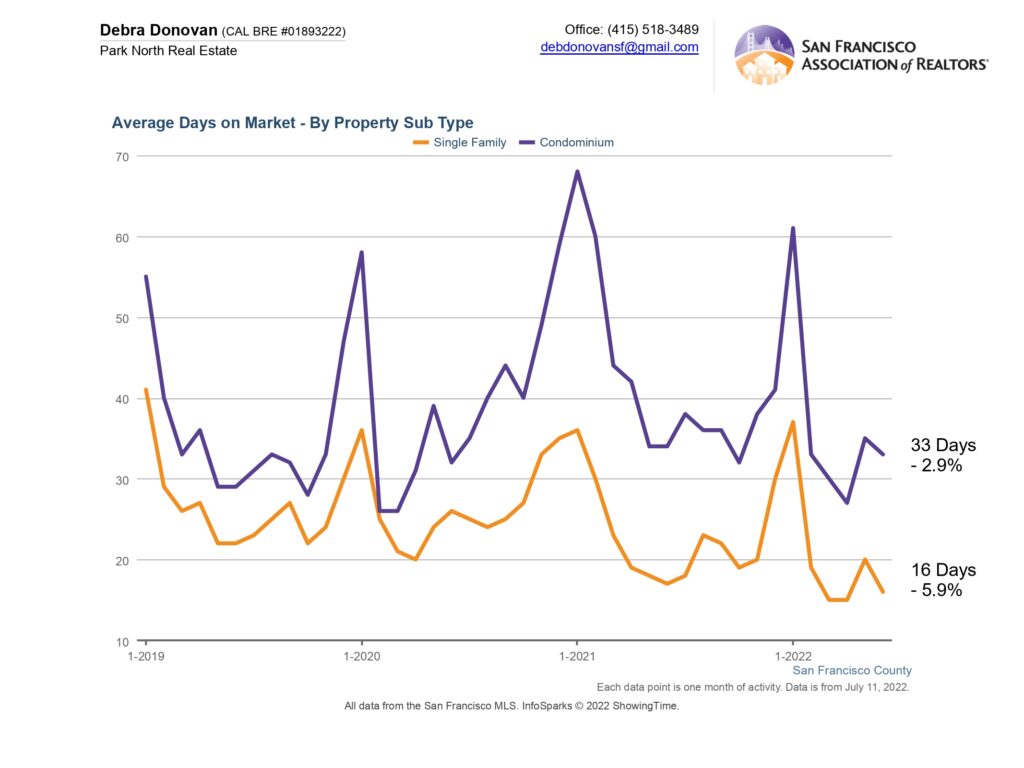
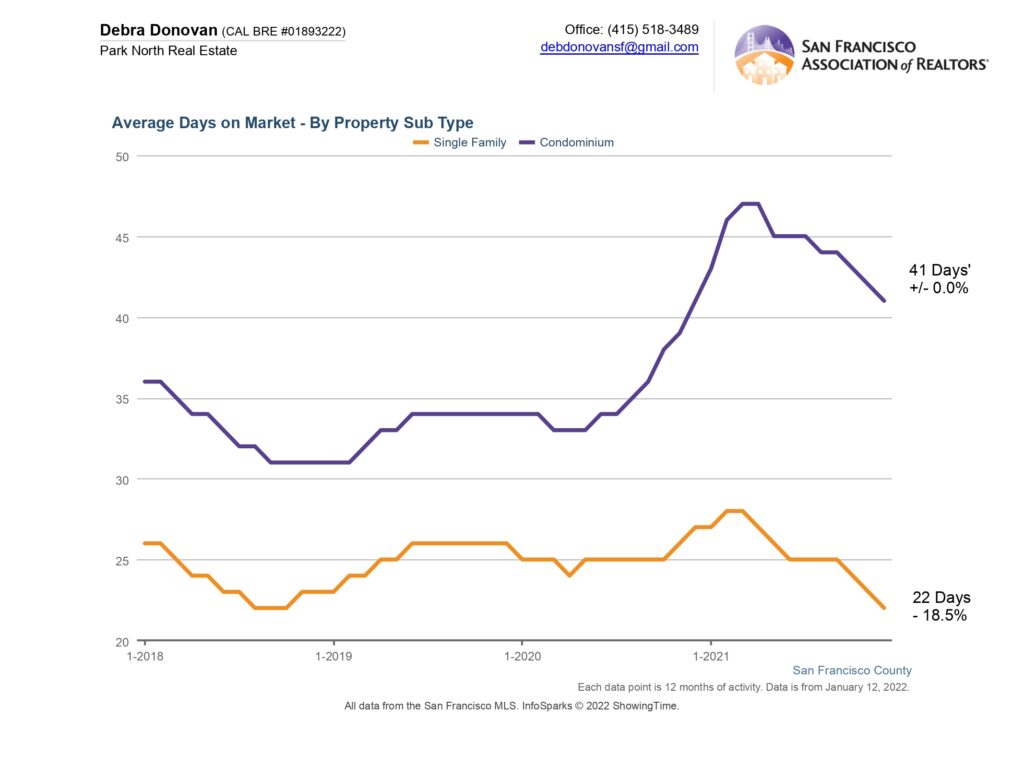
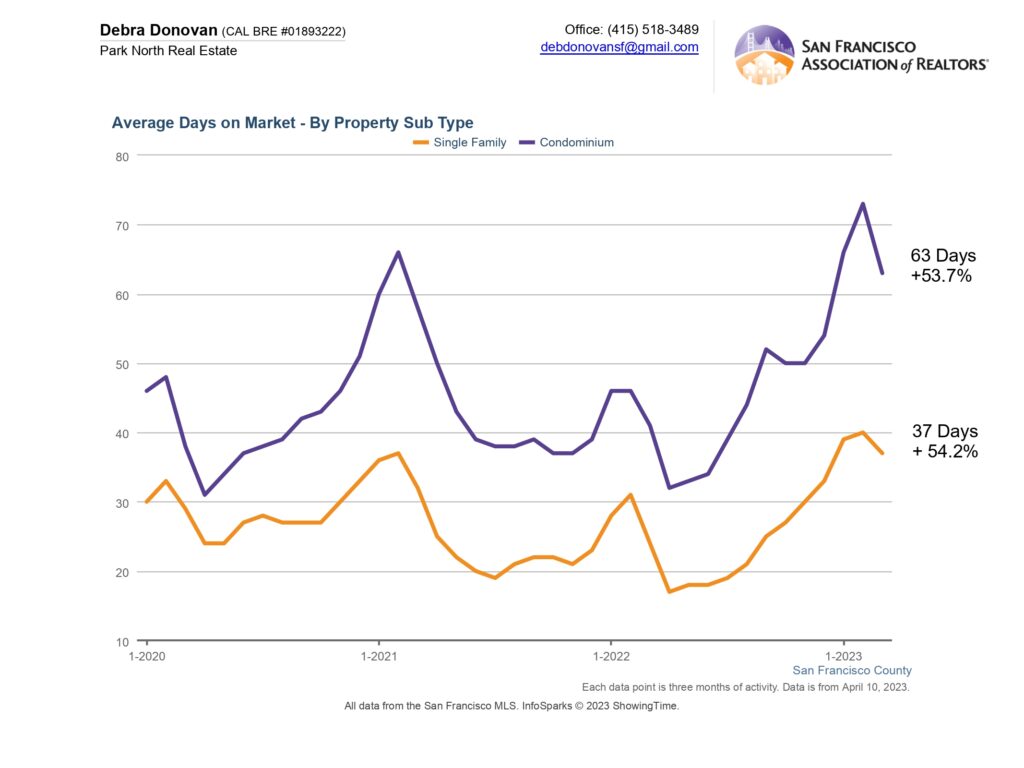
Average Days on Market:
Single family homes spent an average of 37 days on the market before accepting an offer last quarter, up over 54% compared to the same quarter last year. Condos spent an average of 63 days on the market, also up about 54% compared to Q1 2022.
The fine print: All information deemed reliable but not guaranteed or warranted. Data comes from the MLS so does not include off-market and most new construction condo sales. The Bay Area real estate market is dynamic so statistics can change on a daily basis. These statistics are meant to be a snapshot of the day and time they were pulled.