I have been woefully remiss in reaching out to you all for a while, but I hope that your 2025 is all you had hoped for so far. I had planned to do another forecast of what to expect in the San Francisco real estate market in 2025 based on what I was hearing from experts. But then there was the presidential election and the firestorm of changes that ensued that has somewhat put those predictions into question. So here’s a quick update on what we are seeing in the real estate market today, as well as a few slides on how January 2025 fared compared to January 2024. As always, if you or someone you know needs assistance with real estate, I’d be honored to help them.
Interest Rates:
Last year most experts were saying that given the improvements they were seeing in inflation, the Fed would continue to gradually reduce interest rates and mortgage rates would likely be in the +/- 6% range, by year end.
Now, however, lenders are saying that there we may see no rate cuts from the Fed in 2025. This is in part due to threats of tariff wars, which will likely increase prices over time and therefore impact inflation. Last week’s indications that inflation is still not under control may also create more reticence to cut rates too quickly. In the meantime, expect rates to remain in the +/- 7% range for the foreseeable future.
Buyer and Seller Activity:
Despite the slow end of 2024, buyers were back in full swing by the end of January. There seemed to be a lot of pent-up demand that we didn’t see over the second half of last year, which was largely due to interest rates and uncertainty surrounding the presidential election. Now many properties are experiencing increased buyer interest and in many cases, multiple offers. Buyers are becoming more accustomed to the higher interest rates, and particularly in tech-and-finance-focused San Francisco, the stock market has been mostly up this year. For example, I have hosted two open houses where over 100 parties came to see the property. Needless to say, the property sold for a great deal more than the asking price.
In the meantime, sellers remain on the sidelines, thus increasing demand for the homes that are on the market and driving prices up more.
January, 2025 Sales Data:
A note of clarification. The typical escrow period will last anywhere from 21 to 30 days or longer. Therefore, statistics you are seeing for January are primarily for properties that went into contract in December, which is typically when inventory and buyers are low and the high end especially pulls their properties off the market.
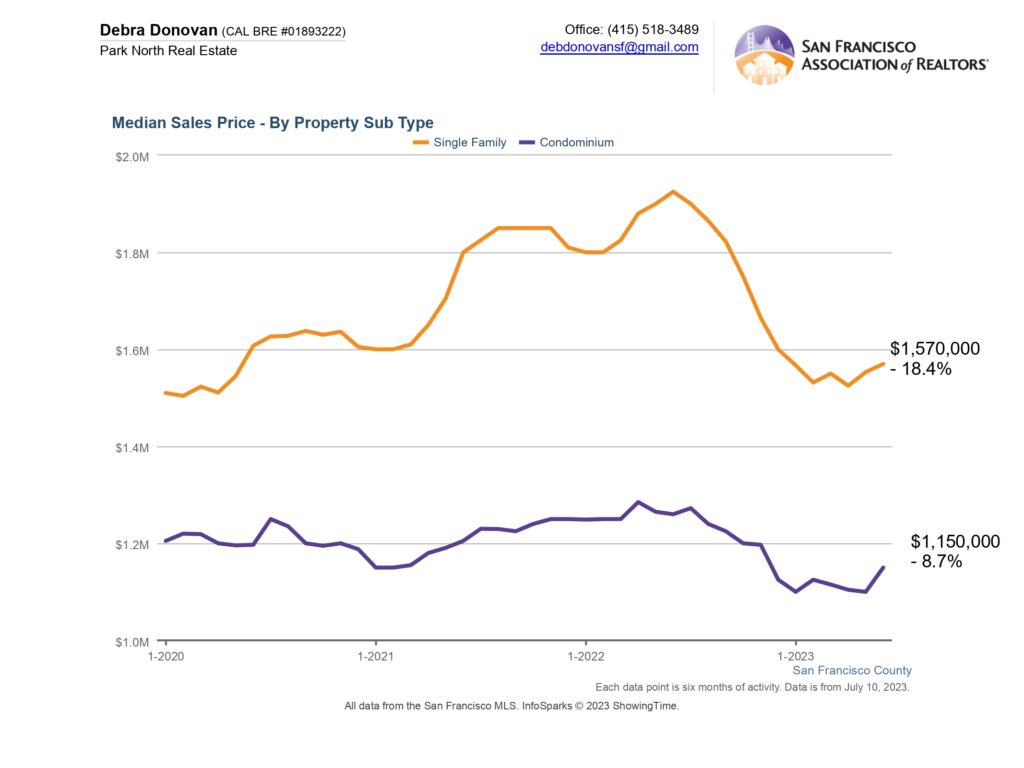
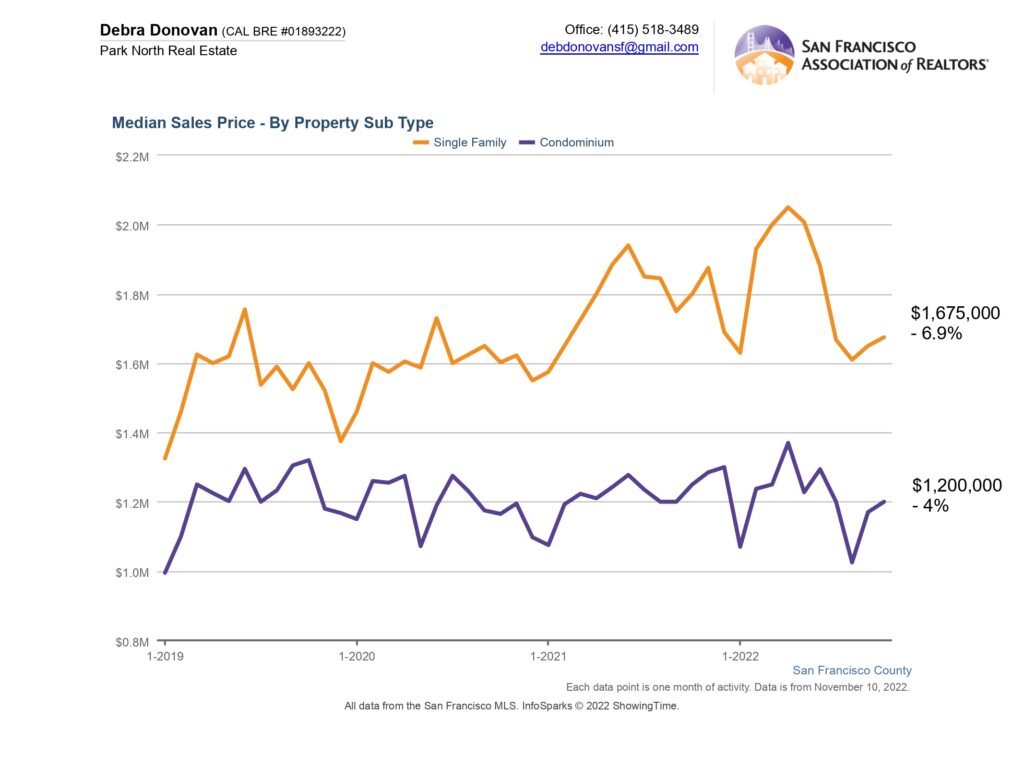
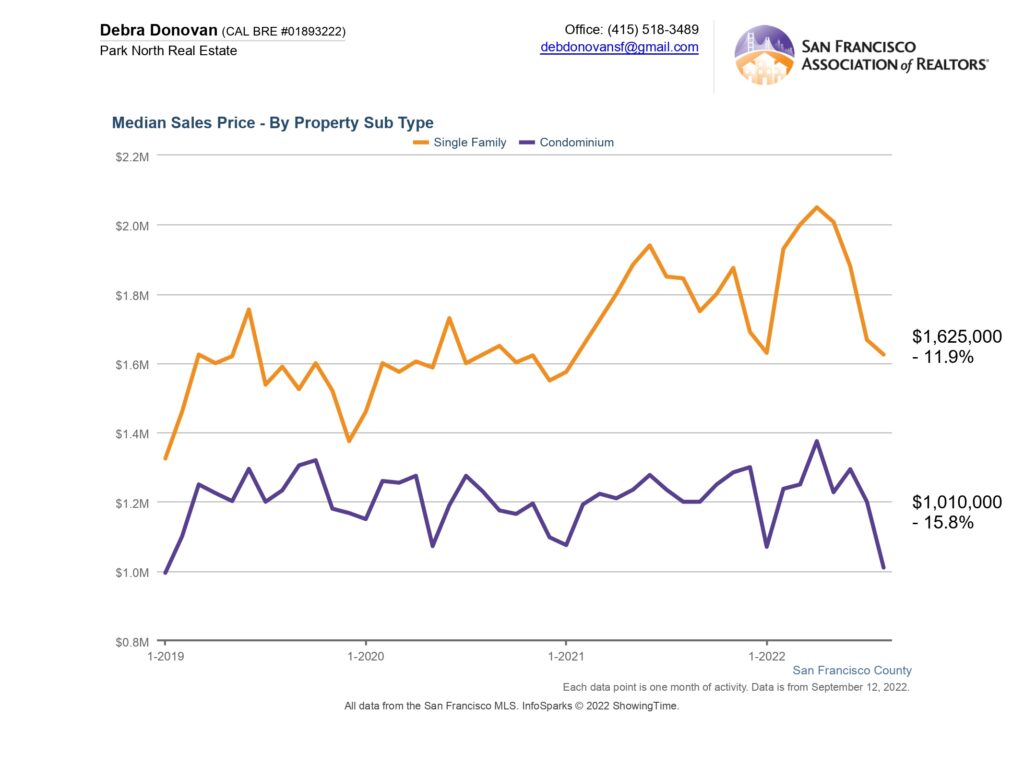
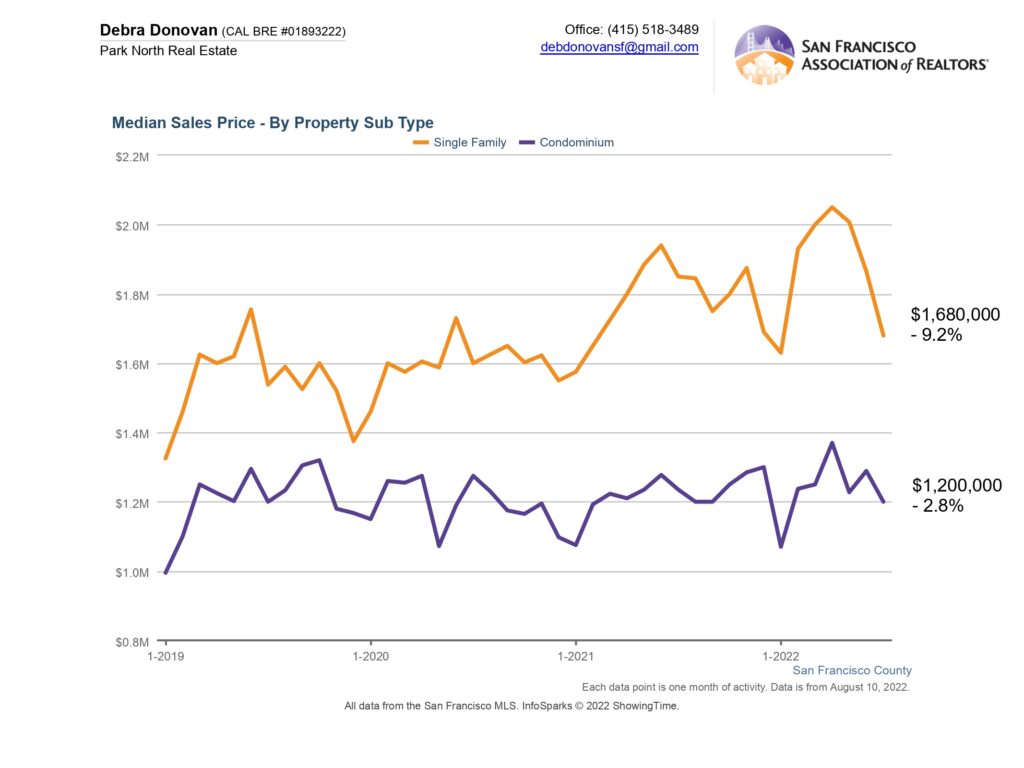
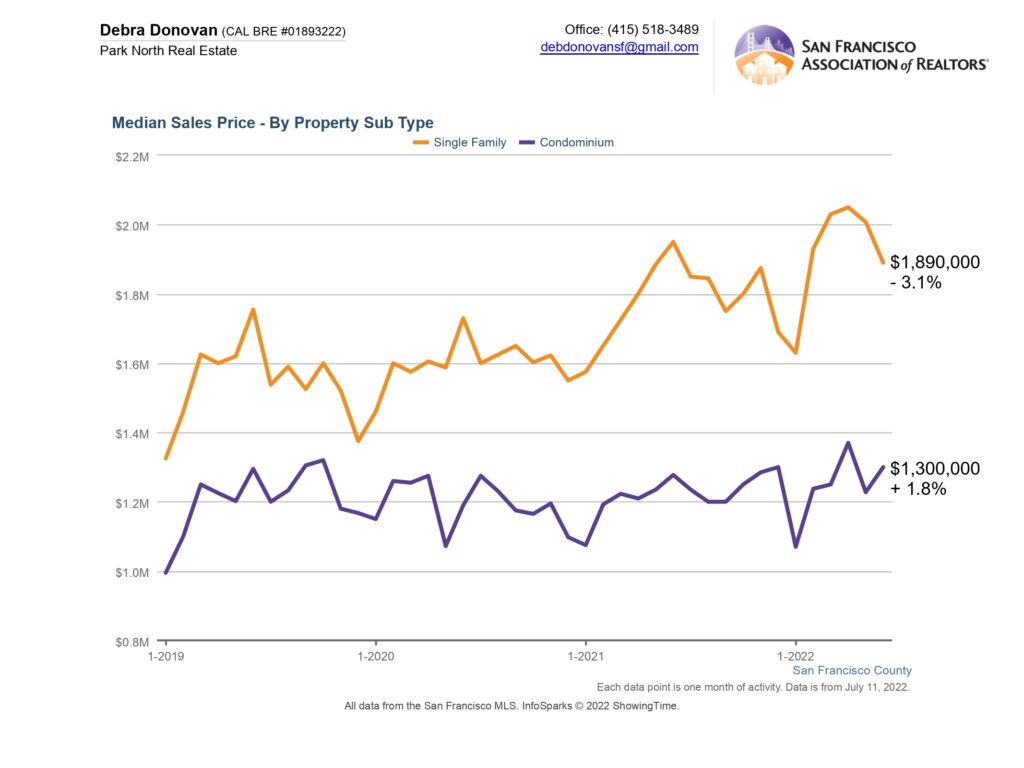
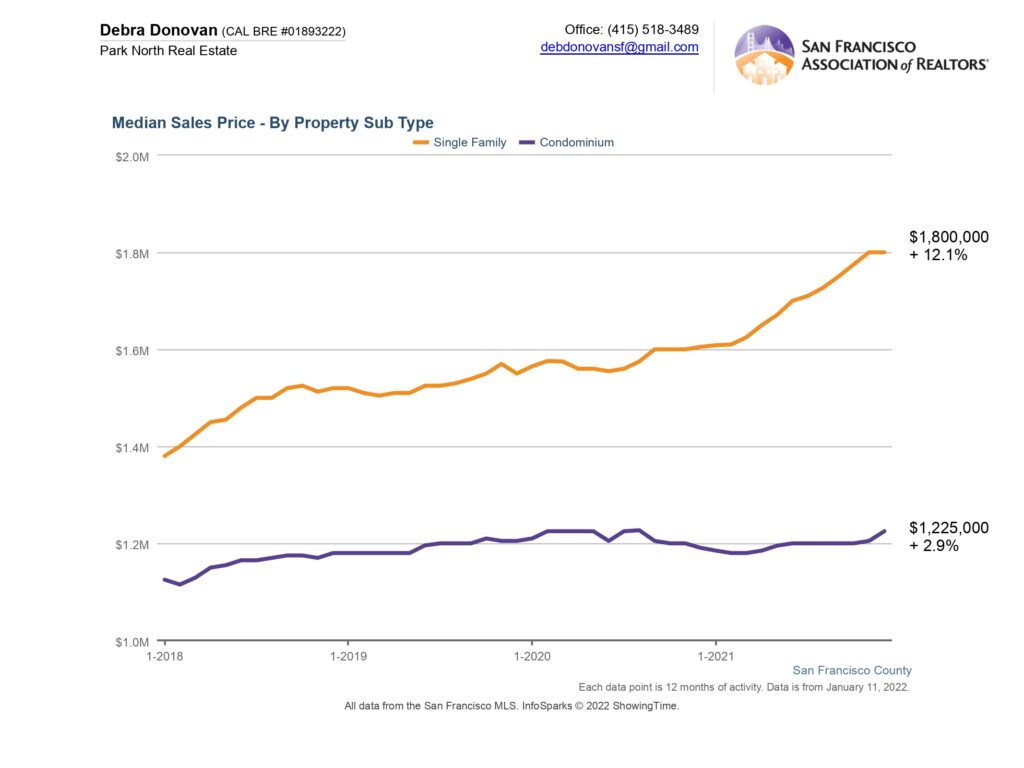
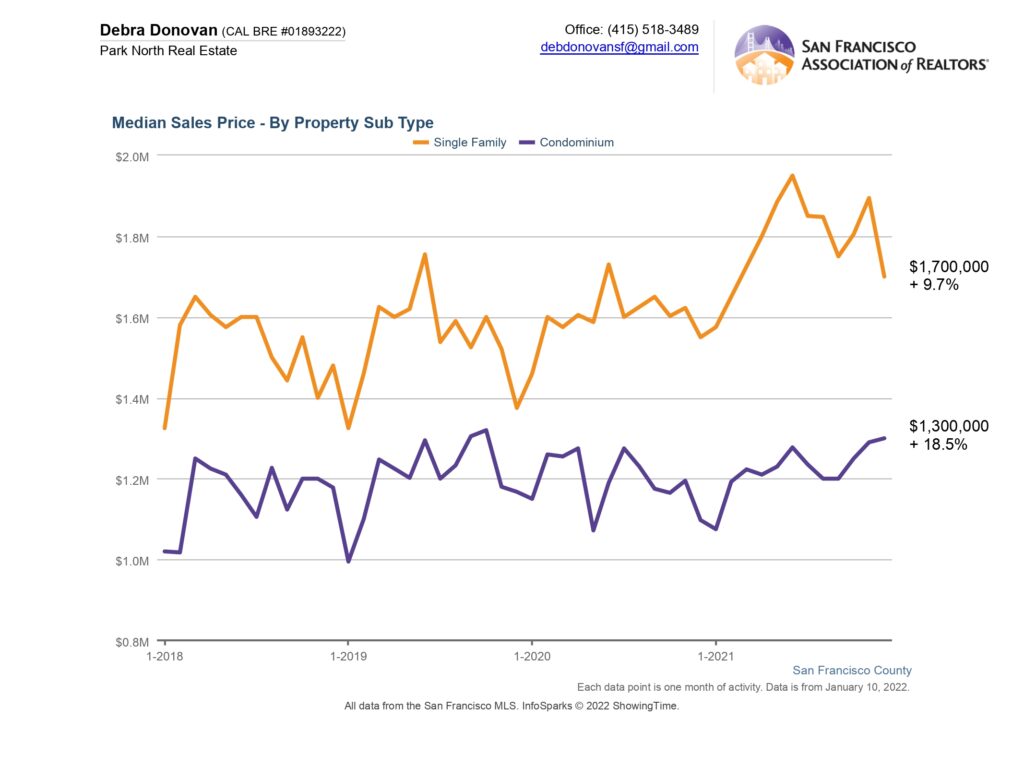
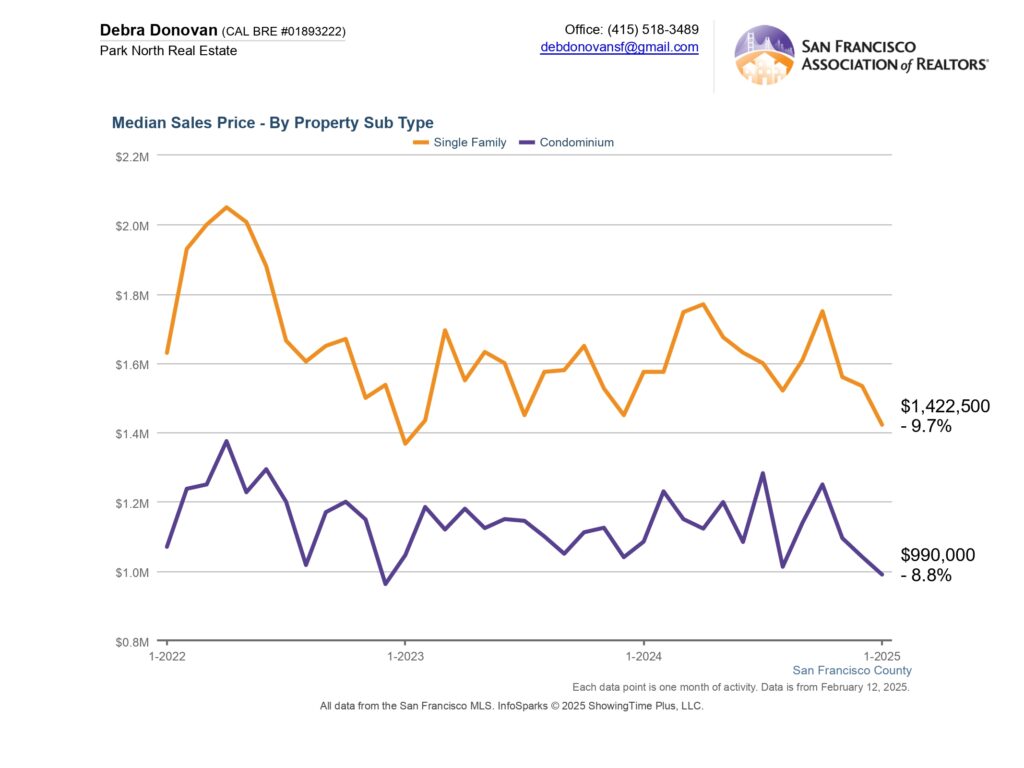
Median Sales Price:
Single family homes sold for a median of $1,422,500 in January, down almost 10% compared to last January. Condos, too, were down almost 9%, selling at a median price of $990,000.
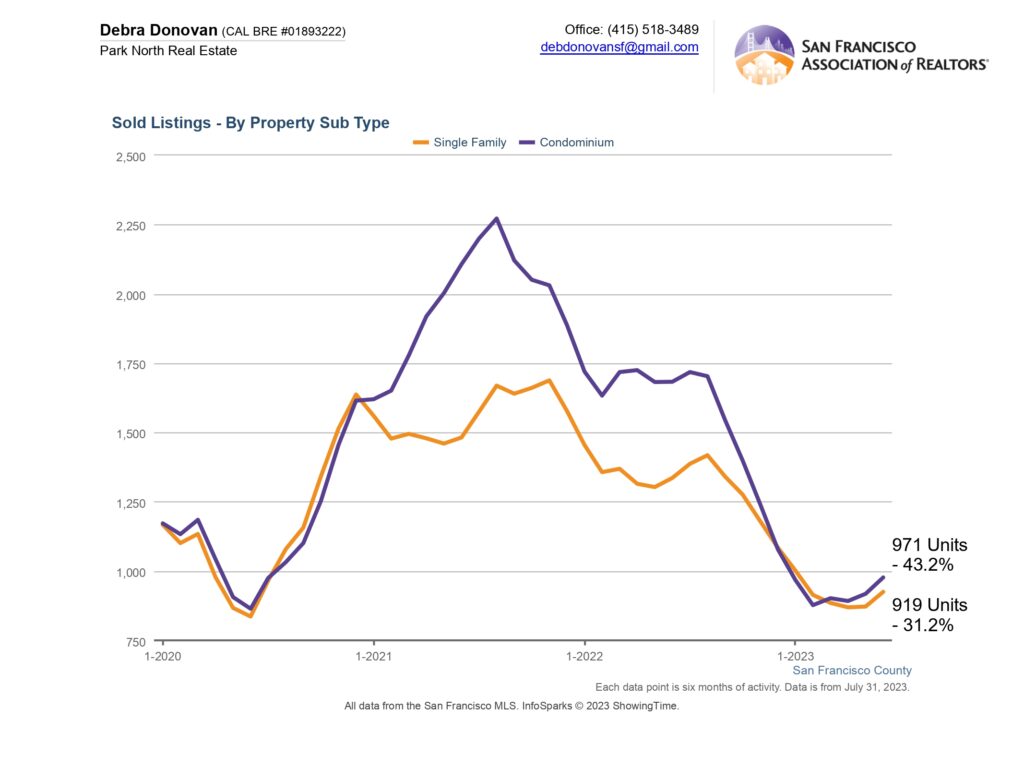
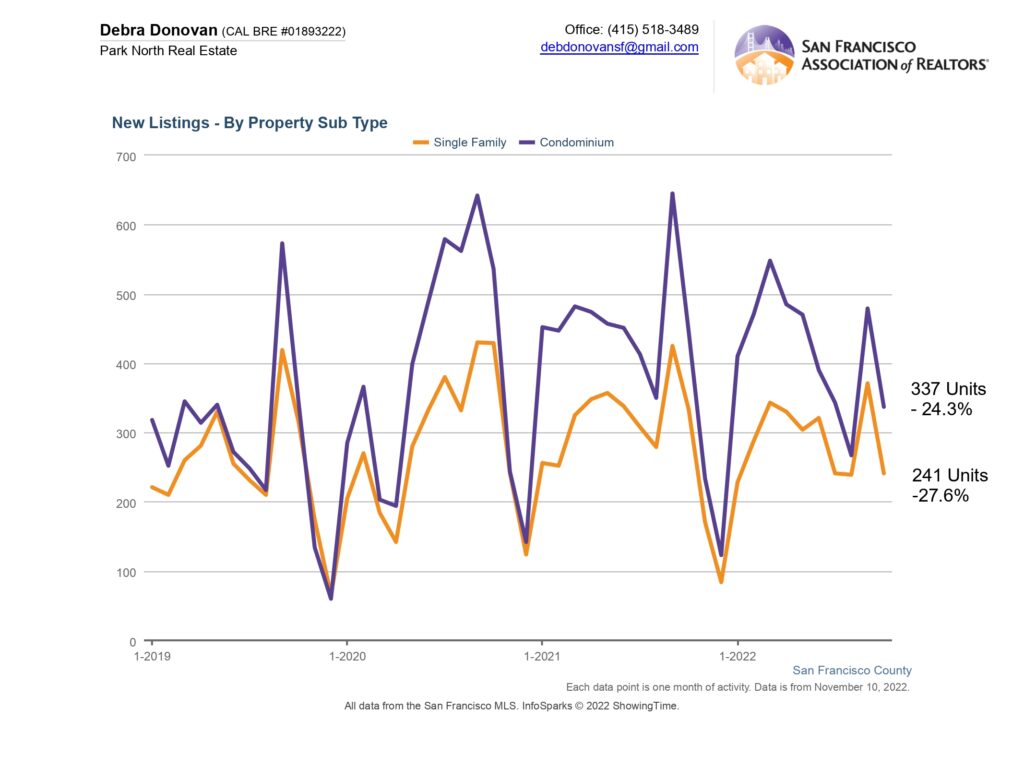
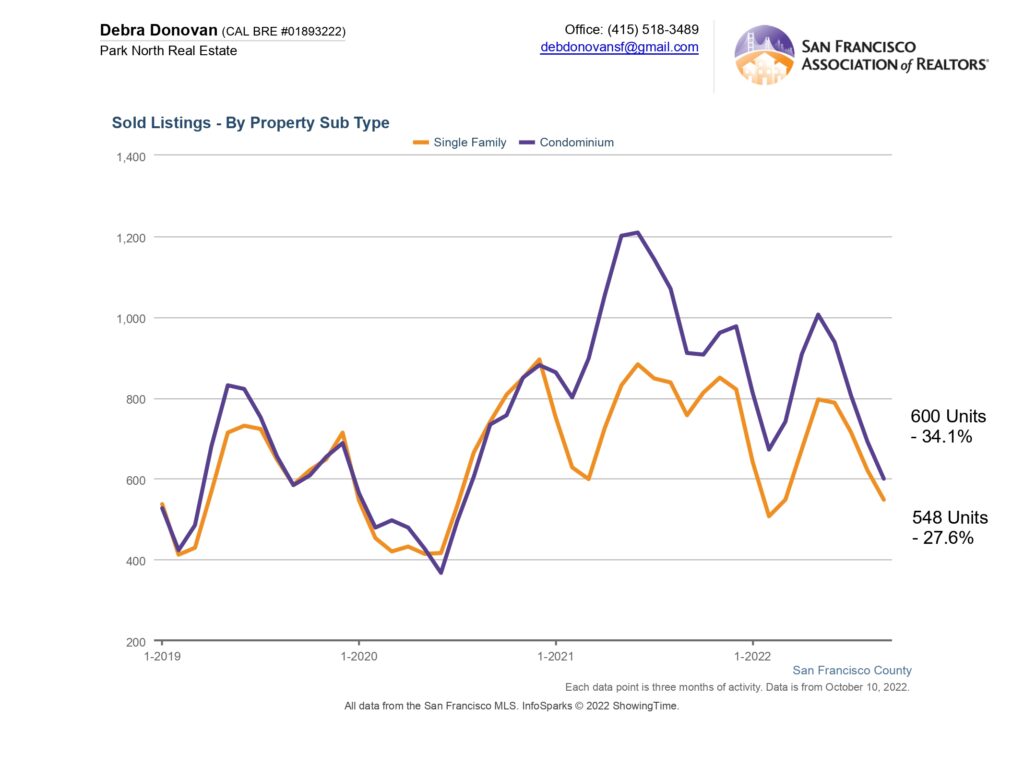
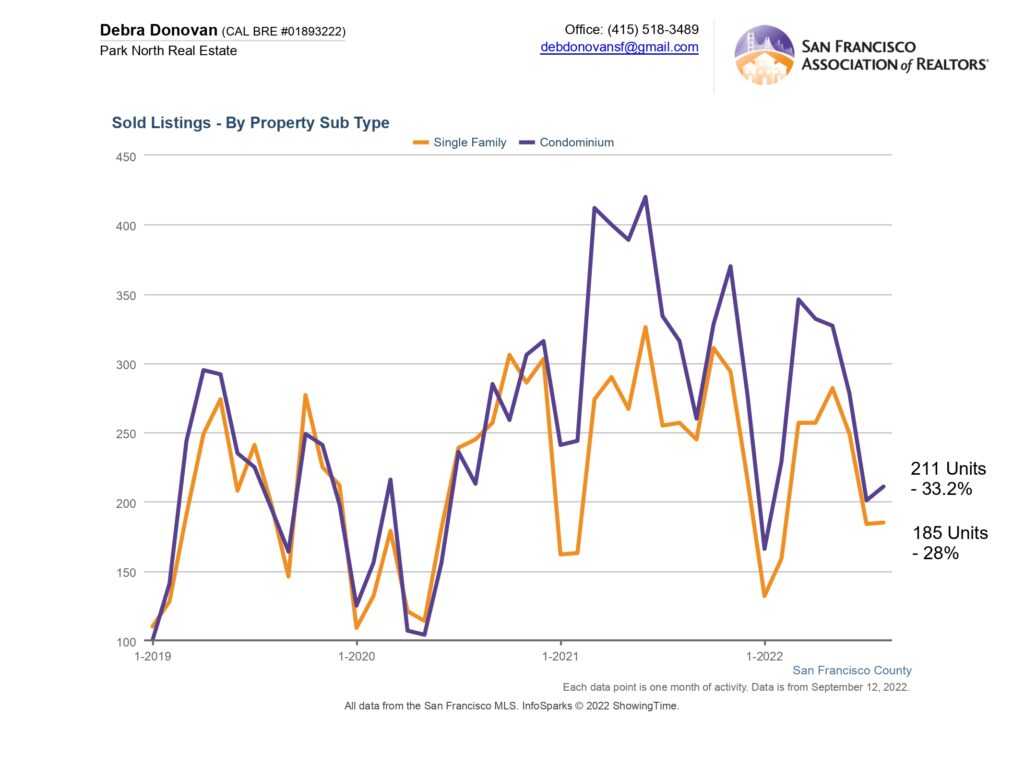
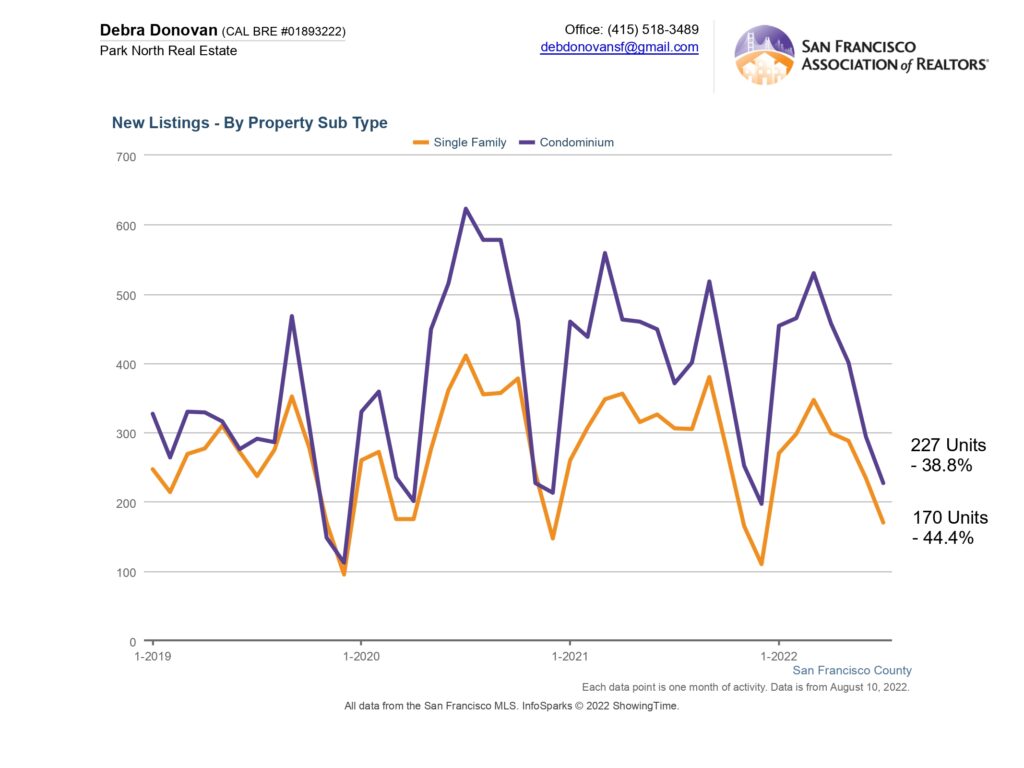
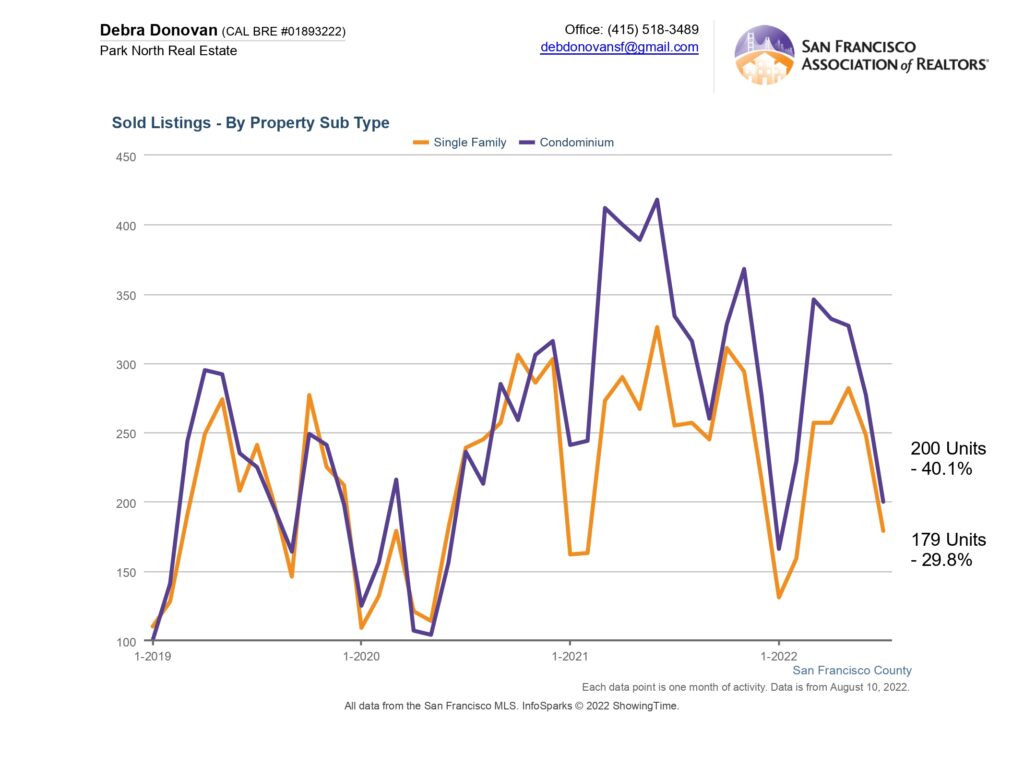
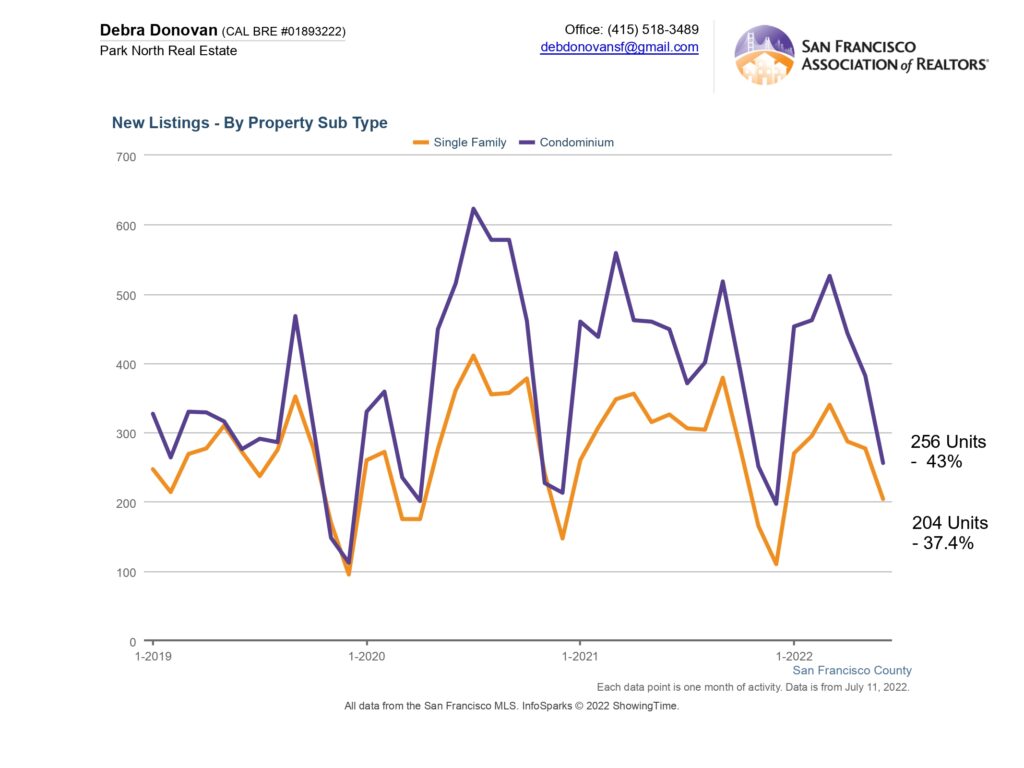
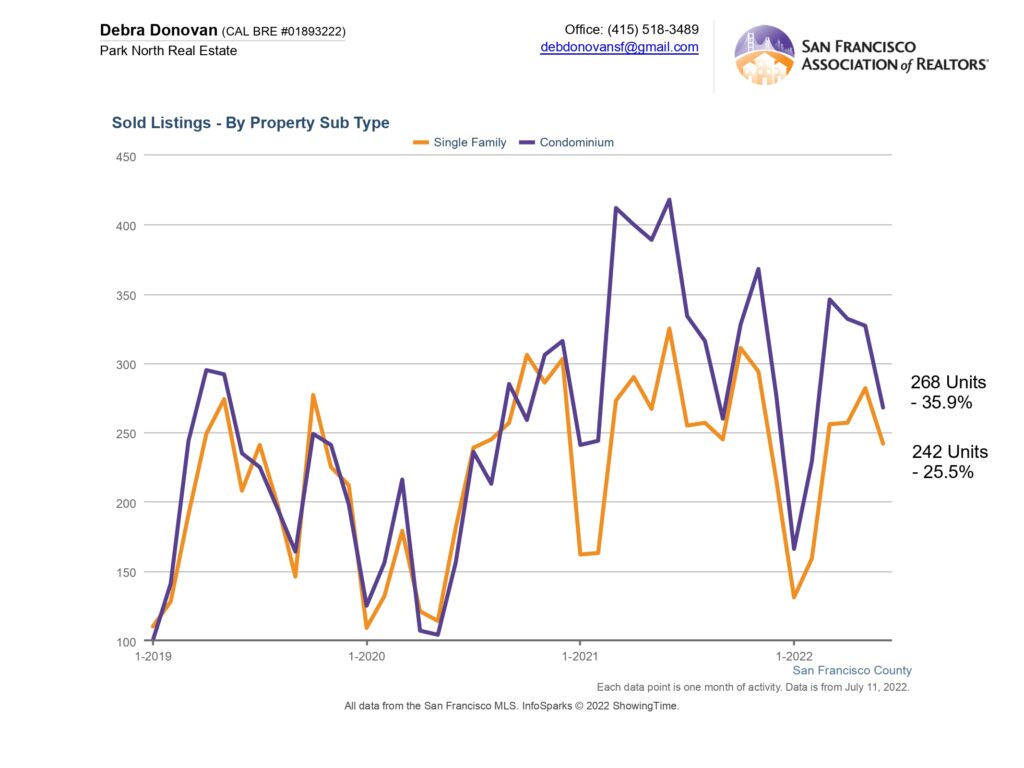
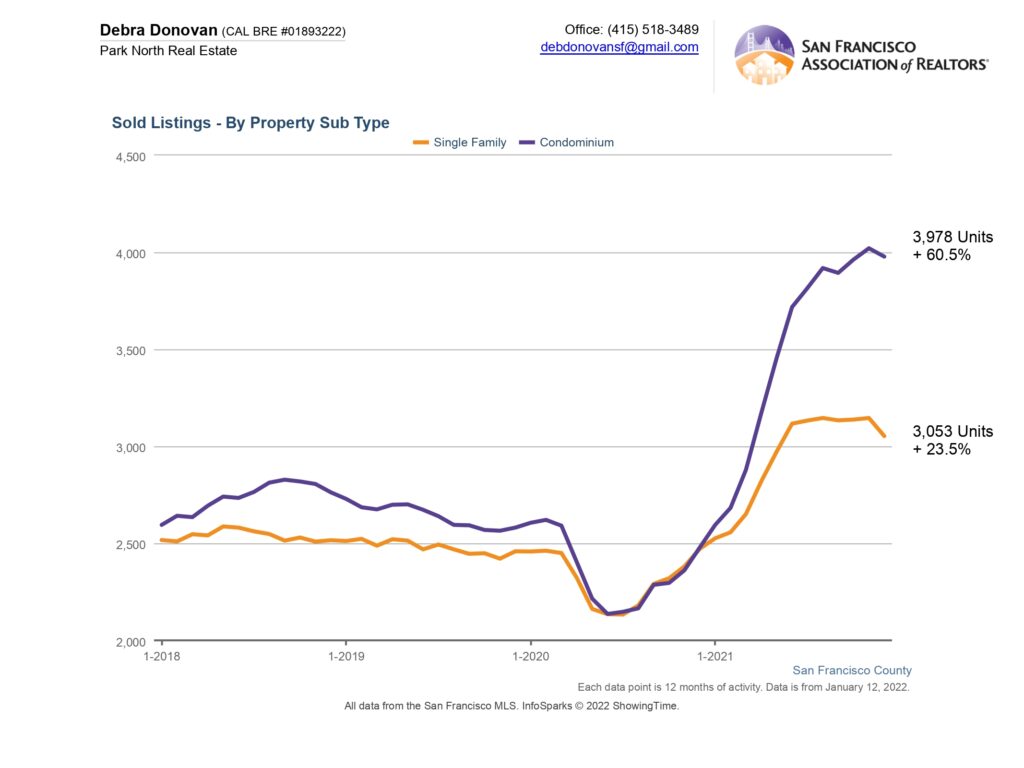
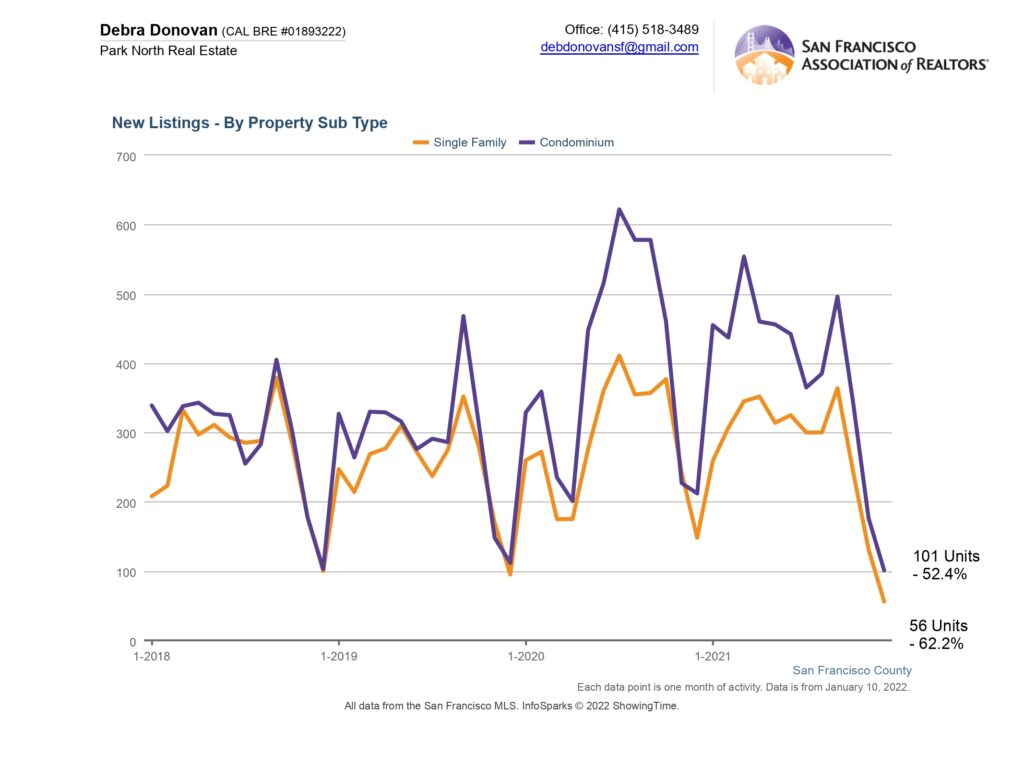
Sold Listings:
In January 2025, 122 single family homes sold in San Francisco, up 34% compared to last January. There were 114 condos that sold, also up about 19%. while January was mostly a soft month for sales, it still outpaced the same period last year.

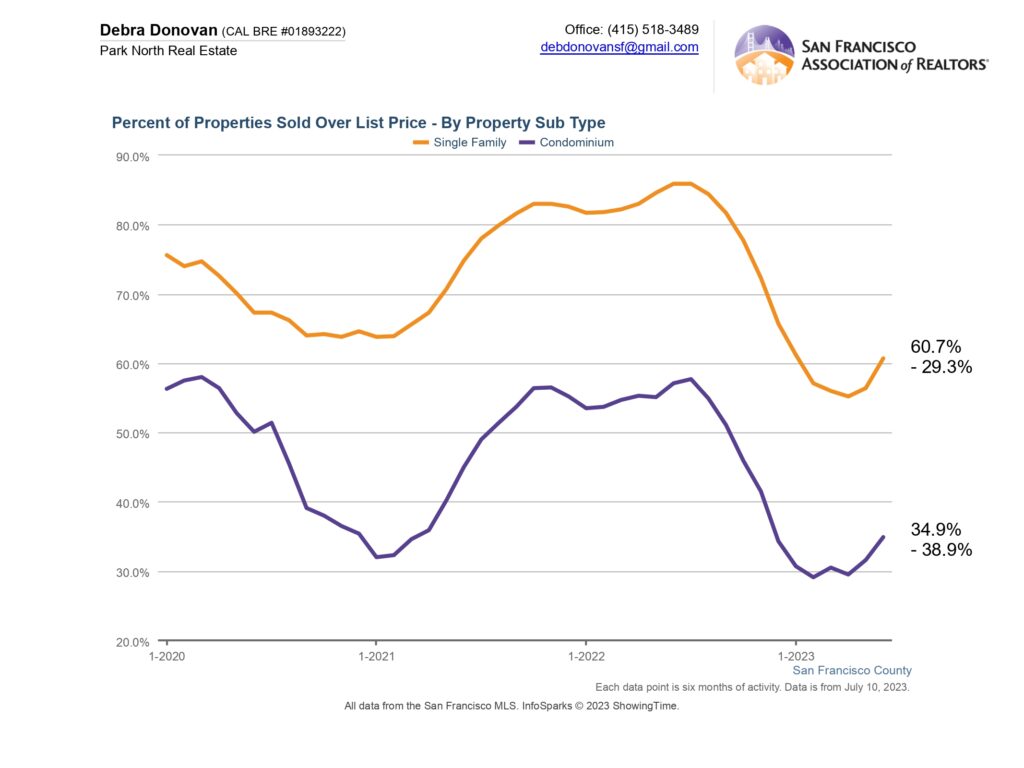
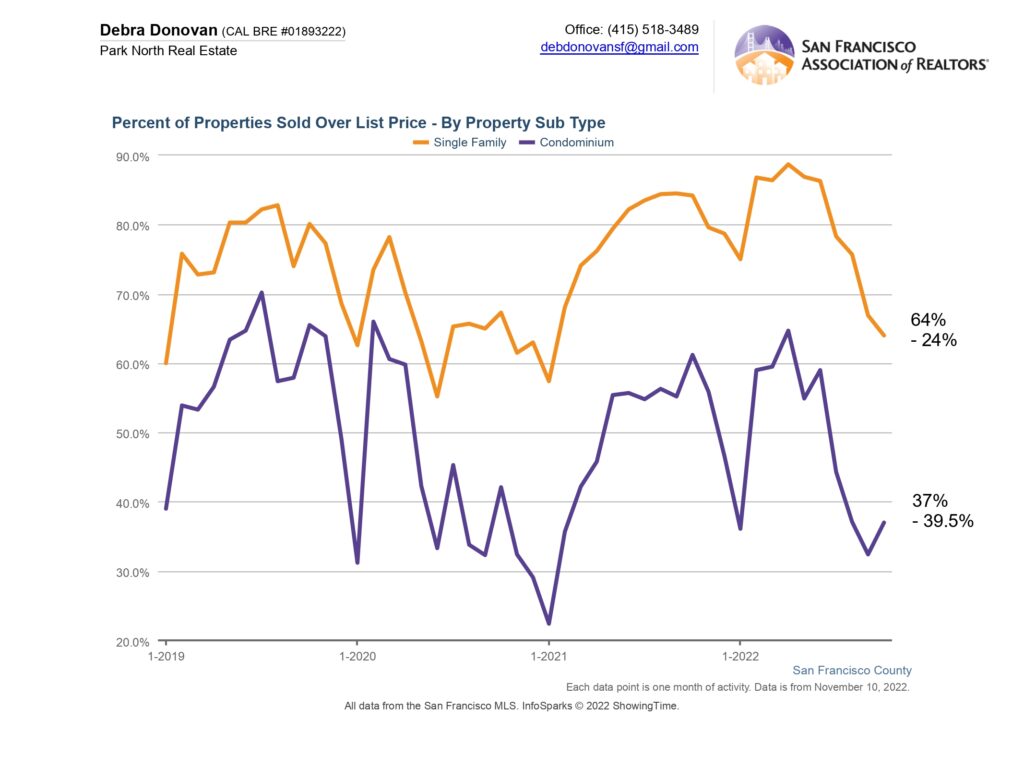
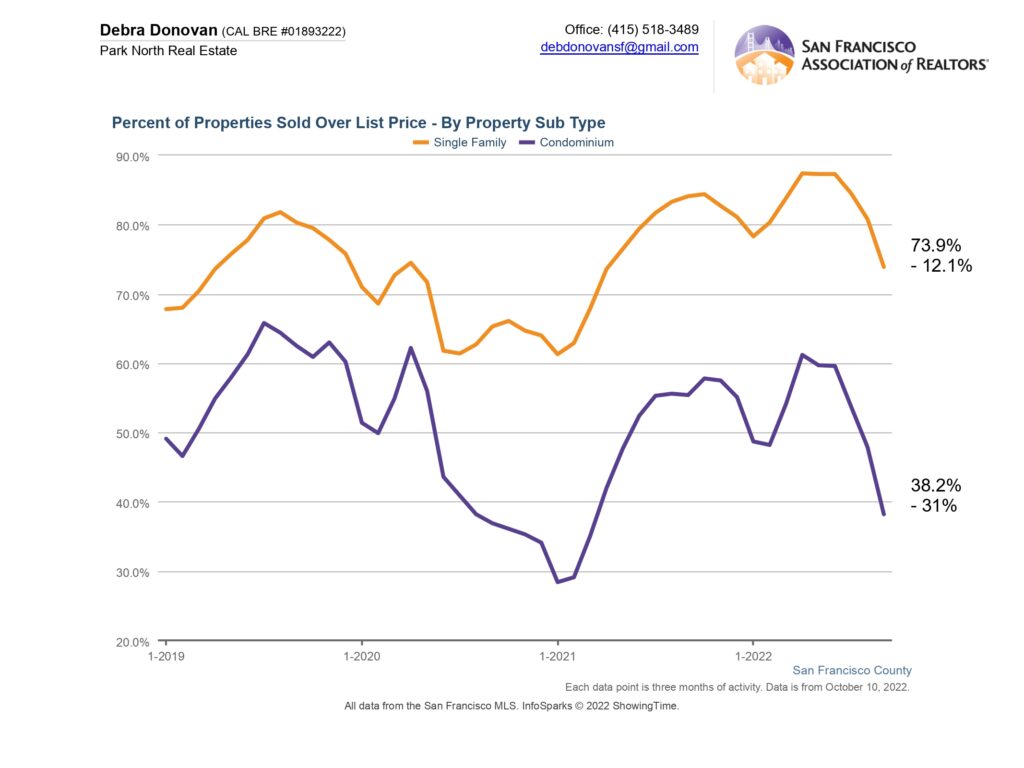
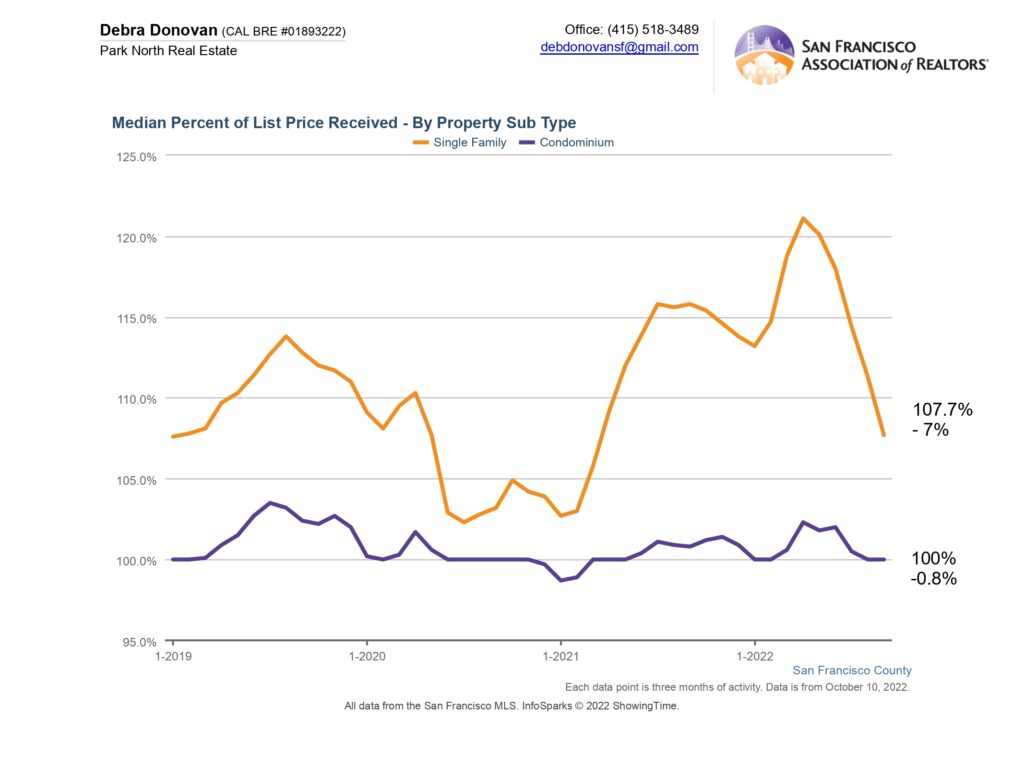
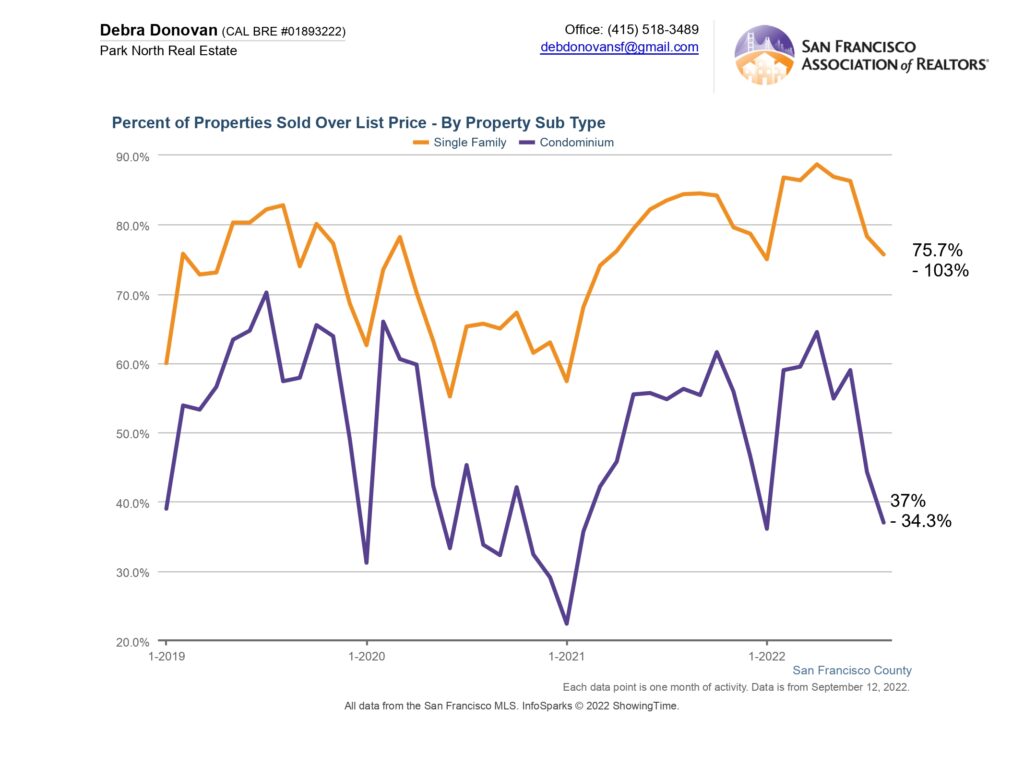
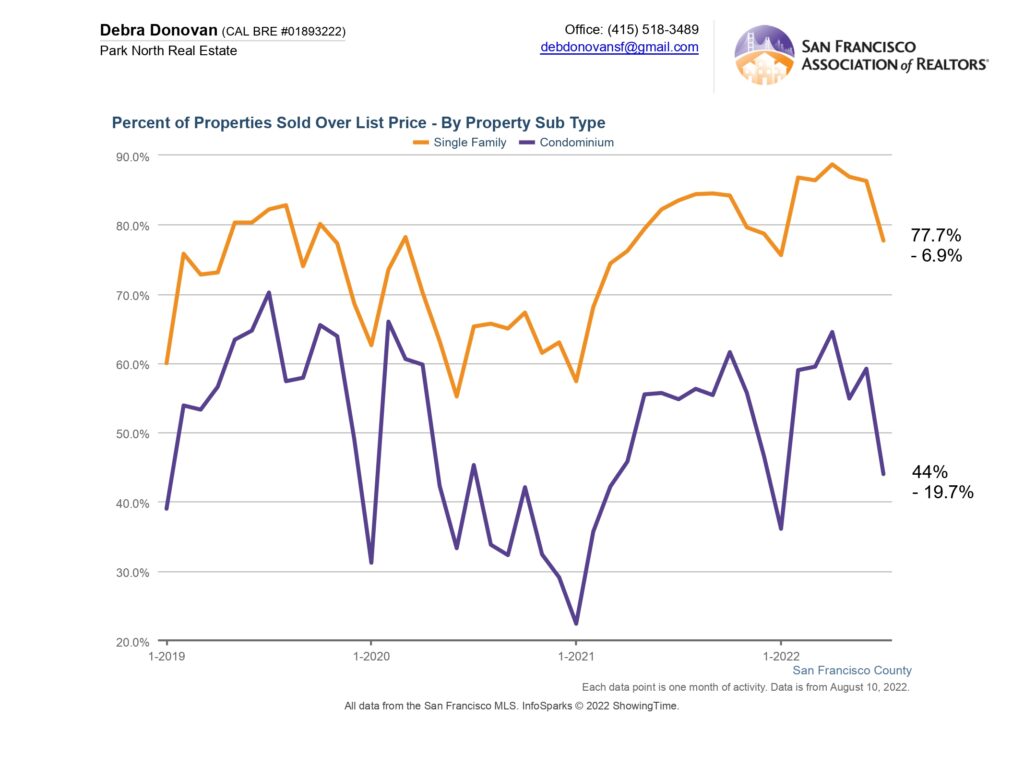
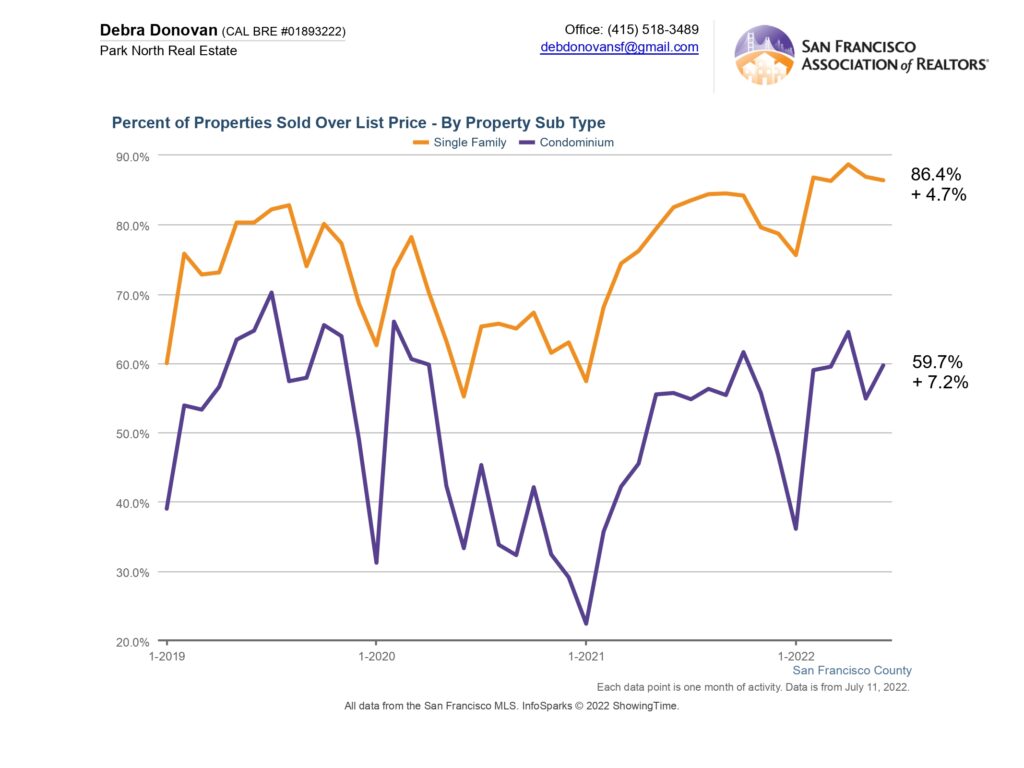
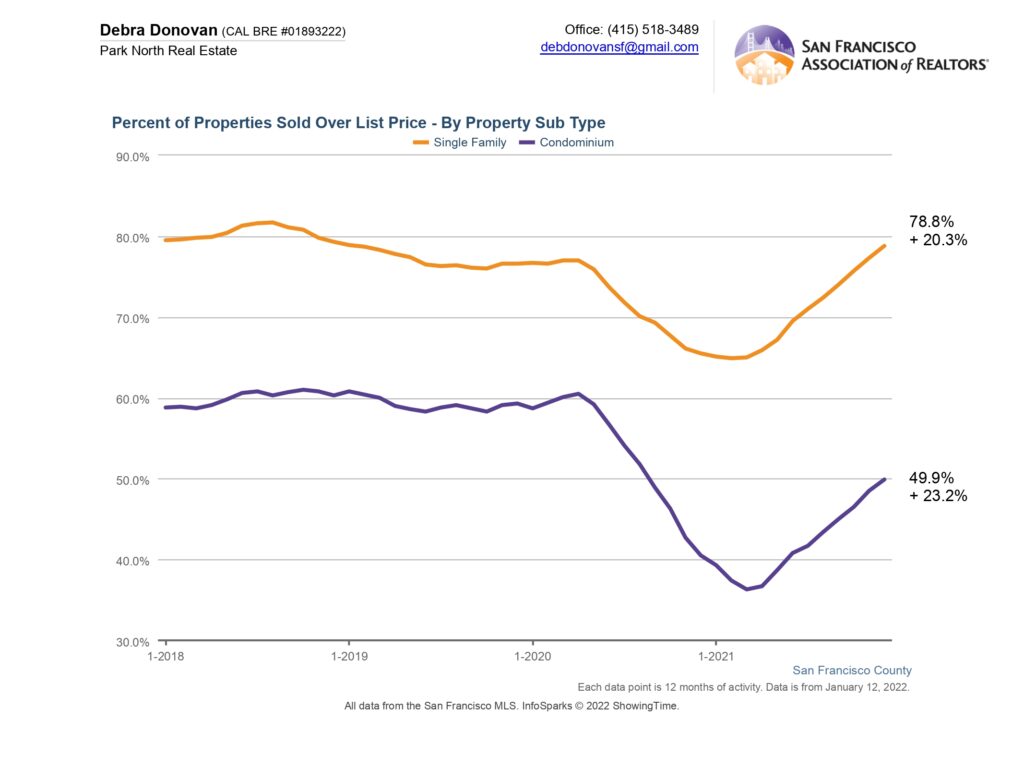
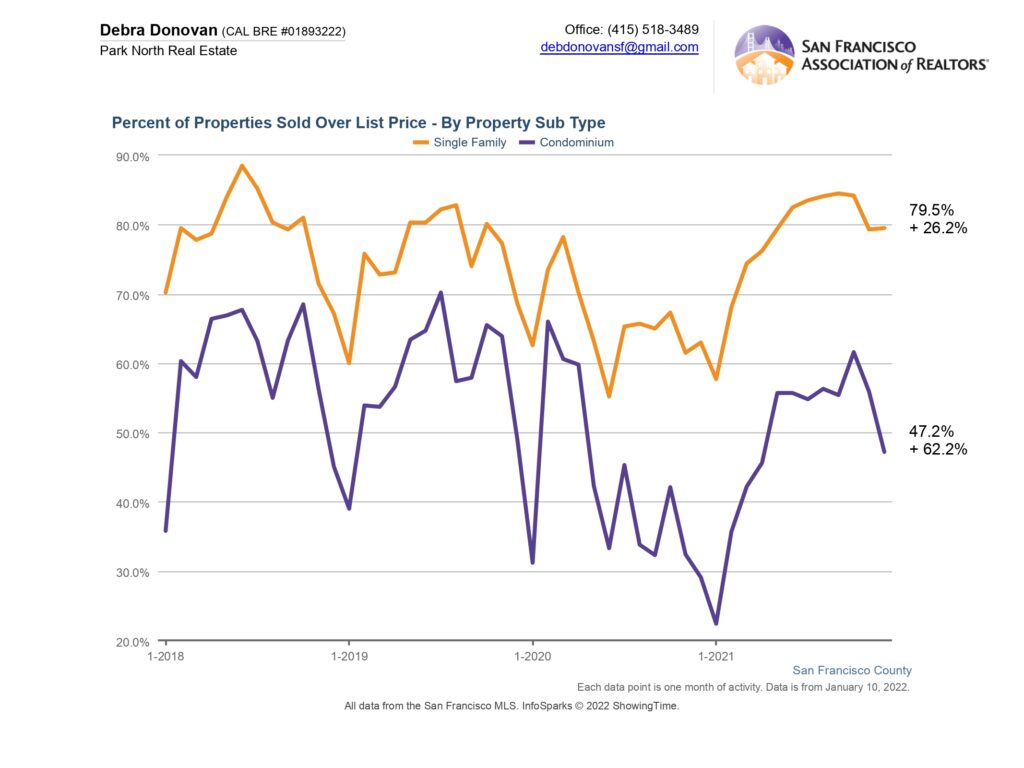
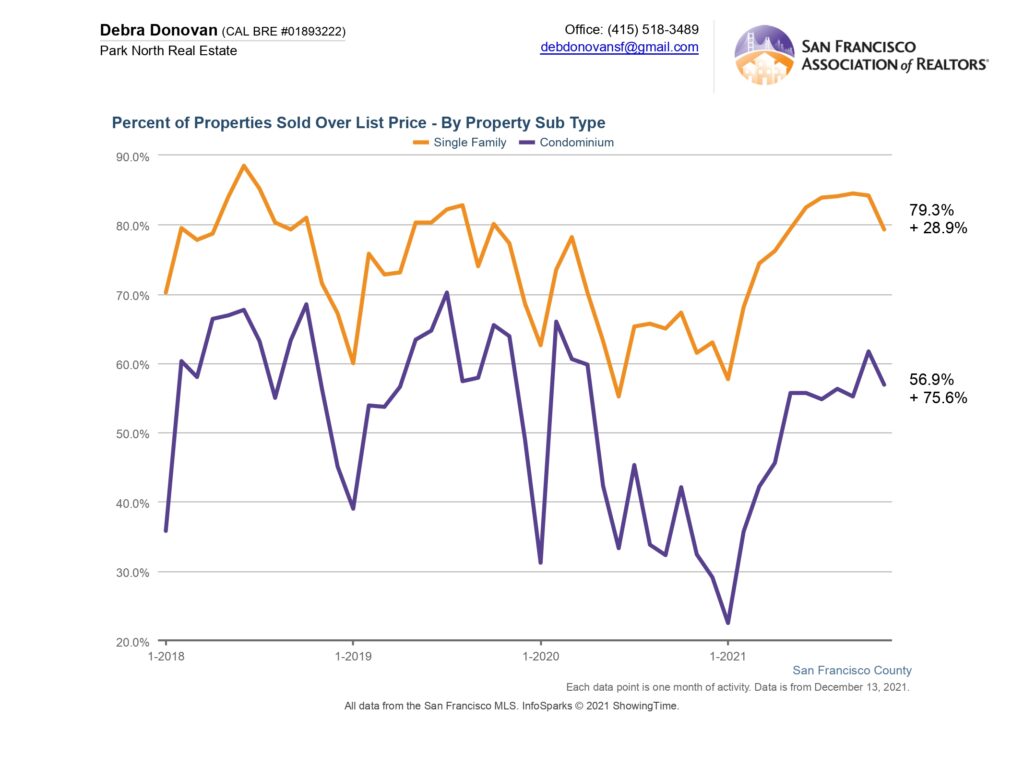
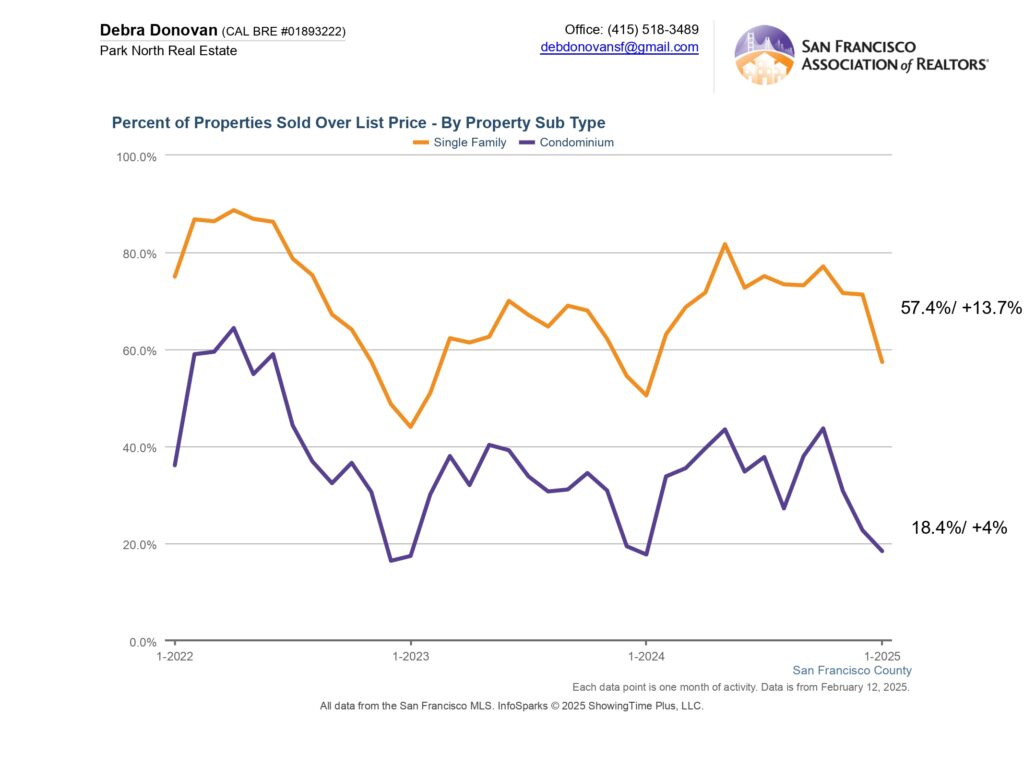
Percentage of Properties Selling Over List Price:
Fifty seven percent of single family homes sold for over their list price in January, which is up almost 14% when compared to last January. Only 18% of condos sold for over their list price, up 4% compared to the same time last year.
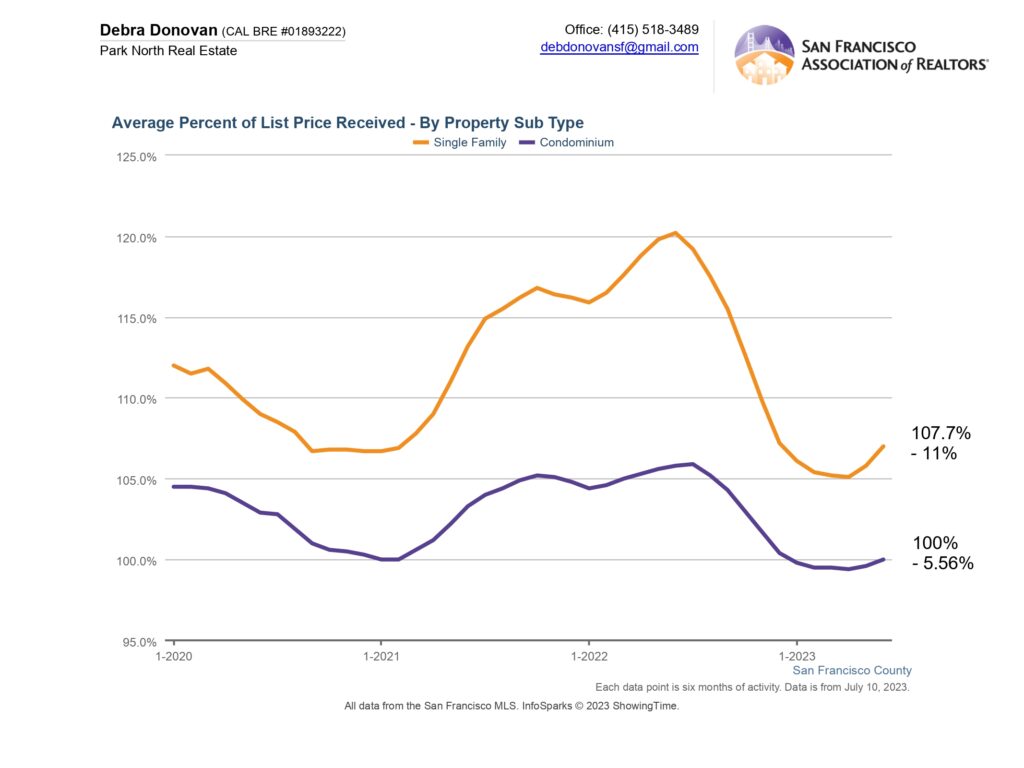
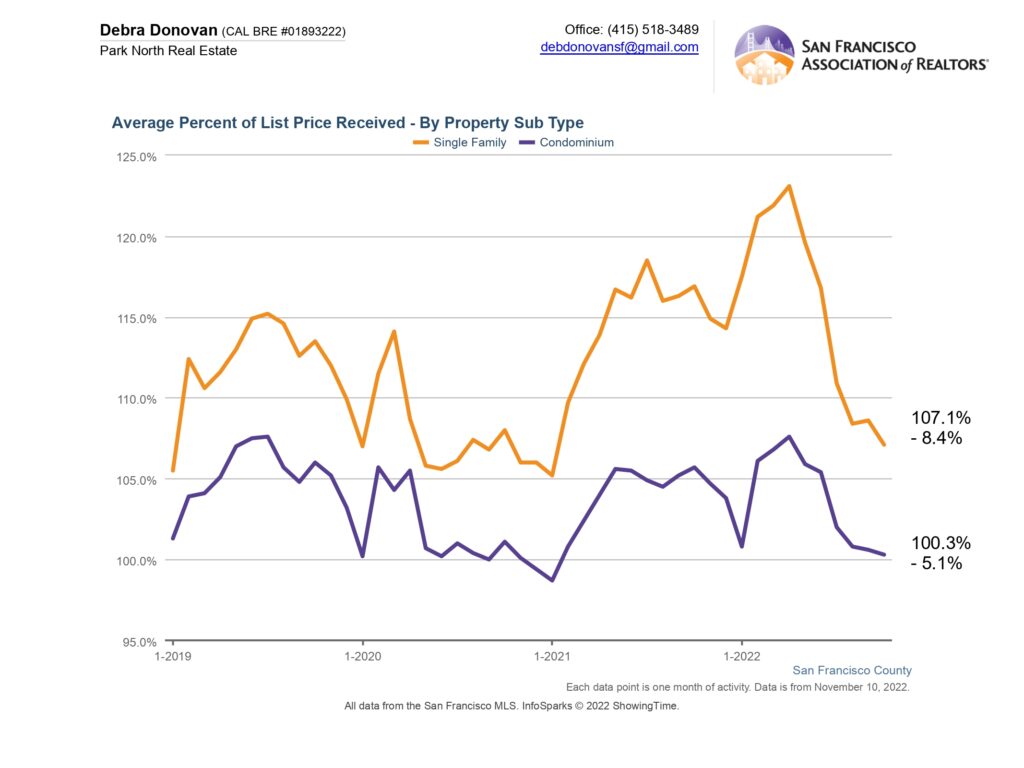
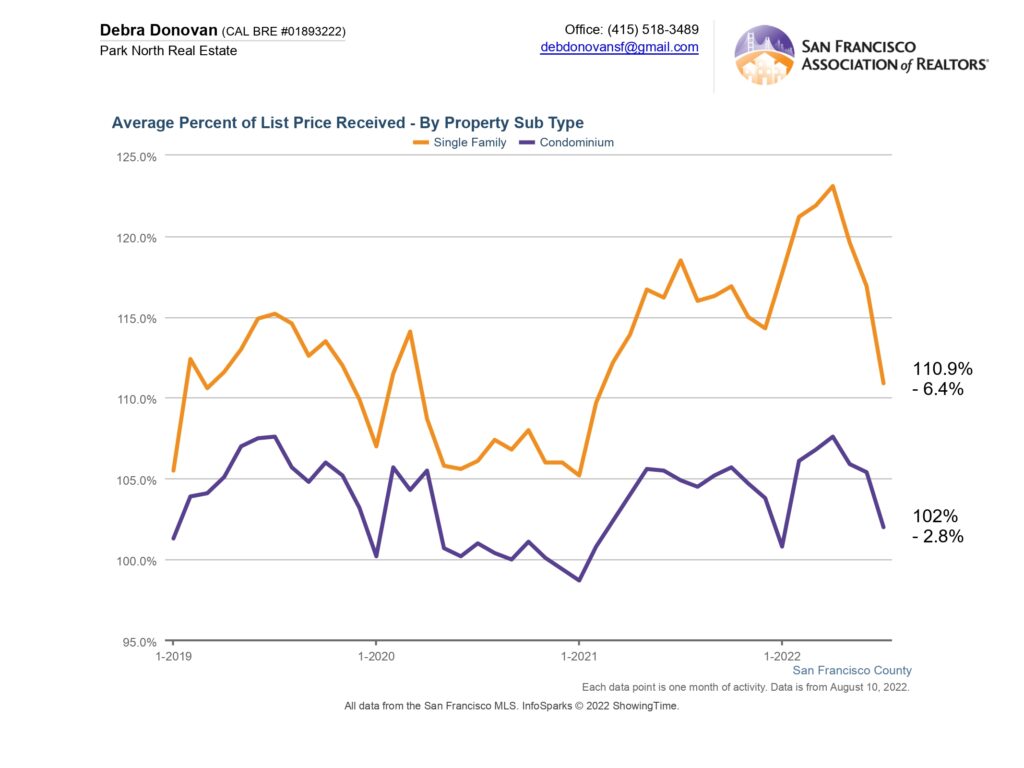
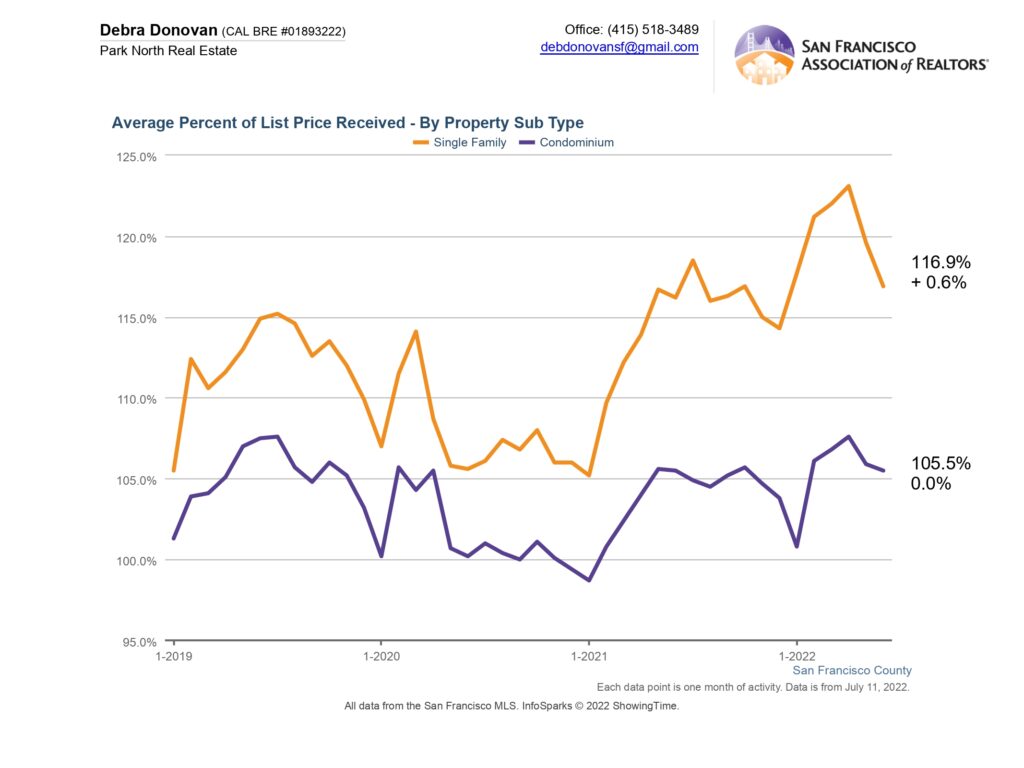
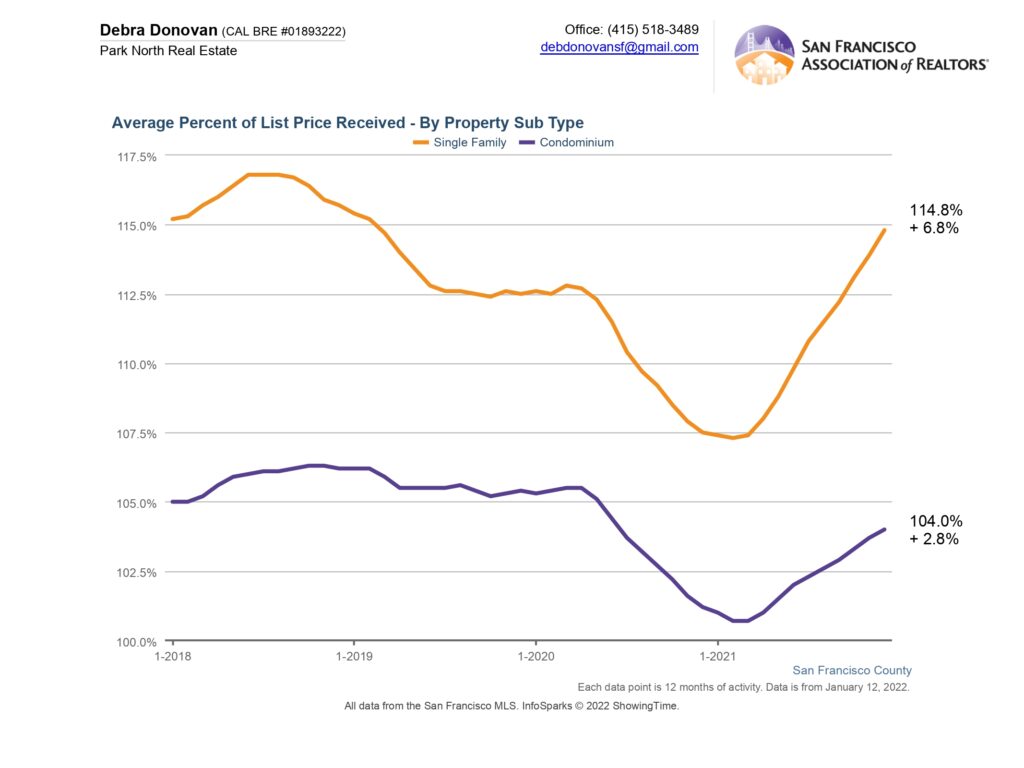
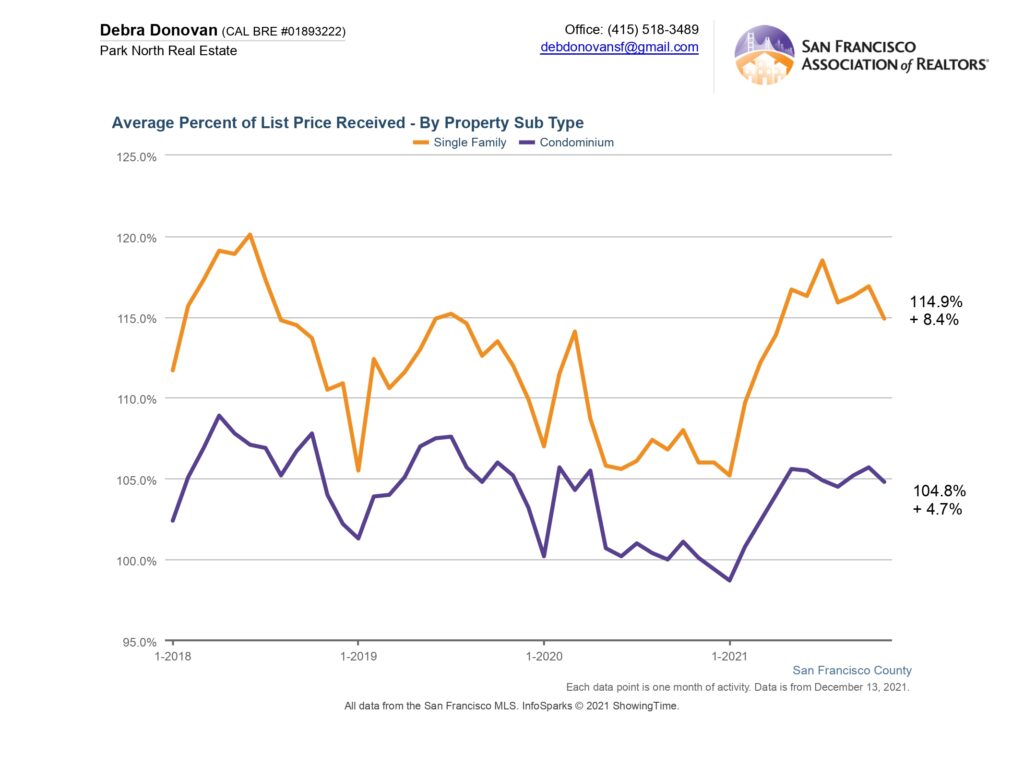
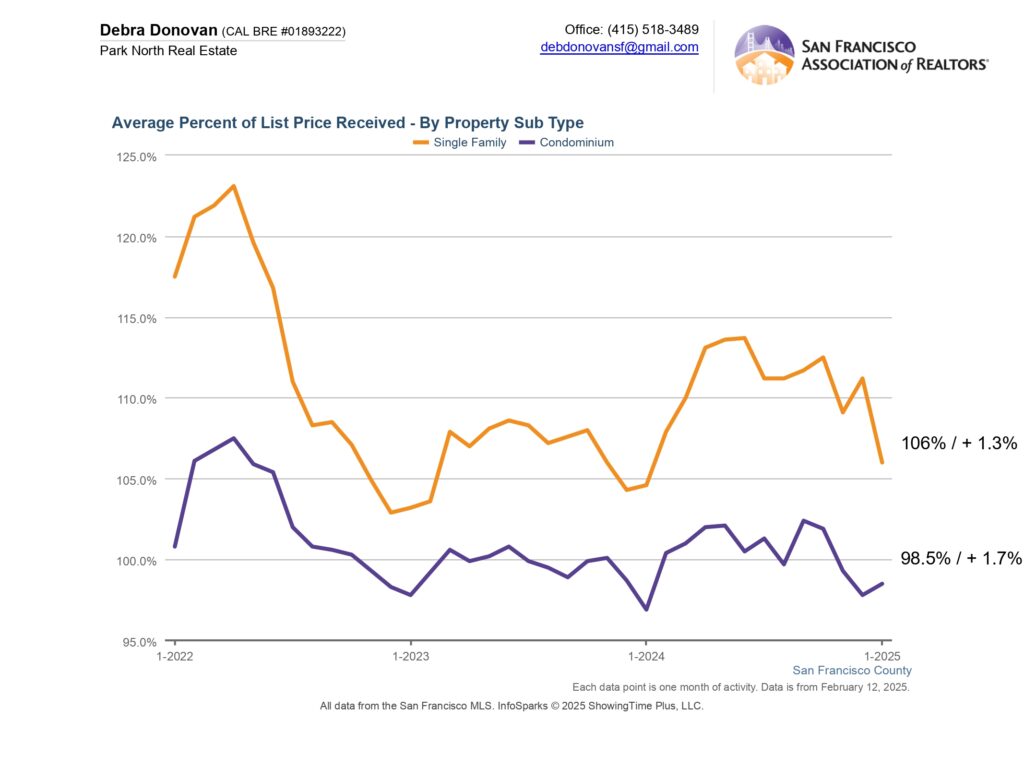
Average Percentage of List Price Received:
On average, single family homes received 106% of their asking price, up 1.3% compared to last January. Condos sold for an average of 98.5% of their asking price, up 1.7%.
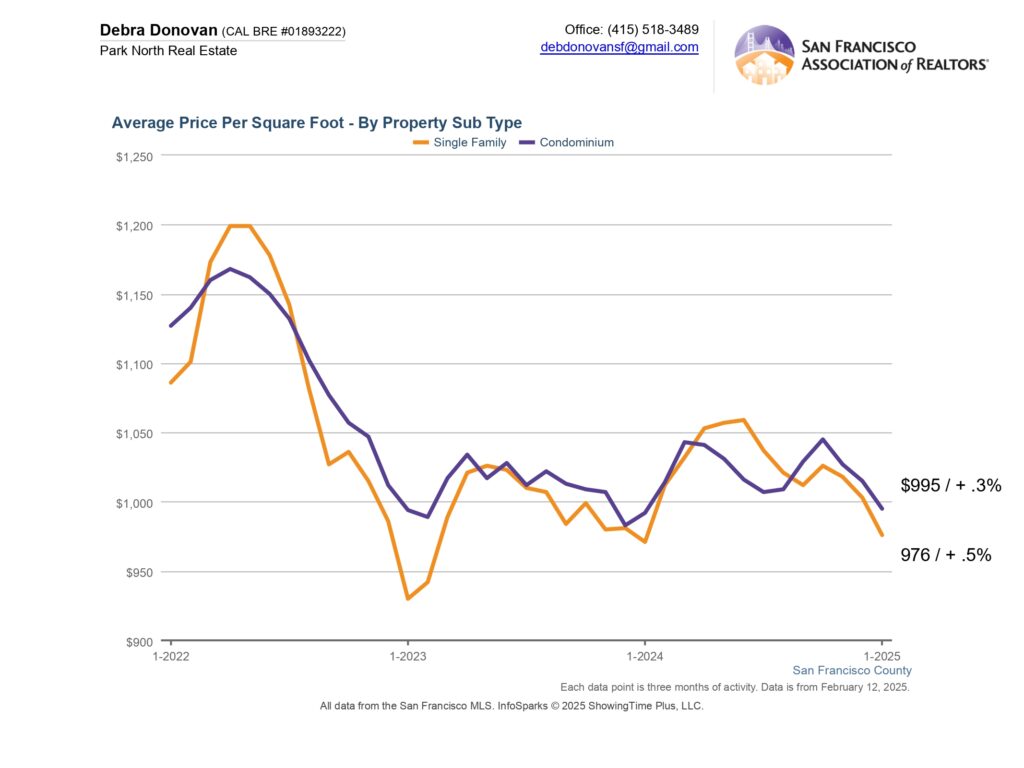
Average Price per Square Foot:
In January single family homes sold for an average of $976 per square foot, up just 0.5% compared to last January. Condos sold for an average of $995 per square foot, also up but by just 0.3%.
The fine print: All information deemed reliable but not guaranteed or warranted. Data comes from the MLS so does not include off-market and most new construction condo sales. The Bay Area real estate market is dynamic so statistics can change on a daily basis. These statistics are meant to be a snapshot of the day and time they were pulled.