Q1 2025 San Francisco Real Estate Market Update
The year started with a fairly strong in the first quarter of 2025, particularly at the beginning of February. Overall, more homes were sold and more new listings were brought onto the market when compared to Q1 of 2024. Prices, however, remained relatively flat or down. Median single family home prices, for example were down 2% quarter over quarter. Condo sale prices continued to lag behind with median prices almost 10% down in Q1 2025 vs Q1 2024.This could be in part due to the housing mix of the market at that time; for example, fewer higher priced properties coming on the market affects median prices as a whole. Or it could be the result of outside effects, such as interest rates or other circumstances affecting buyers’ ability to purchase a home. Buyer demand, obviously, also affects the market. As we’ve been seeing for a long while, demand for single family homes has ruled in terms of buyer demand, while demand for condos and TICs have been declining since about the onset of the pandemic. However, this presents a great opportunity for buyers looking at condos.
Keep in mind that none of this data reflects the stock market or economic volatility due to the announcements of tariffs, which came after this time frame. Second quarter will show the effects, if any, that this caused.
Median Sales Price: San Francisco home sales prices for the first quarter were down for both single family homes and condos. The median price for a single family home dropped 2% to $1,617,500 compared to Q1 2024, and condo prices dropped almost 10% to $1,042,500.

New Listings: New listings increase over the first quarter in 2025 as compared to the same quarter last year. New single family home listings were up almost 9%, and new condo listings were up by about the same percentage as single family homes.
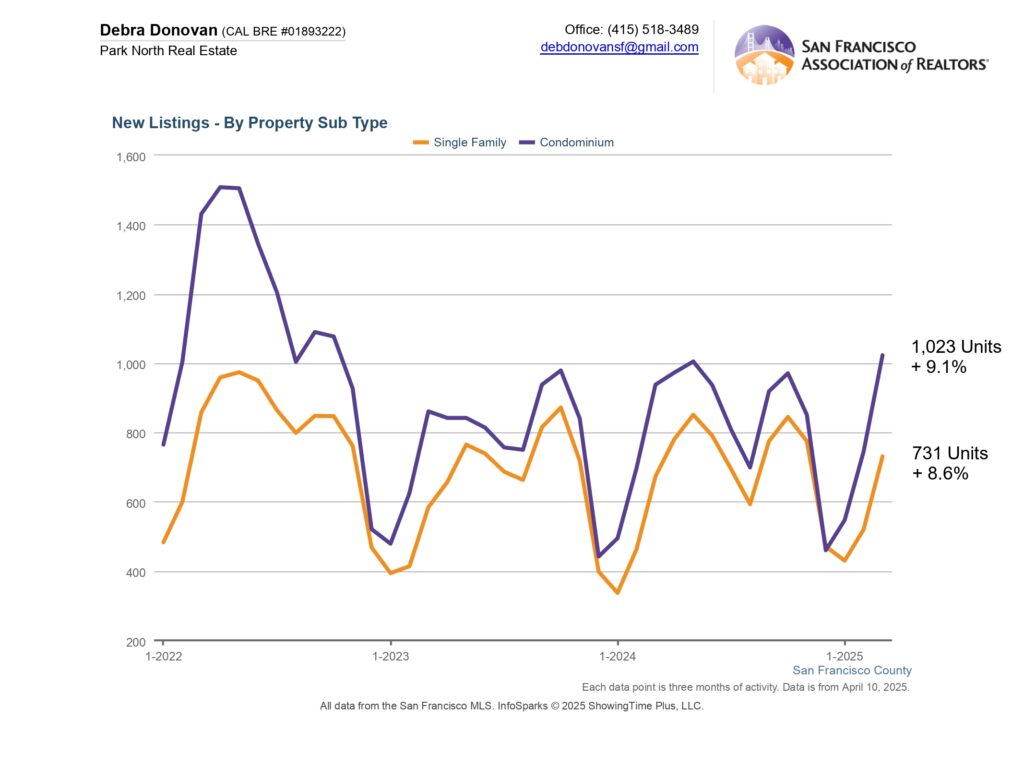
Sold Listings: The number of listing that sold in Q1 also increased. Single family homes showed a 15% increase in sold listings, while condos saw a 12% increase compared to the same quarter last year.

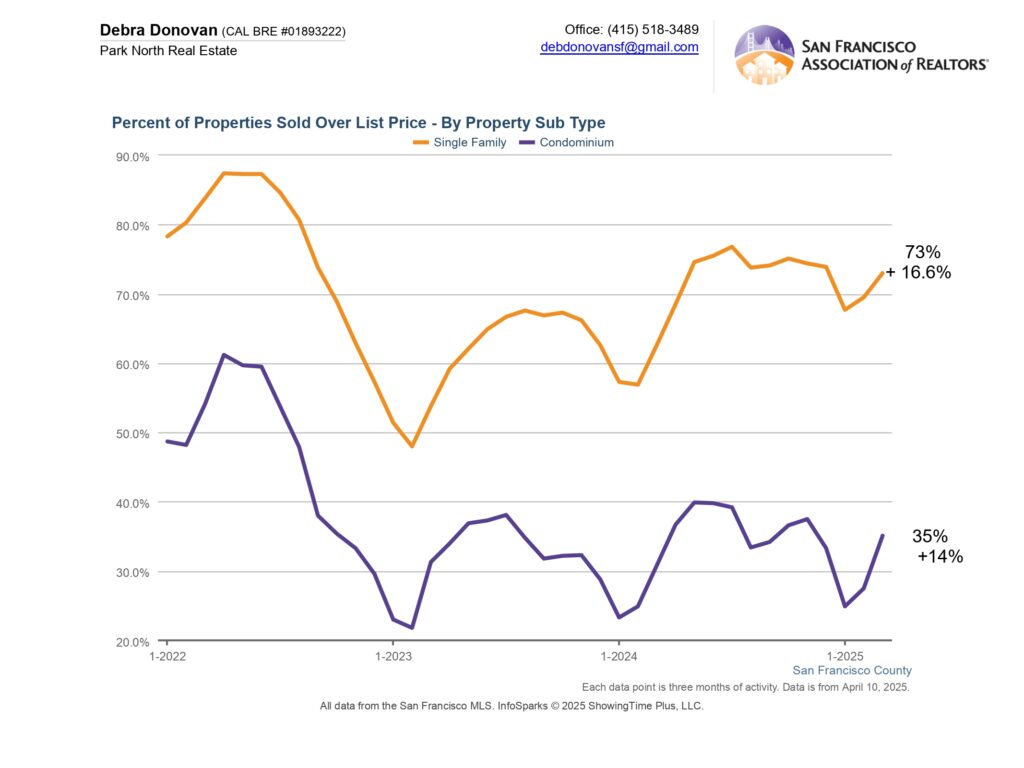
Percentage of Properties Sold Over List Price: Almost three quarters of single family homes sold for over their asking price in the first quarter of the year, up 16%. Just 35% of condos sold over their list price, though this was up 14% compared to the same quarter last year.
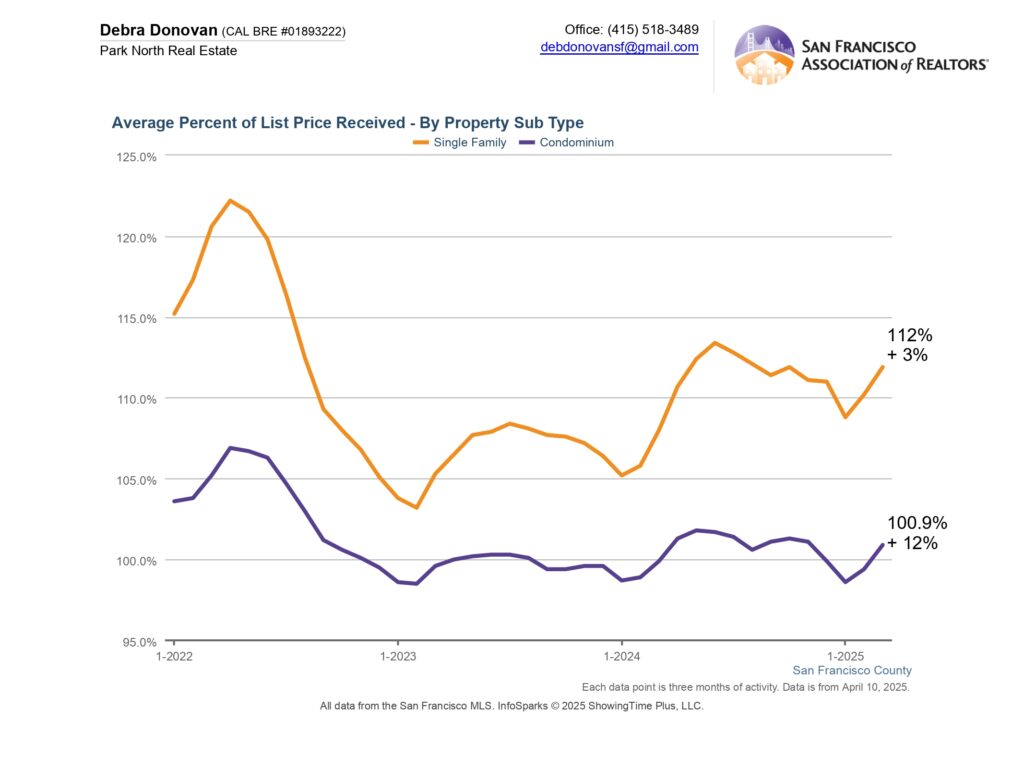
Average Percentage of List Price Received: In the first quarter of the year single family homes on average sold at 112% of their asking price, about 3% more than the same quarter last year. Condos on average sold at 100.9% of list price which represents a 1% increase compared to first quarter last year.
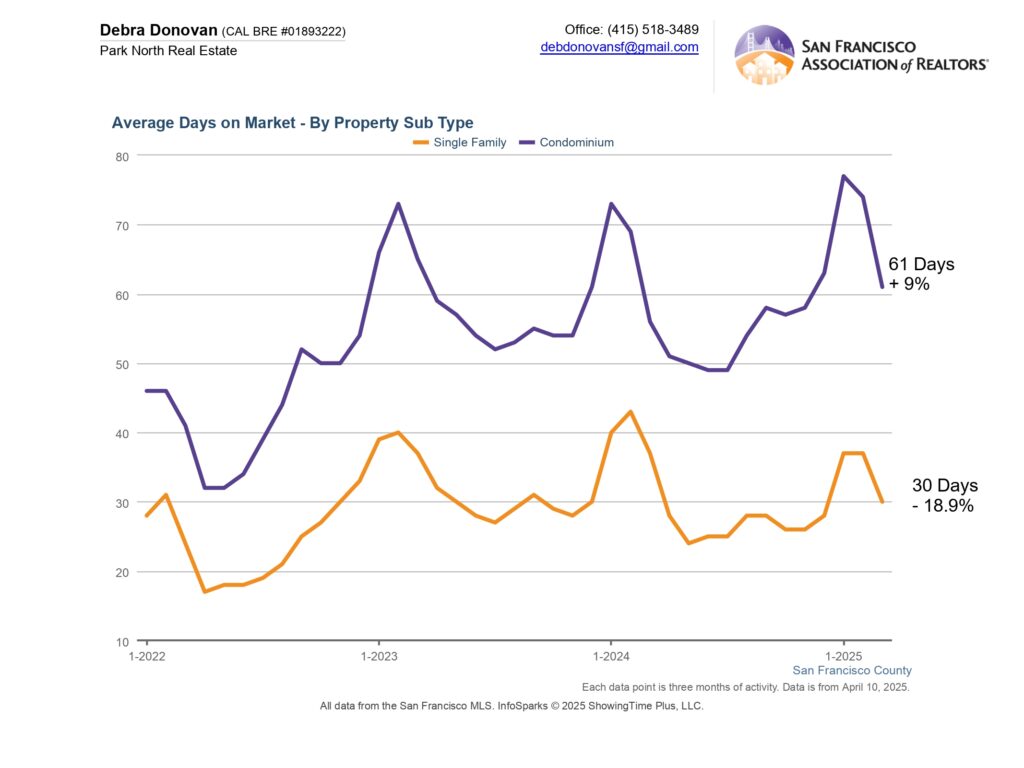
Average Days On Market: Single family homes spent an average of 30 days on the market before accepting an offer in Q1, which is down 19% compared to the first quarter last year. On average for condos it was 61 days, up 9%.
Months Supply of Inventory: MSI represents the rate at which current inventory on the market would be absorbed. For single family homes, MSI was 1.3 months, down almost 19% from the same quarter last year making it a seller’s market. Condos had 3.5 months of inventory in Q1, down 12.5%, still well below a buyer’s market, which would be about 5 months of inventory.

The fine print: All information deemed reliable but not guaranteed or warranted. Data comes from the MLS so does not include off-market and most new construction condo sales. The Bay Area real estate market is dynamic so statistics can change on a daily basis. These statistics are meant to be a snapshot of the day and time they were pulled.