San Francisco Real Estate Market Update – June 2017
The Real Estate Trifecta and Where to Find the Homes in SF with the Highest and Lowest Cost per Square Foot.
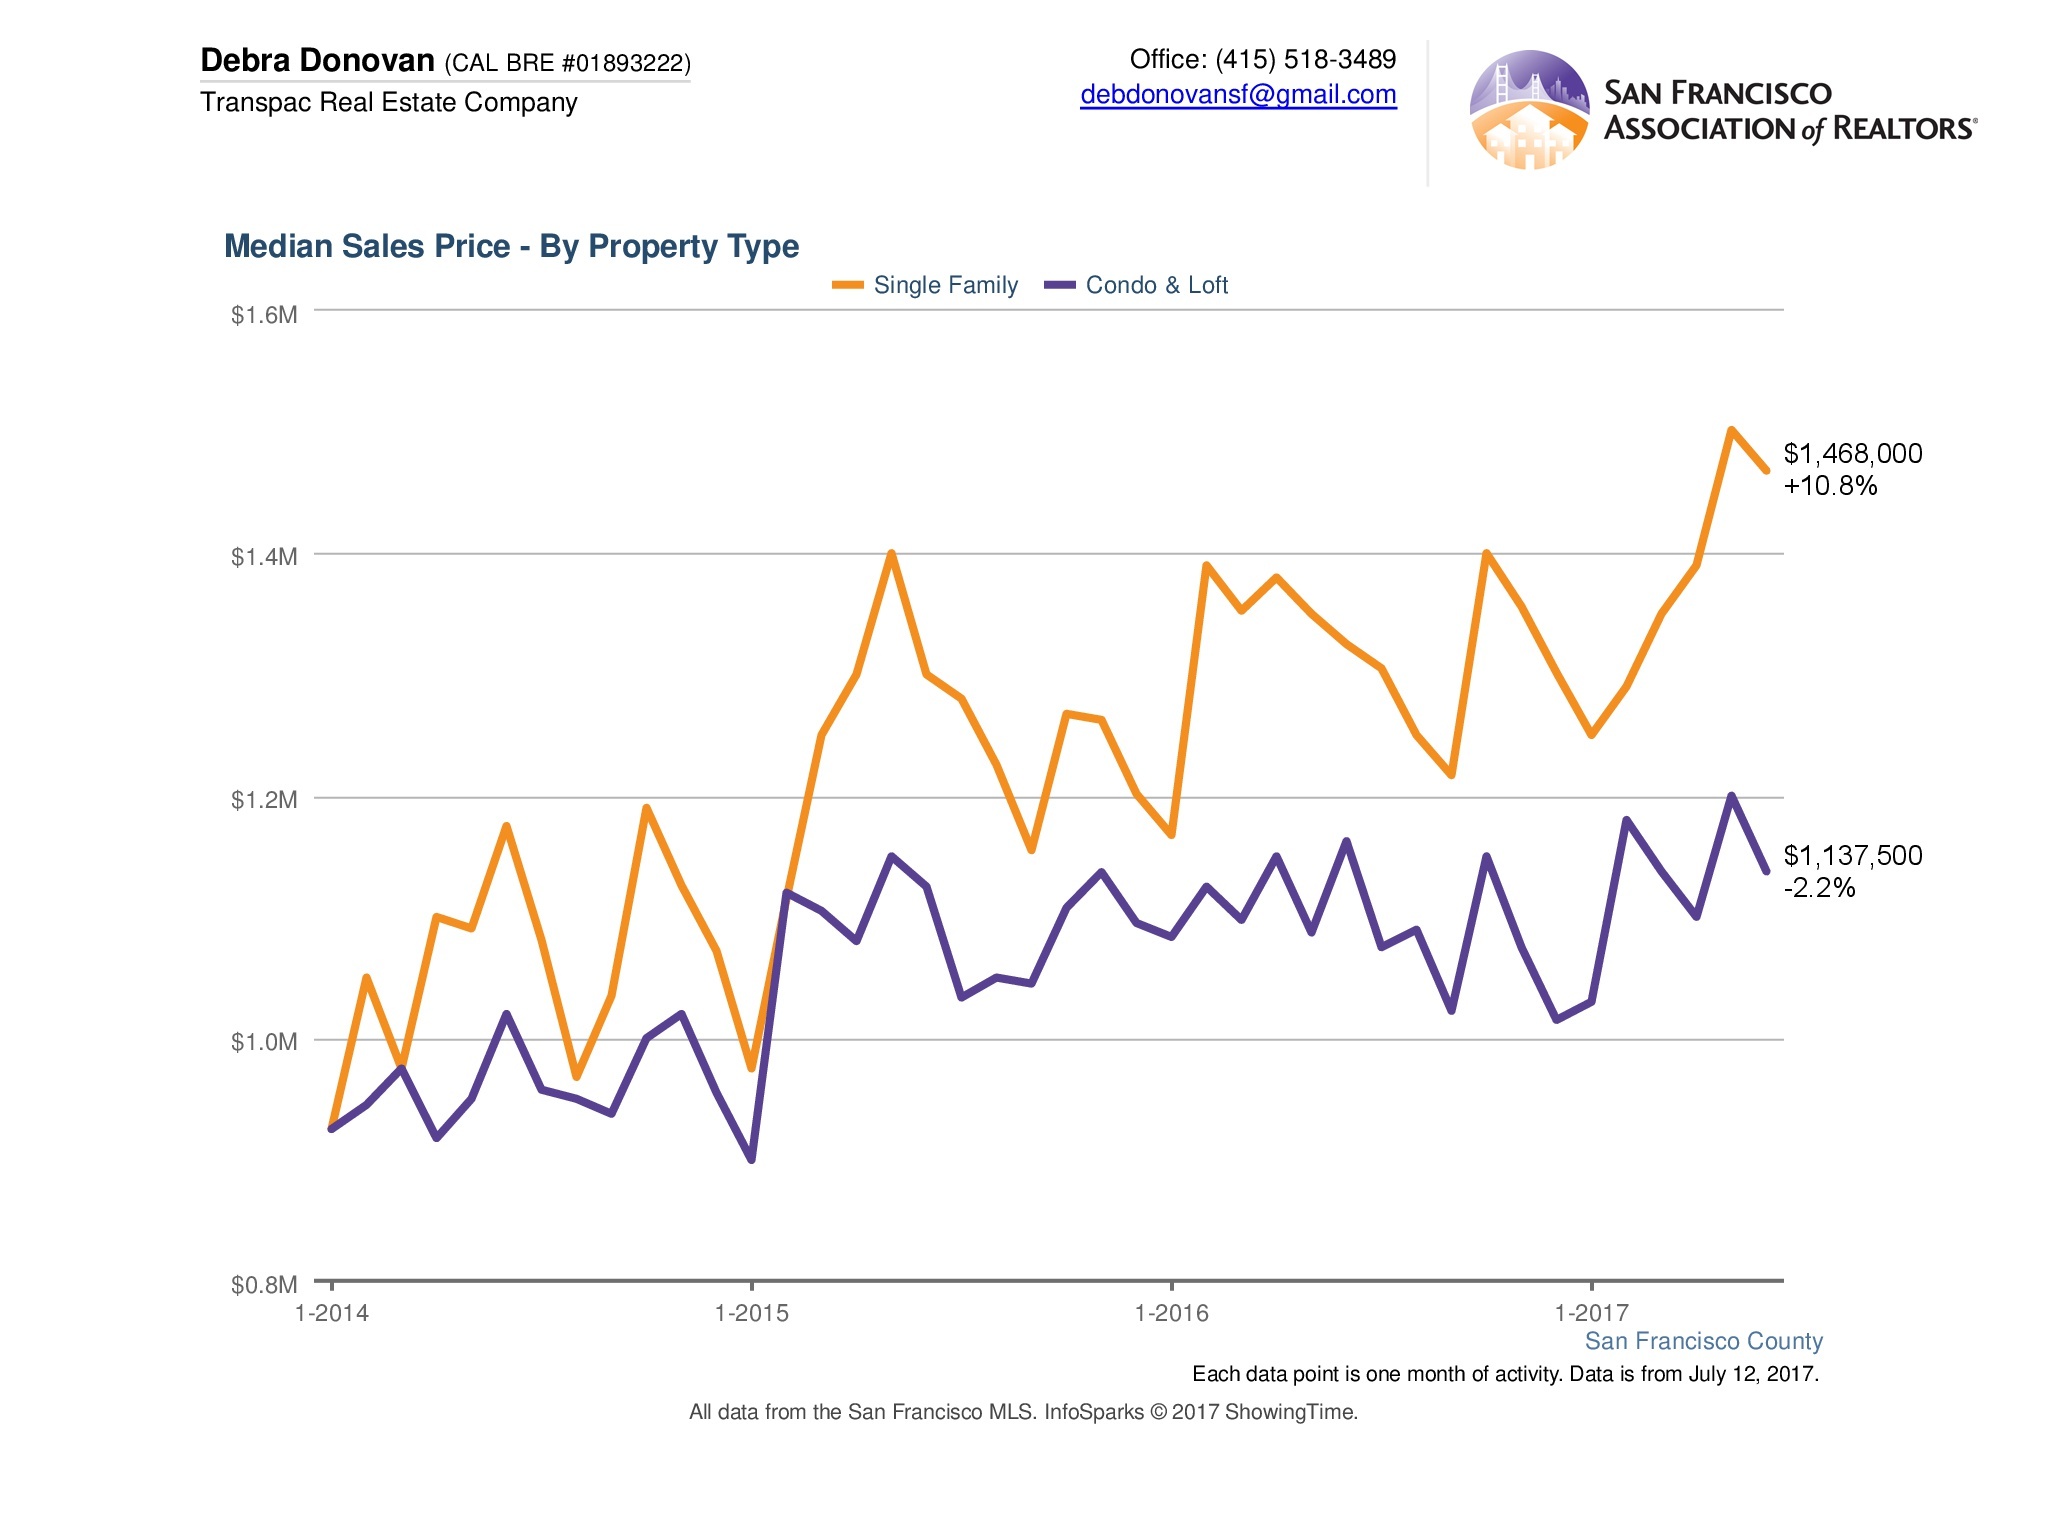
Median Sales Price:
Low inventory, low interest rates and low unemployment rates. This by-now-well-known trifecta kept median prices lofty again in June, albeit dipping slightly from May. Single family home prices were up double digits compared to June 2016, and condos/ lofts saw only a small decrease.
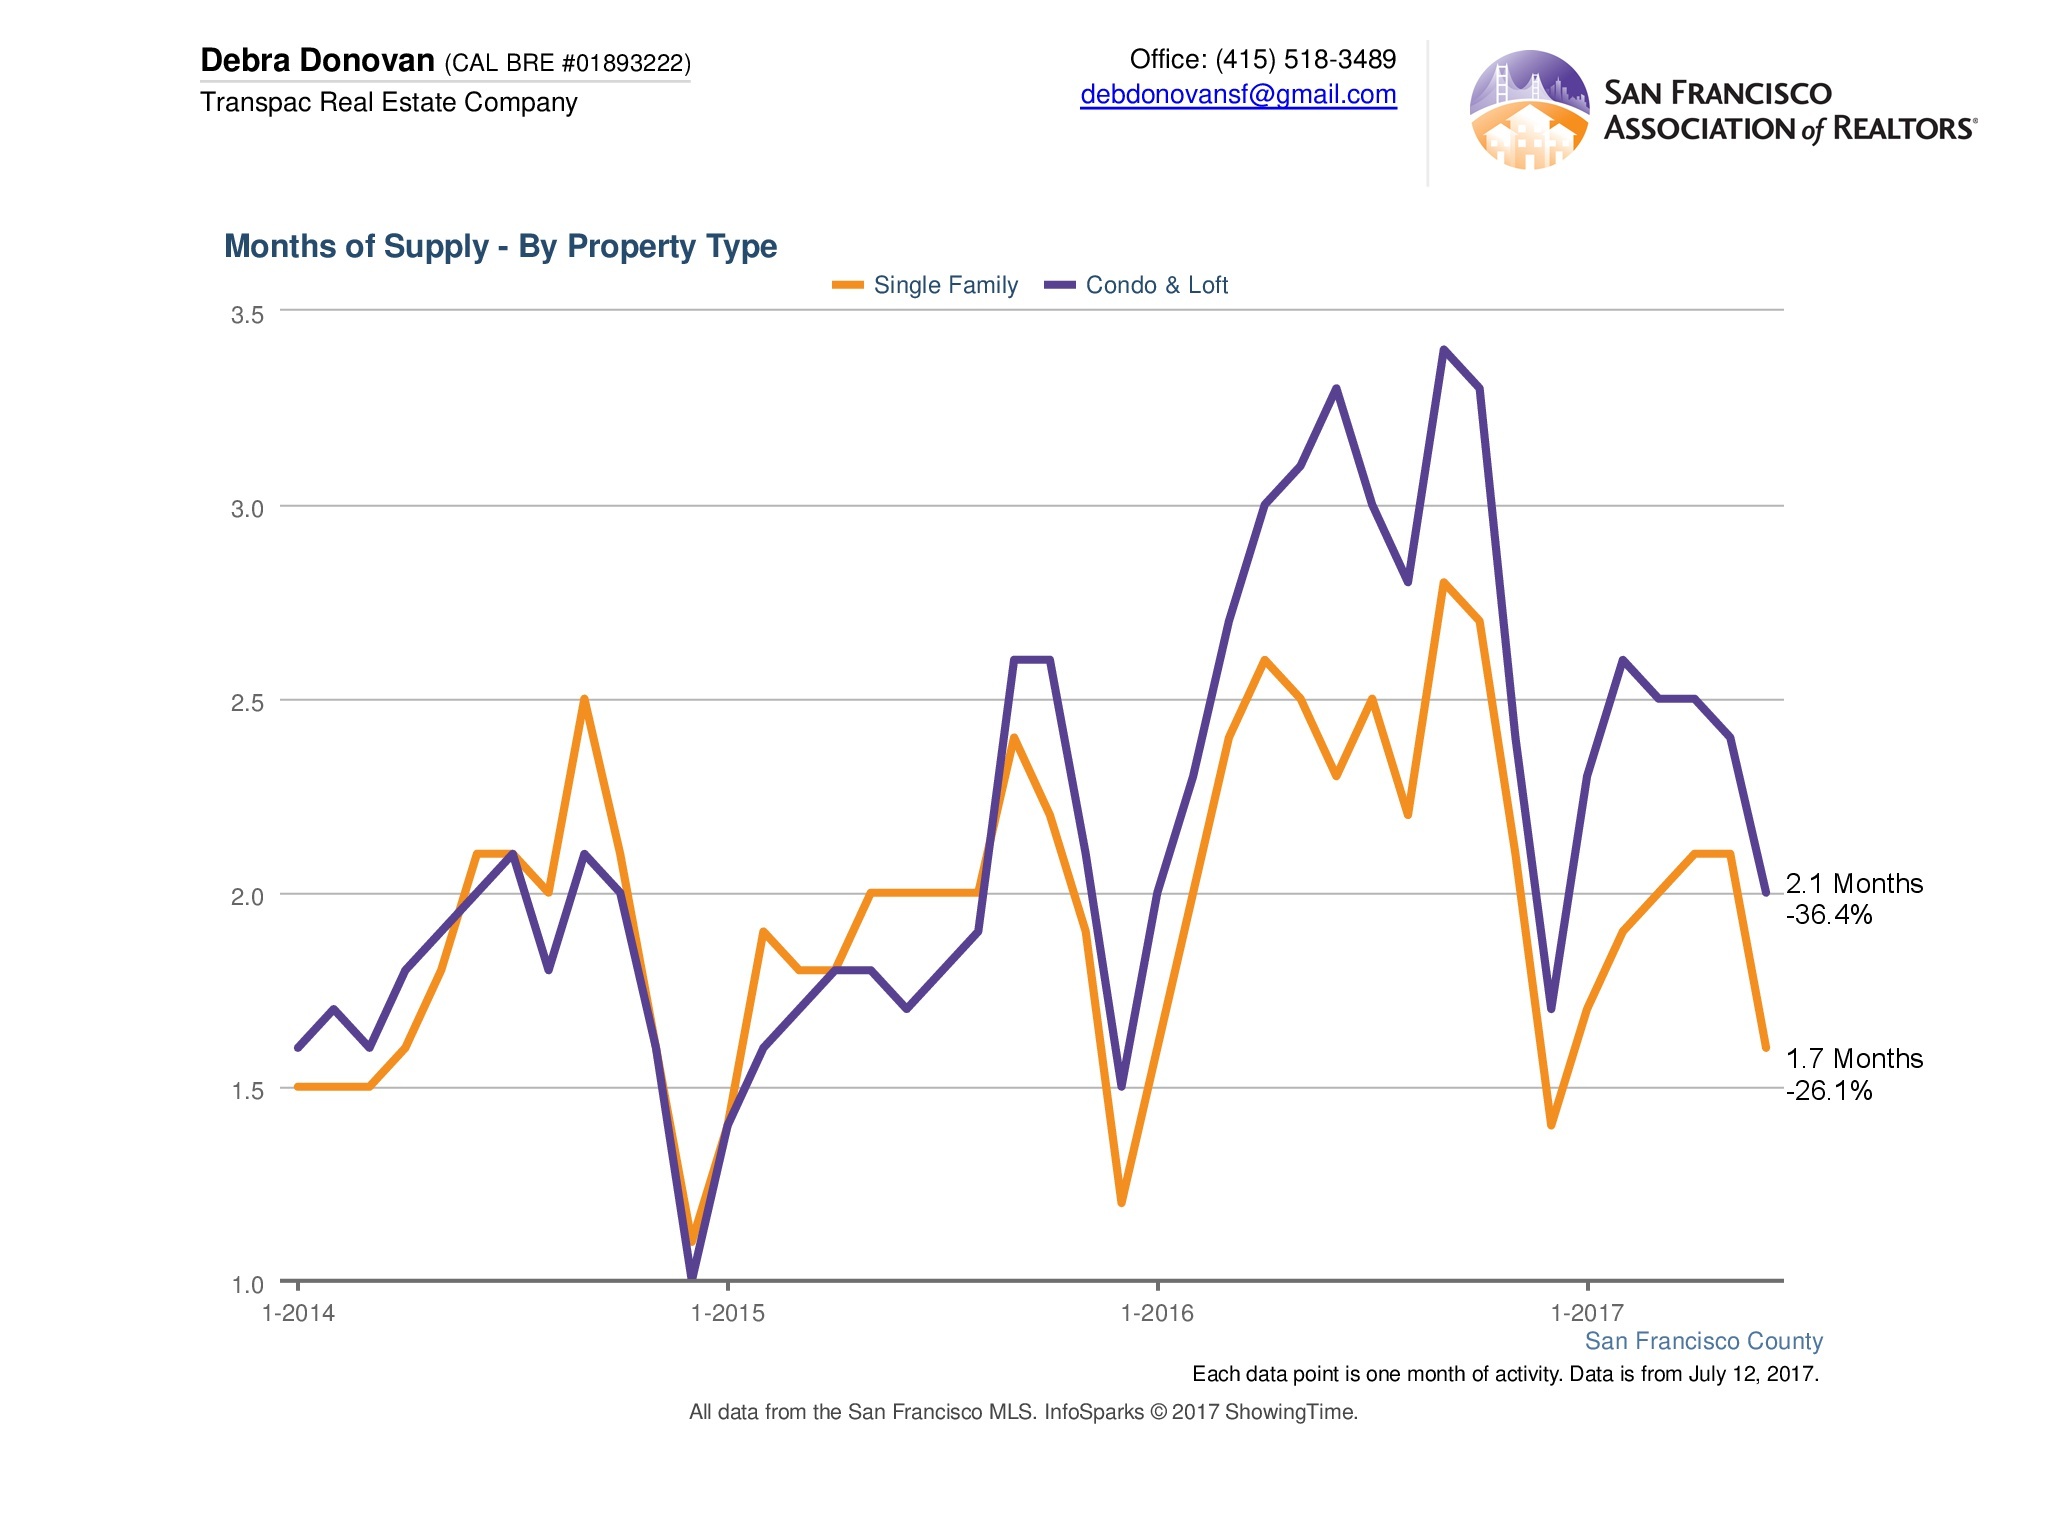
Month’s Supply of Inventory:
MSI was also down to January levels with only 1.7 months worth of inventory for single family homes, and only 2.1 months for condos/ lofts. Inventory continues to be very tight. Less than 200 single family homes came on the market in June, down 16% from a year ago; only 215 condos, down a whopping 41% compared to June 2016 came onto market. (Note: typically new construction condo sales are not included in this data).
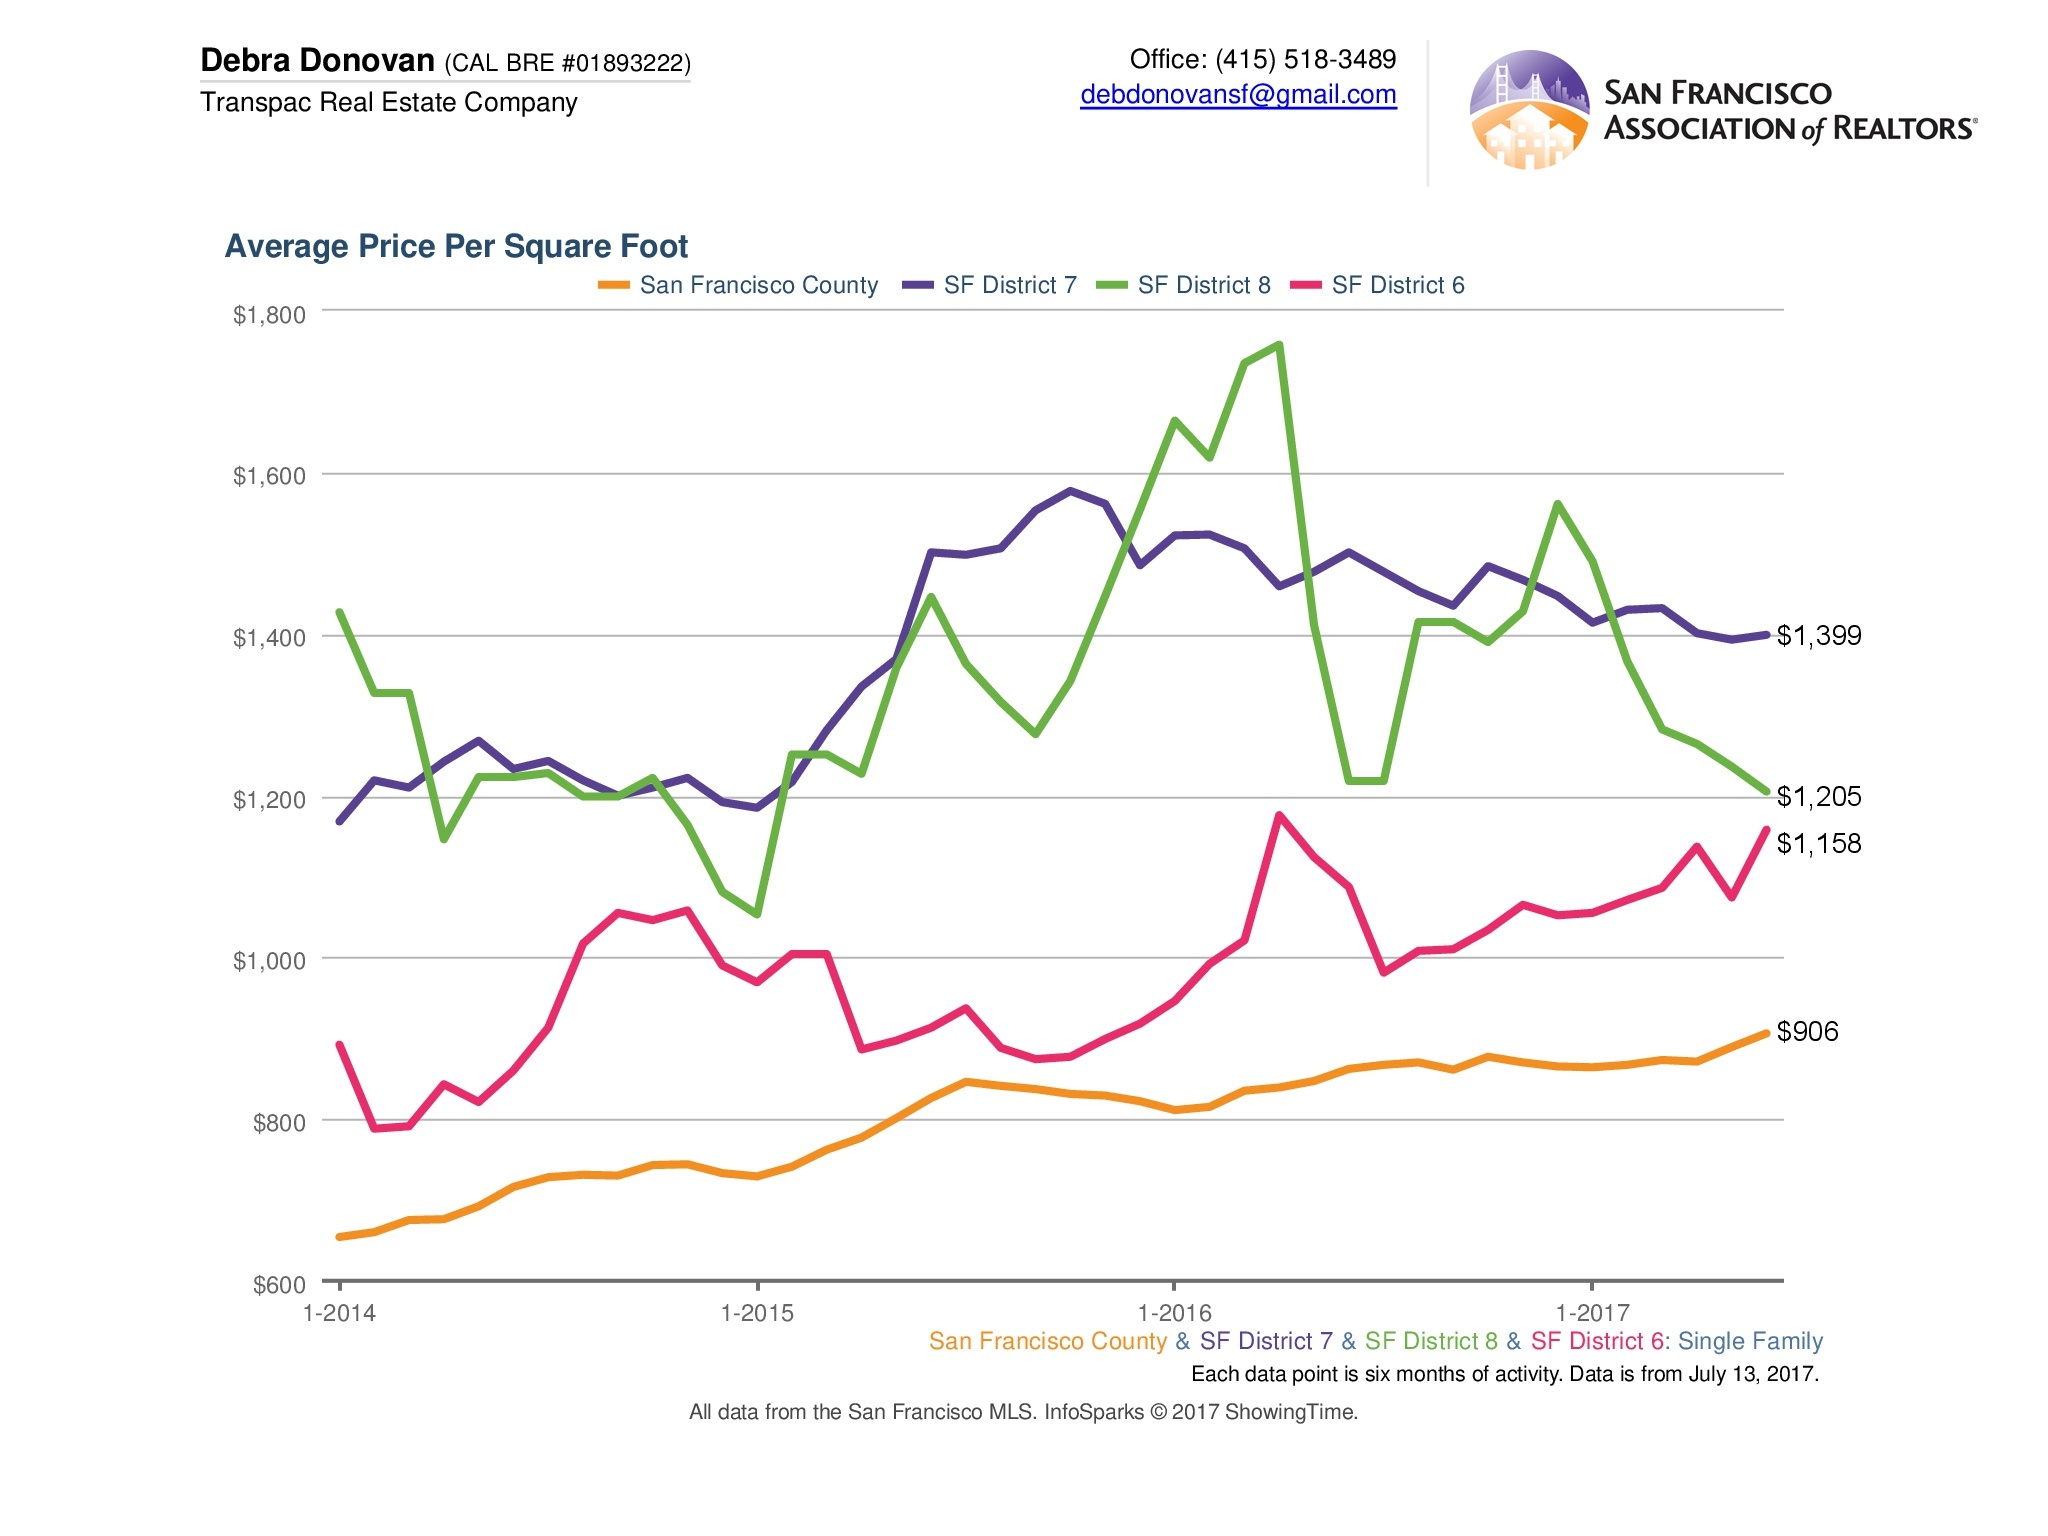
Highest and Lowest Price per Square Foot:
One way to assess the value of a home is to look at the cost per square foot. You determine what the average cost per square foot of similar homes in the area, and then multiply it by the total number of square feet of the subject home. Here, we look at the districts in San Francisco that have the highest and lowest cost per square foot for single family homes and condos/ lofts.
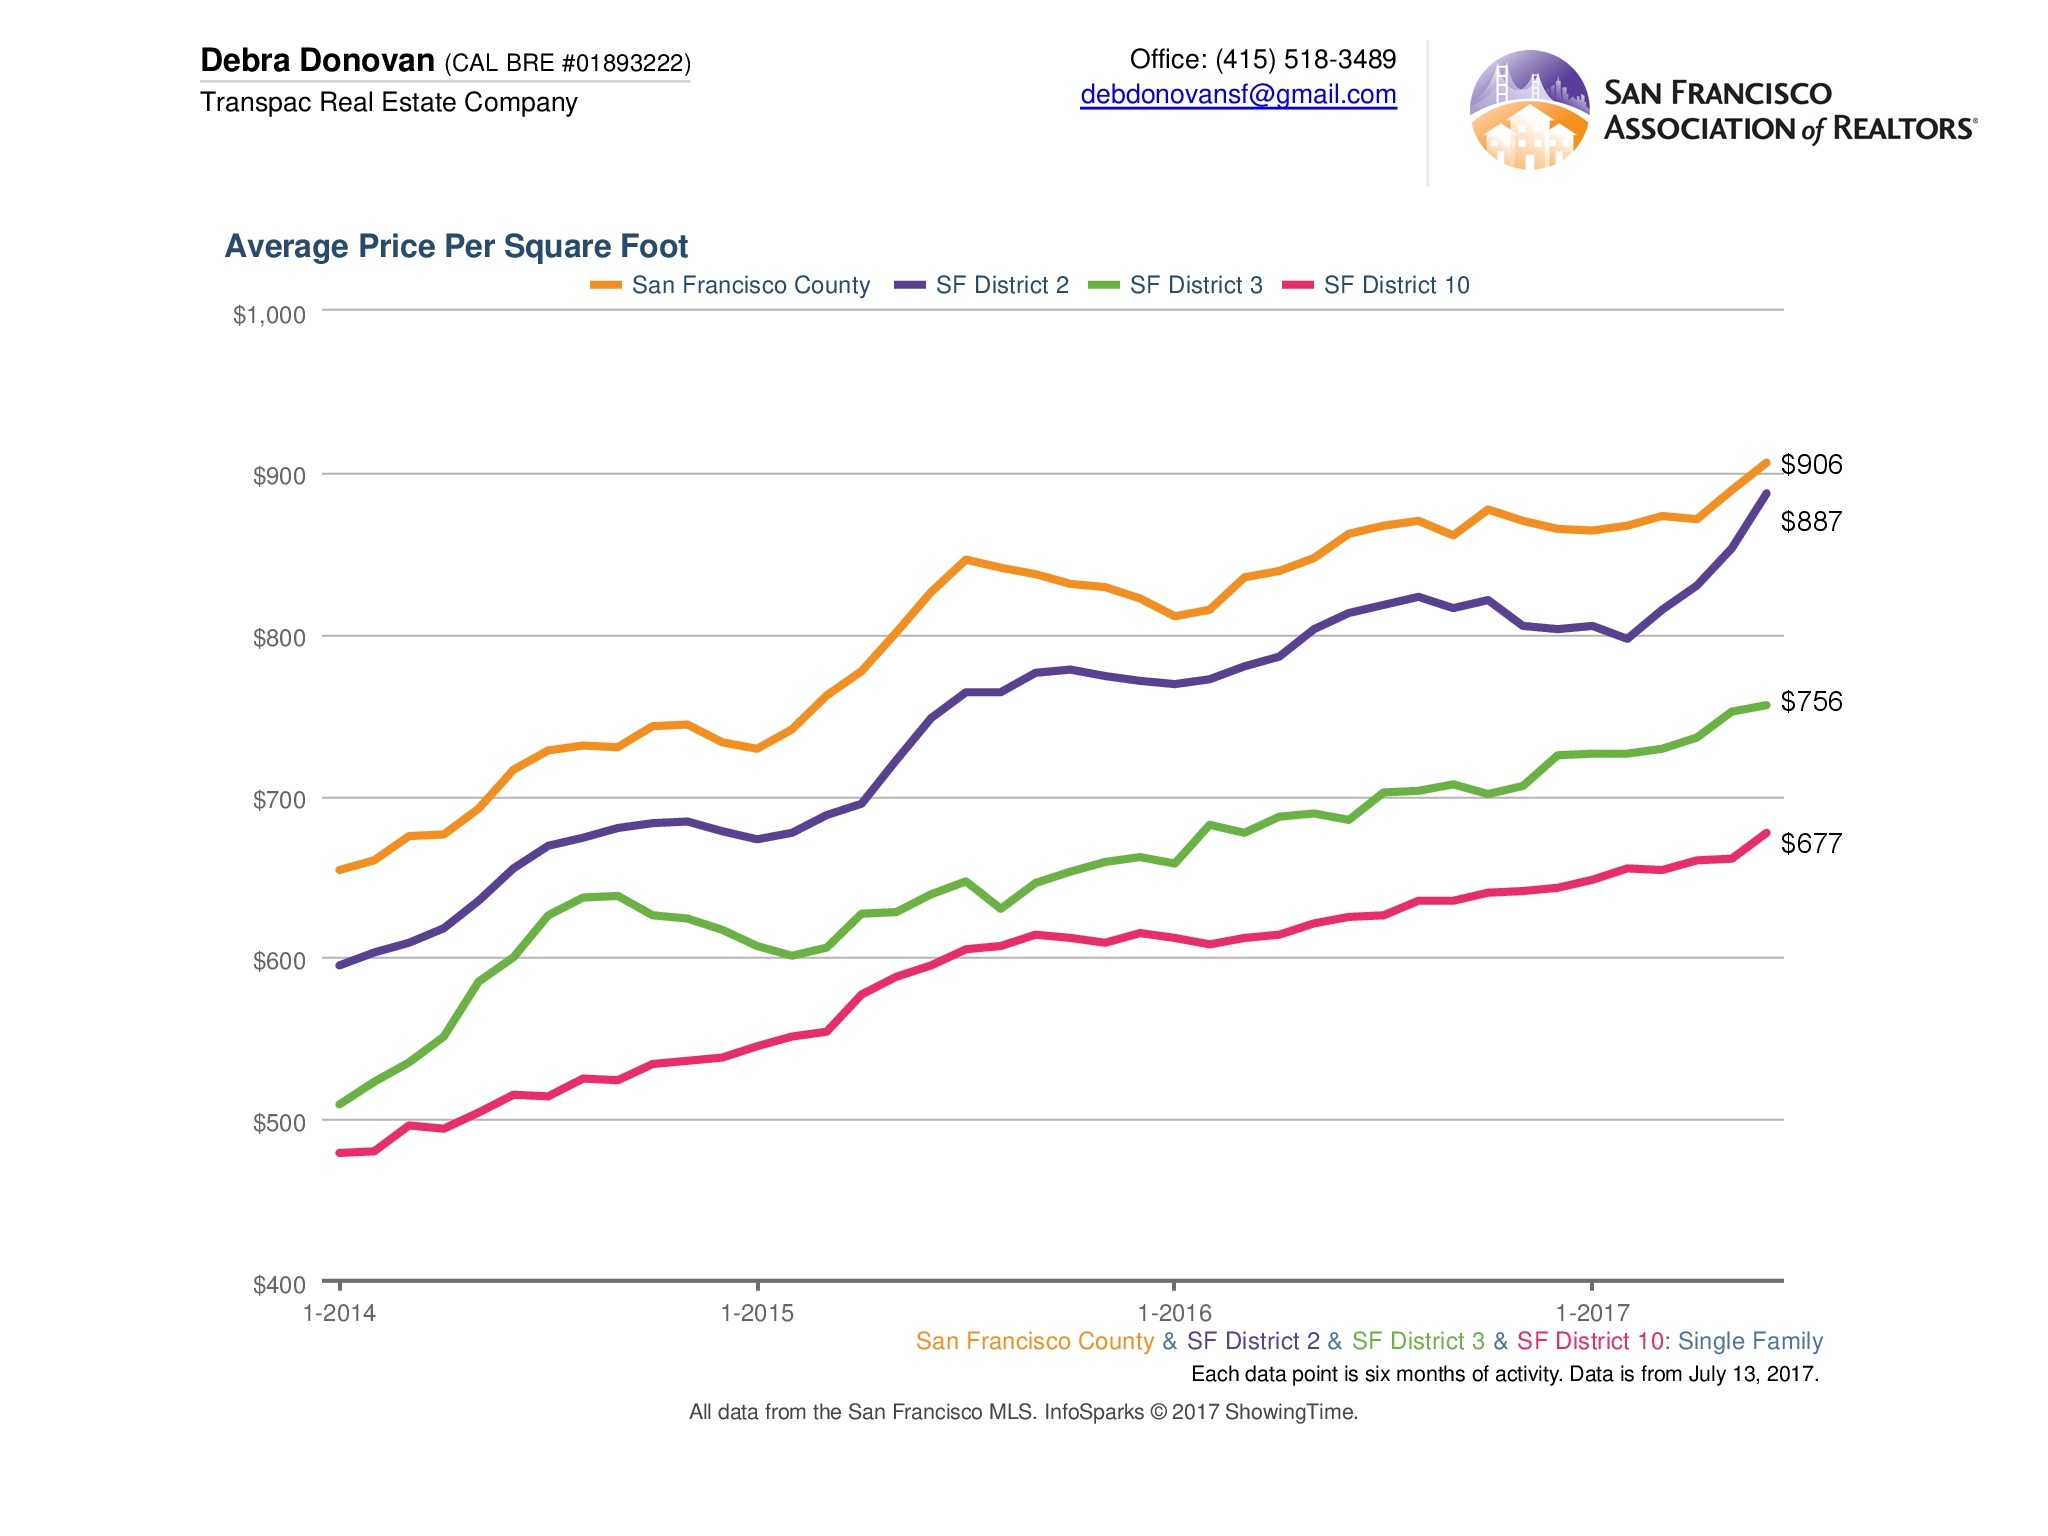
Single Family Homes:
For single family homes, the north side of the city rules. Perhaps not surprisingly, District 7, which encompasses tony Pacific Heights, the Marina, Cow Hollow and Precidio Heights has the highest cost per square foot at almost $1,400/ sq. ft. District 8, which includes neighborhoods like Russian Hill, Nob Hill, North Beach and Downtown, comes in at $1,205 for the month of June, followed by District 6 with neighborhoods like Hayes Valley, NoPA and Lower Pacific Heights at $1,158 per square foot. All come in well above the City-wide average of $906/ sq. ft.
At the other end of the spectrum for single family homes are District 2, which includes mostly the Sunset (inner, central and outer) as well as Golden Gate Heights,which in June clocked in at $887/ sq. ft. Homes in District 3, covering Oceanview, Stonestown, Ingleside and Ingleside and Merced Heights cost an average of $756/ sq. ft. The most southerly area, District 10 with neighborhoods like Bayview, Crocker Amazon, Portola and Excelsior came in with the lowest price per square foot in June, $677/ sq. ft.
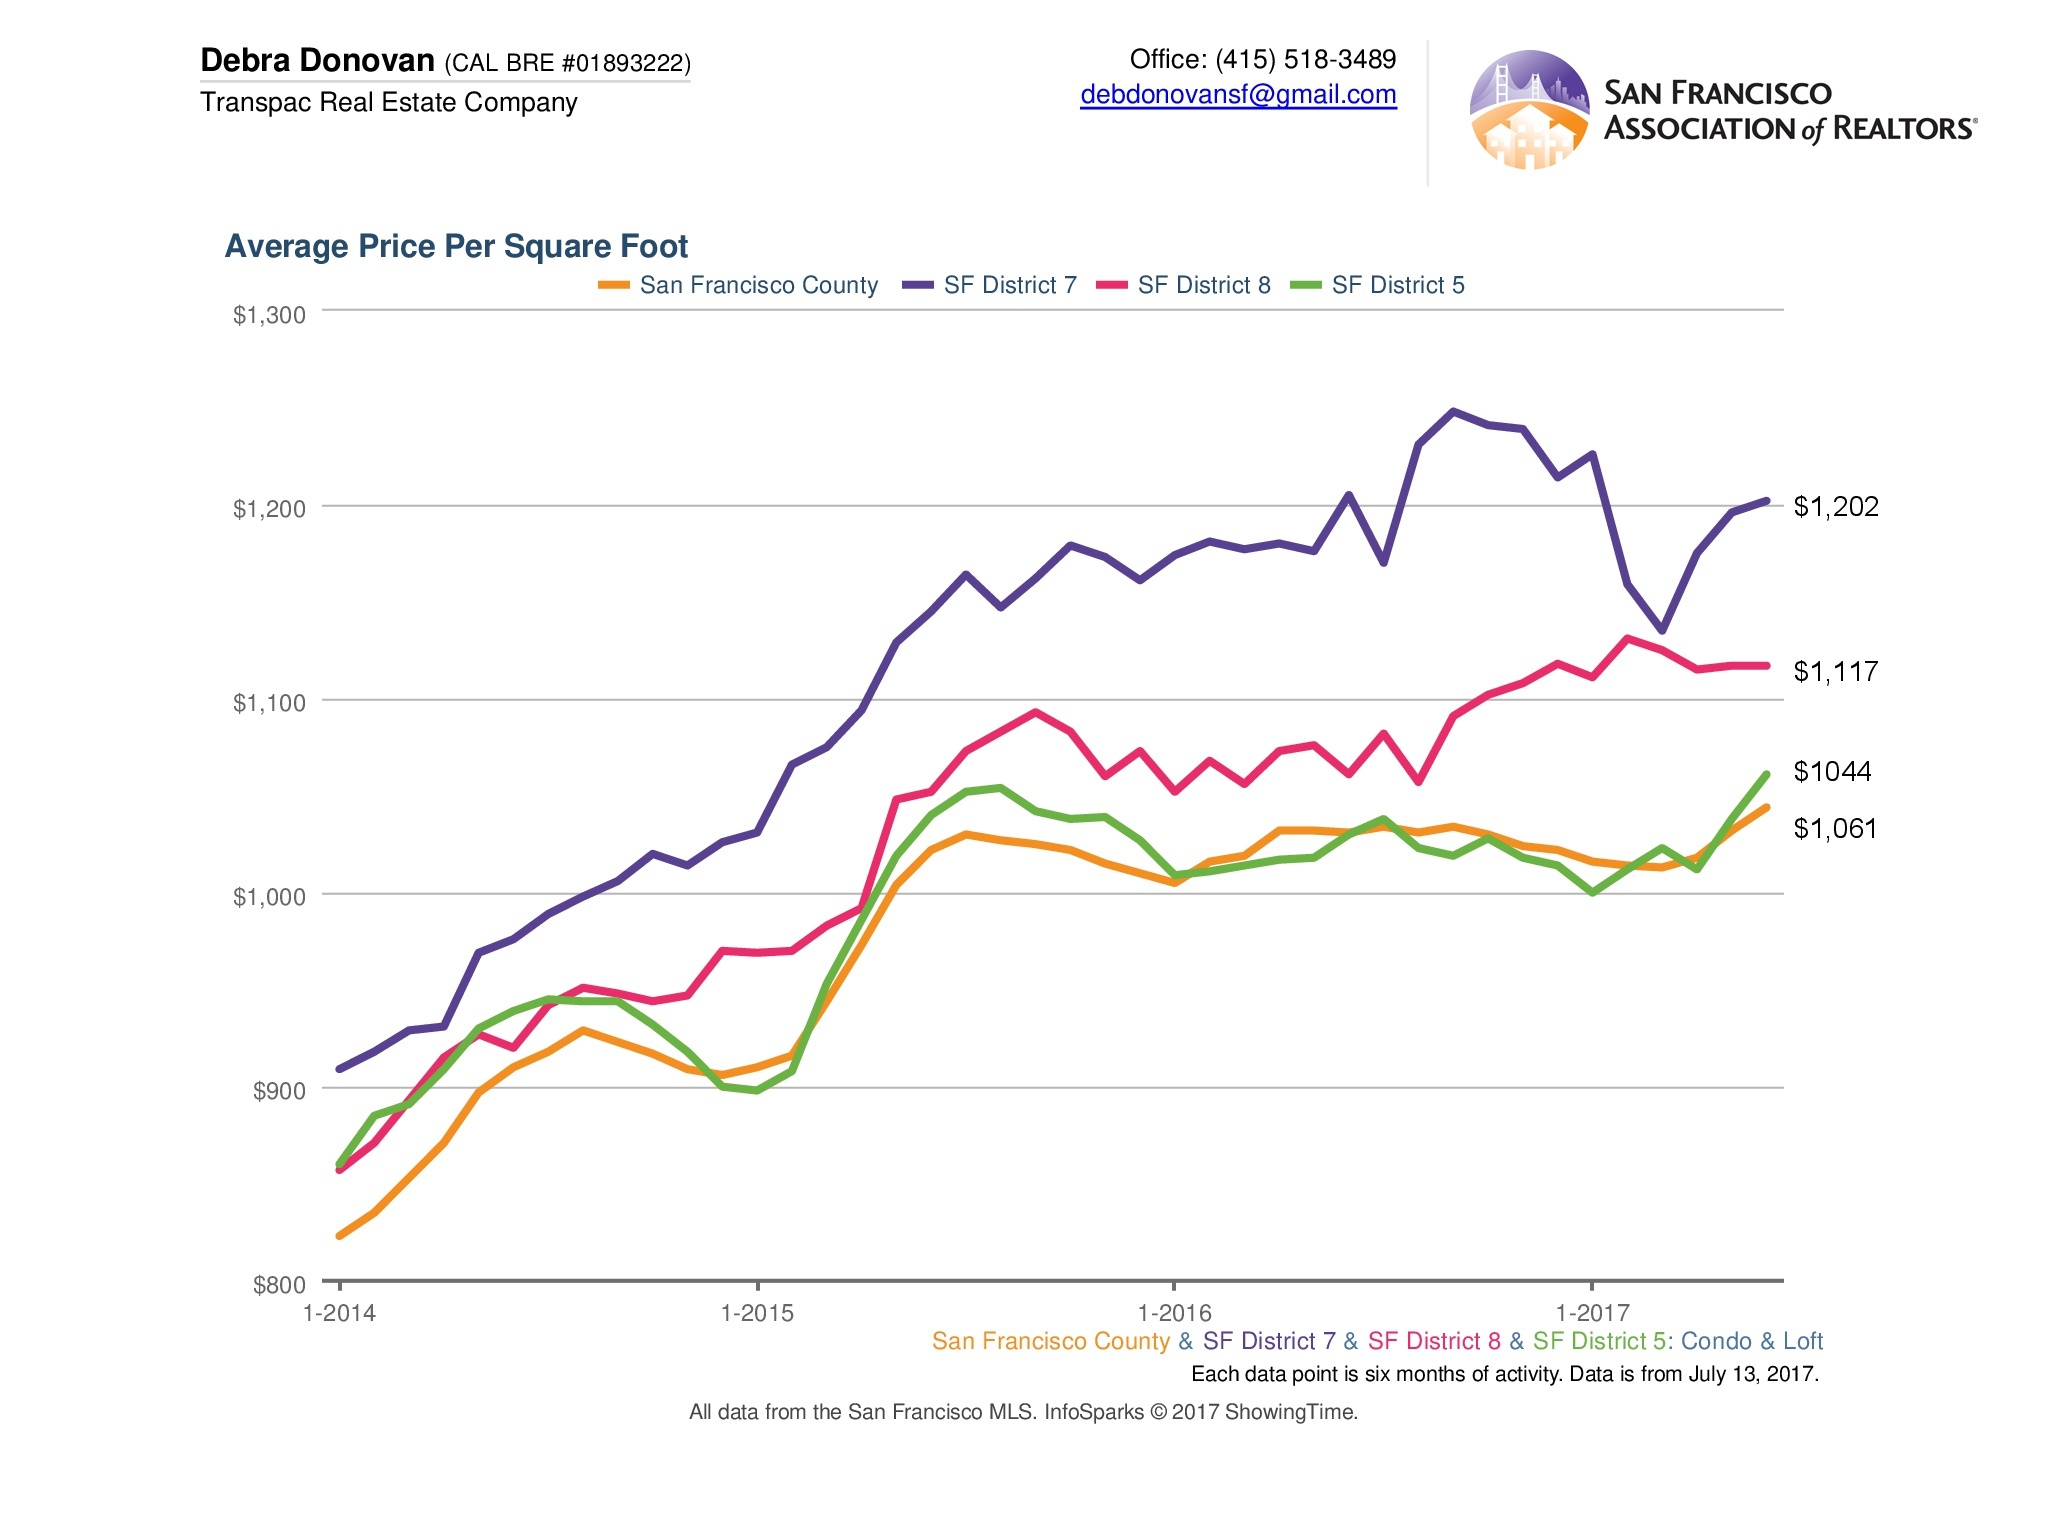
Condos/ Lofts:
For condos/ lofts, Districts 7 and 8 mirrored single family homes with the highest average cost per square foot in June, with $1,202 and $1,117 respectively. District 5, which encompasses Noe Valley, Haight Ashbury, Cole Valley and Eureka Valley came in third with $1,061/ sq. ft.
On the flip side, the districts with the lowest cost per square foot can be found in District 4 (Twin Peaks, Diamond Heights, West Portal and surrounding areas), District 3, and District 10.
It’s important to note that sometimes averages can be deceiving. For example, one very large sale in District 7 or 8 could skew the average up, while a couple of lower-priced homes could skew to the opposite. In June, District 10 had 3 BMR (Below Market Rate) home sales
The fine print: All information deemed reliable but not guaranteed or warranted. Data comes from MLS so does not include off-market and most new construction condo sales. The San Francisco real estate market is dynamic so statistics can change on a daily basis. These statistics are meant to be a snapshot of the time they were pulled.
Photo courtesy of Kaddi Sudhi