San Francisco Real Estate Market Update – July 2017

Where’s the Inventory??
It’s great to be home after a nice vacation in hot, humid New York. I’m not sure I’ve ever missed our cool, foggy summer so much!
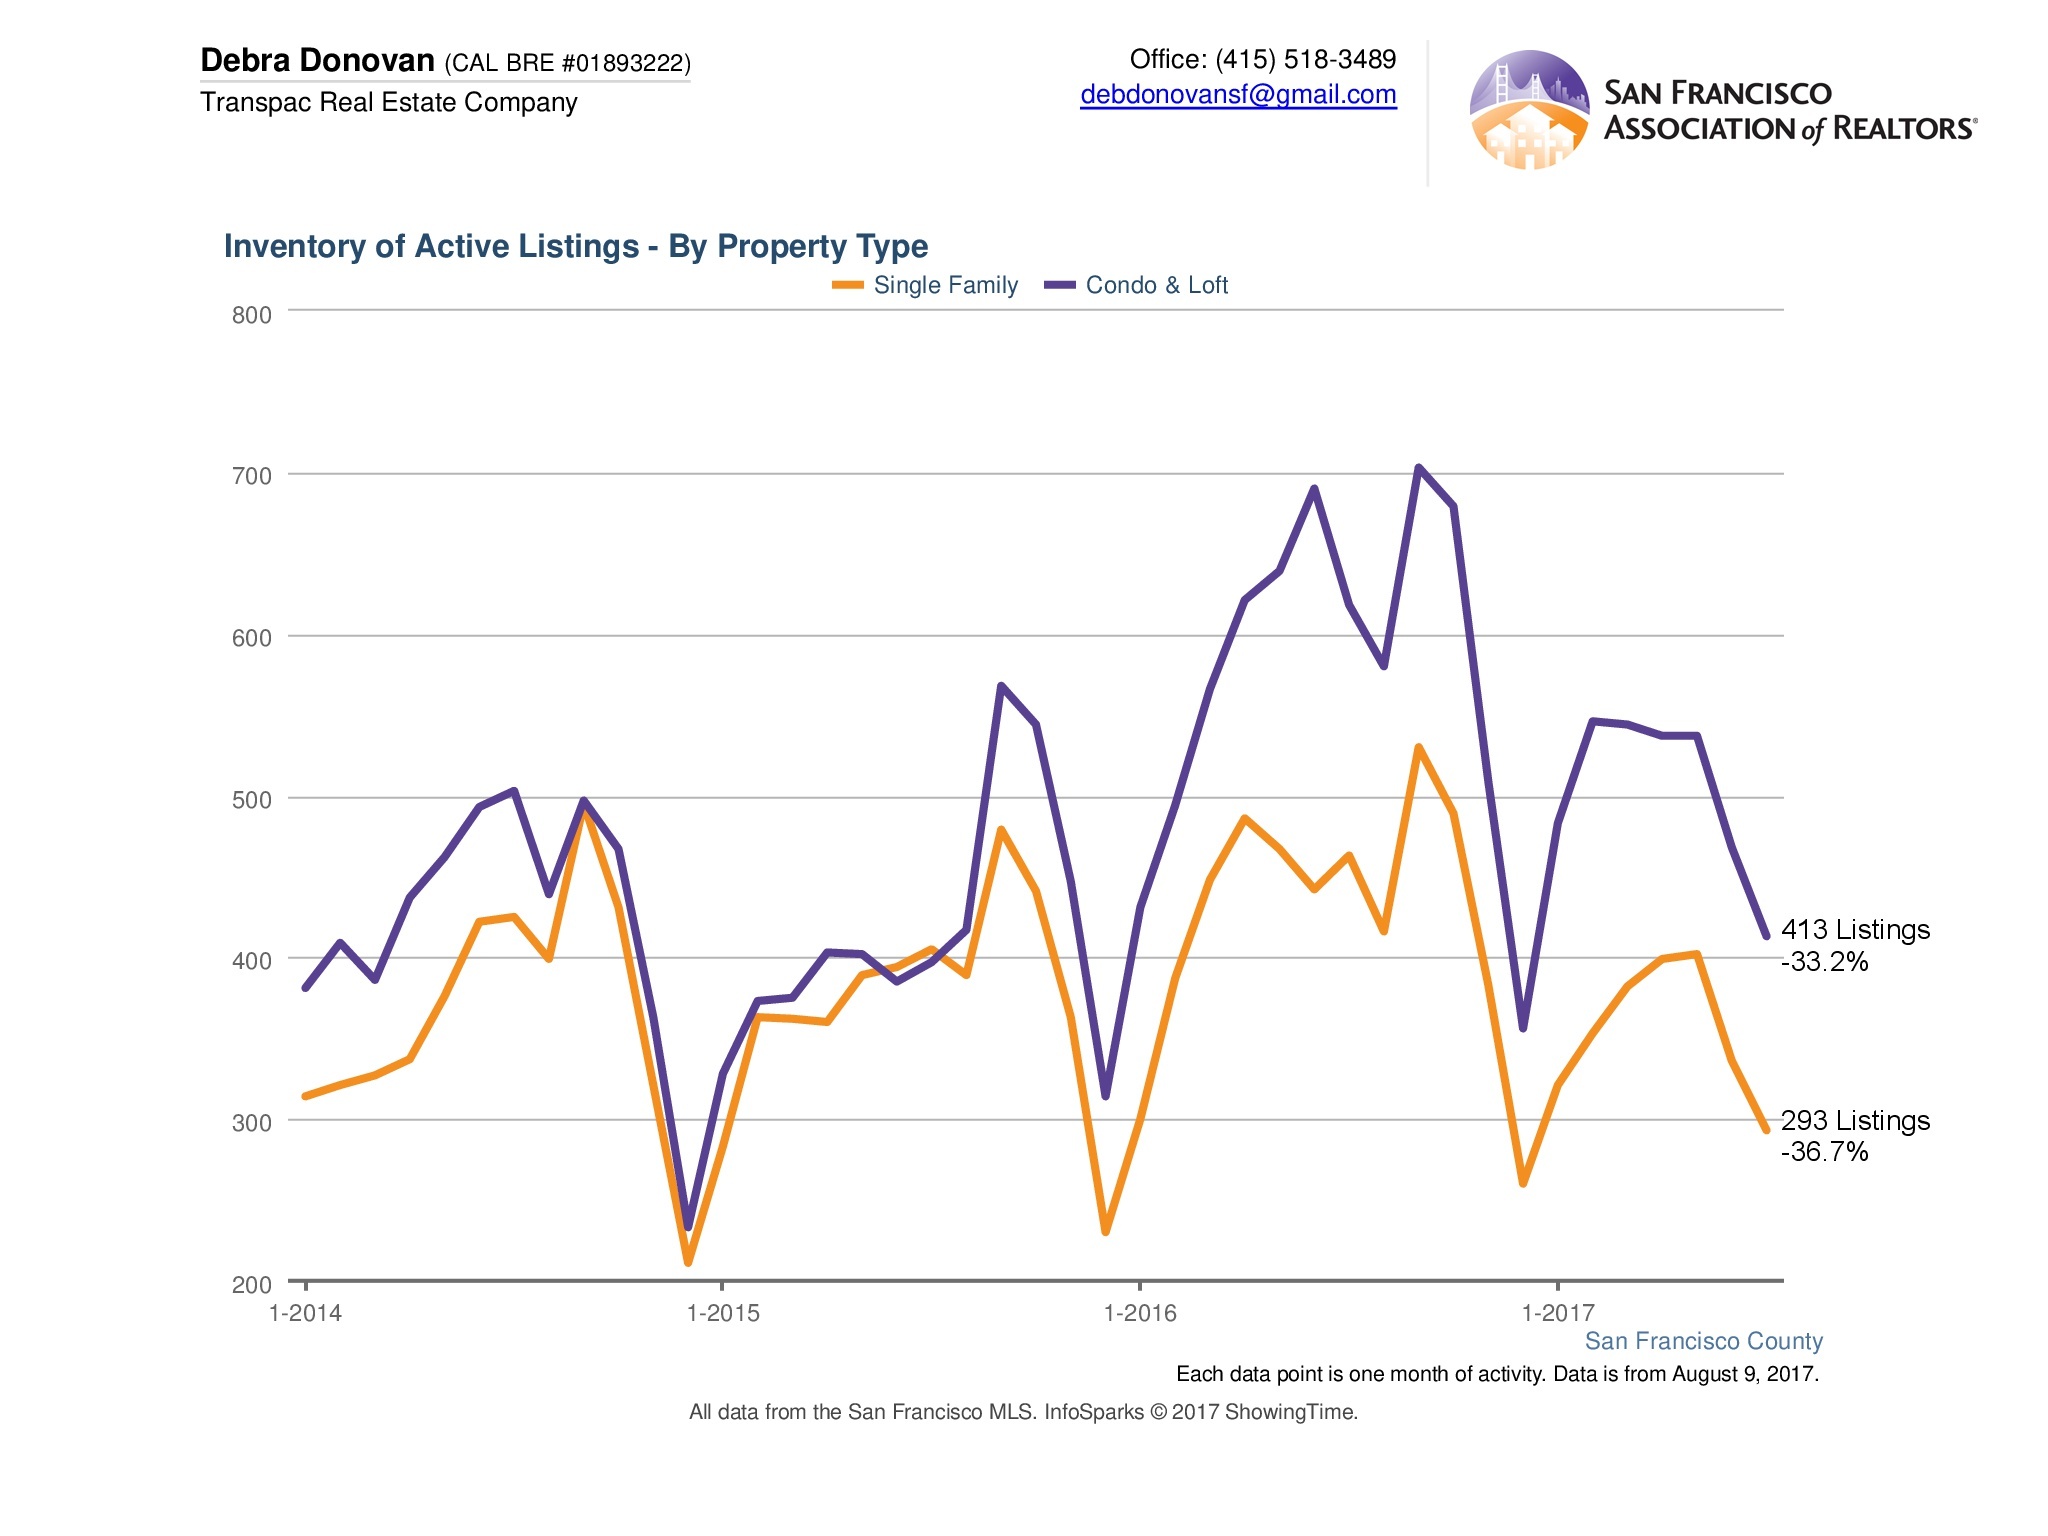
We’re now deep into the summer selling months, which in San Francisco is typically light on inventory, and this year is certainly not deviating from that history. This year seems even more anemic than years past and in fact, looking back through the past 10 years I couldn’t find another July with less new inventory or even overall active inventory on the market.
So where are all of the sellers??
One reason there are fewer sellers is that homeowners are staying in their homes longer. According to a recent KCM blog article I was reading, up until 2008 the average homeowner stayed in their home on average 6 years before selling. After the market collapse and through today, that has now increased to 9 years. The author goes on to give the reasons for this, and I agree with every one. But I would also add a couple of other factors, which may be more specific to the San Francisco real estate market: First, with inventory so low, potential sellers can’t find a replacement home. Whether it’s a young family wanting to upsize or empty nesters wanting to downsize, there is not much on the market to compete for. In addition, home prices have increased so steadily that even if there is a home to compete for, affordability becomes a factor. Yes, your $1 million condo may have increased 8-10% in equity over the past couple of years, but has the $2 million single family home you would like to purchase. It’s simple math.
So Where Is The Inventory?
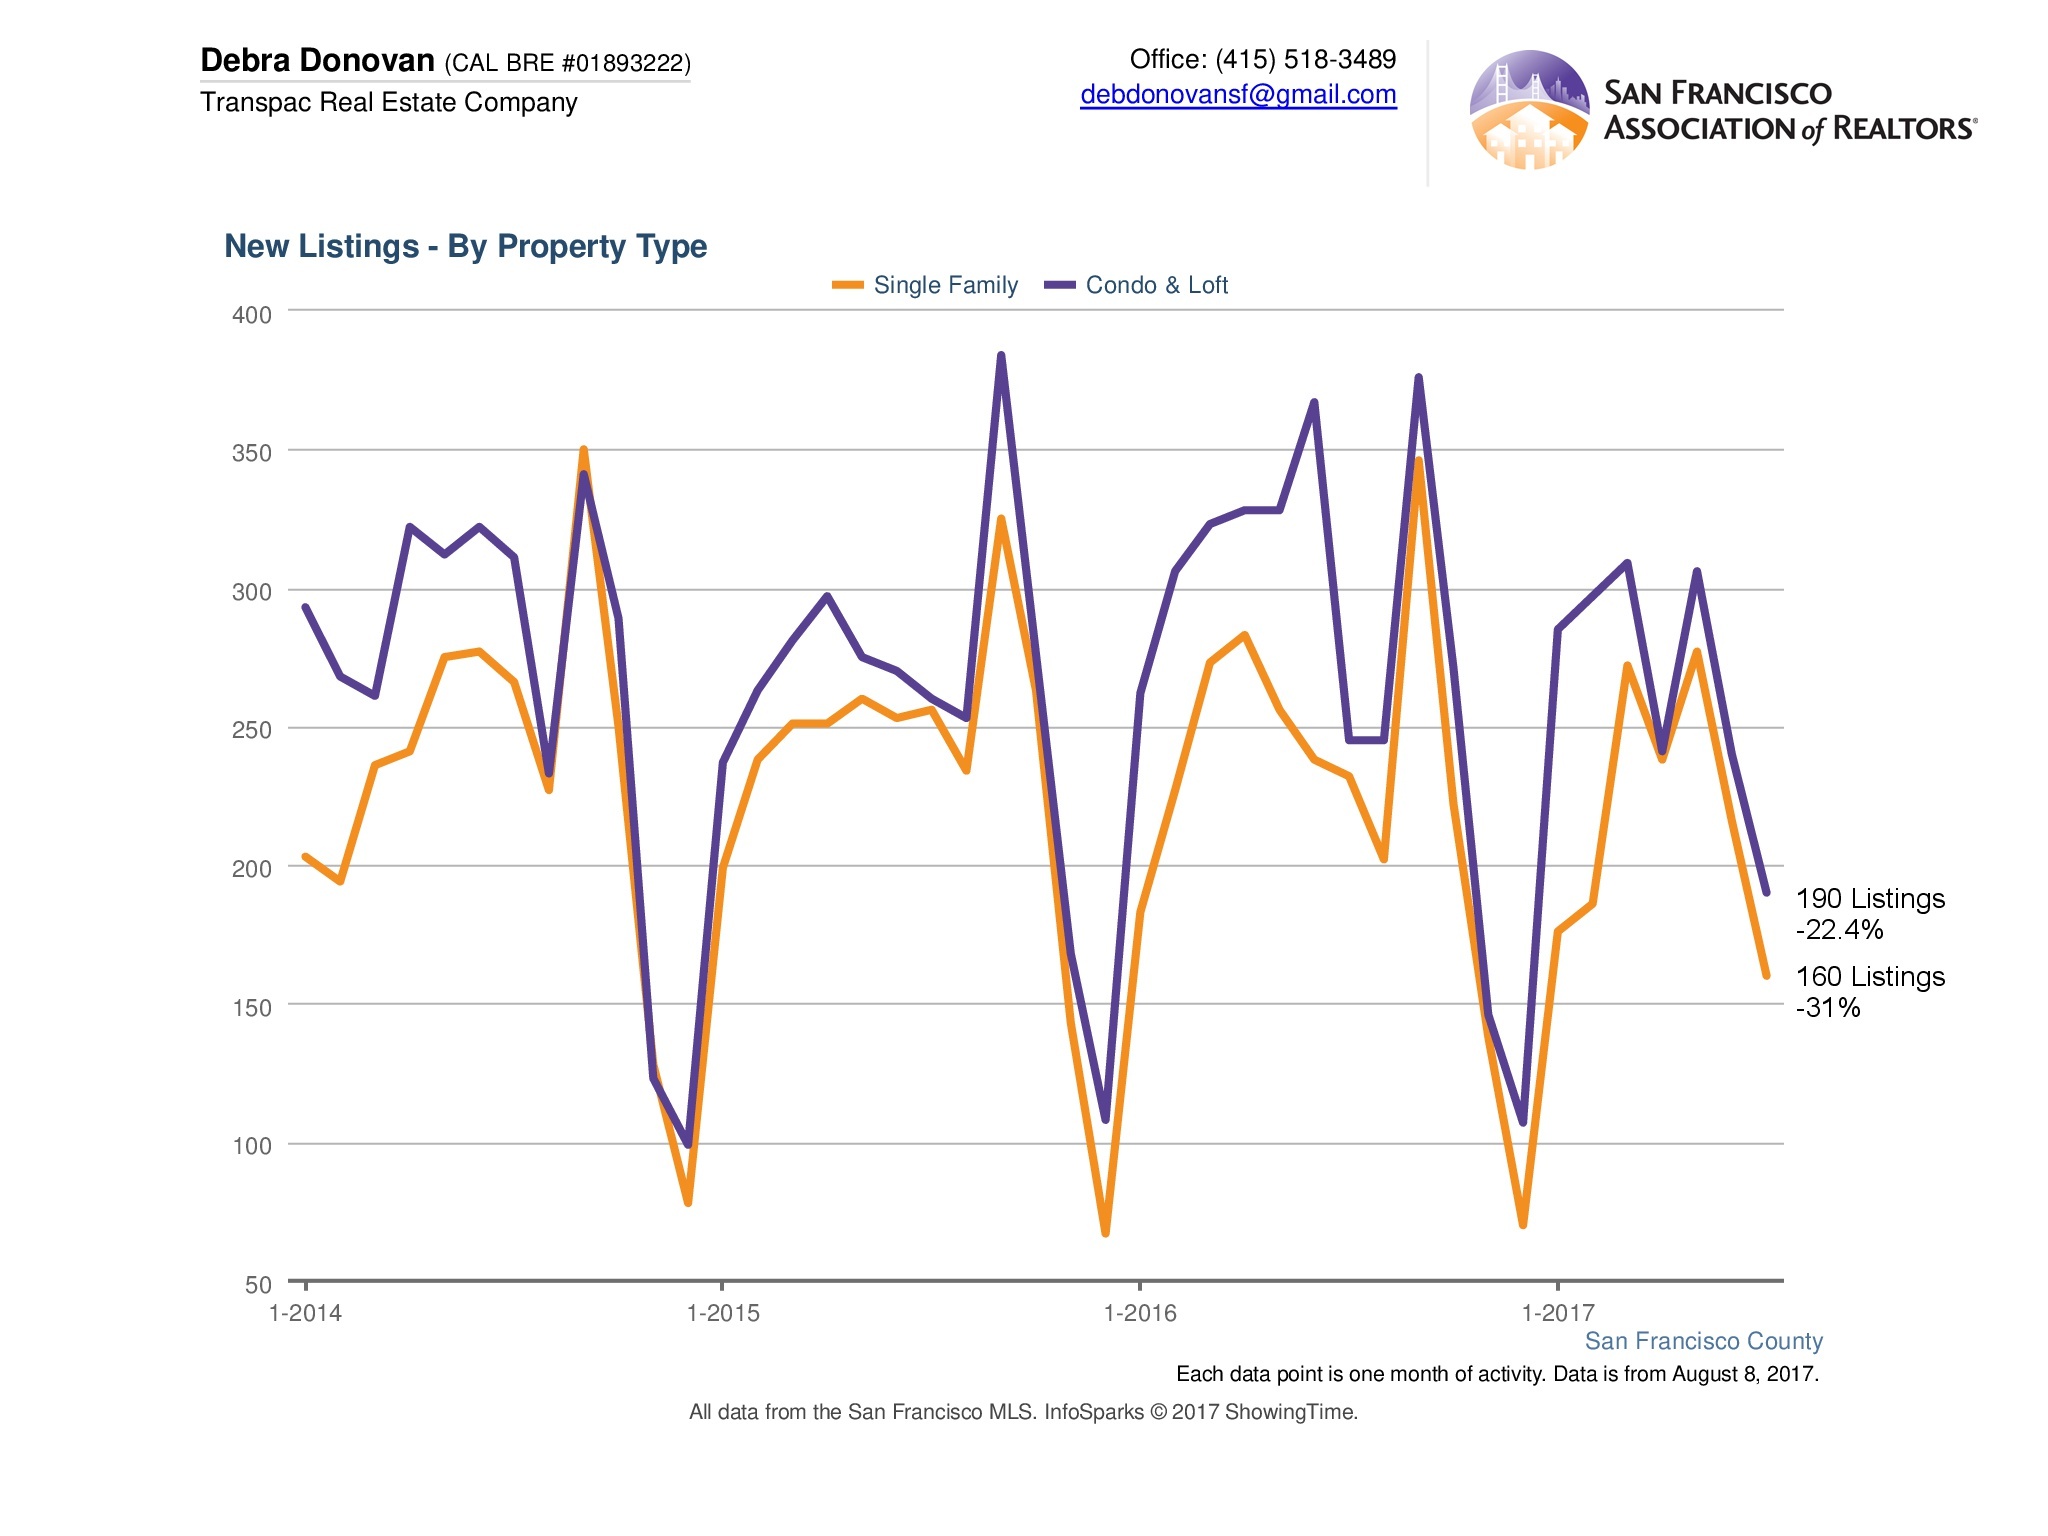
Only 351 new listings came on-market in July, of which 160 were single family homes and 191 were condos. If you’re shopping for a single family home, the districts with the most new listings were District 10 (45 homes), District 2 (27 homes), and District 4 (21 homes). If you’re in the market for a condo or loft you’ll have better odds in District 9 (84 condo/lofts), District 8 (31) or District 7 (21).
If you’re in the market to buy, take heart. July and August traditionally have lower inventory levels. Inventory should pick up in the Fall.
Other Market Statistics:
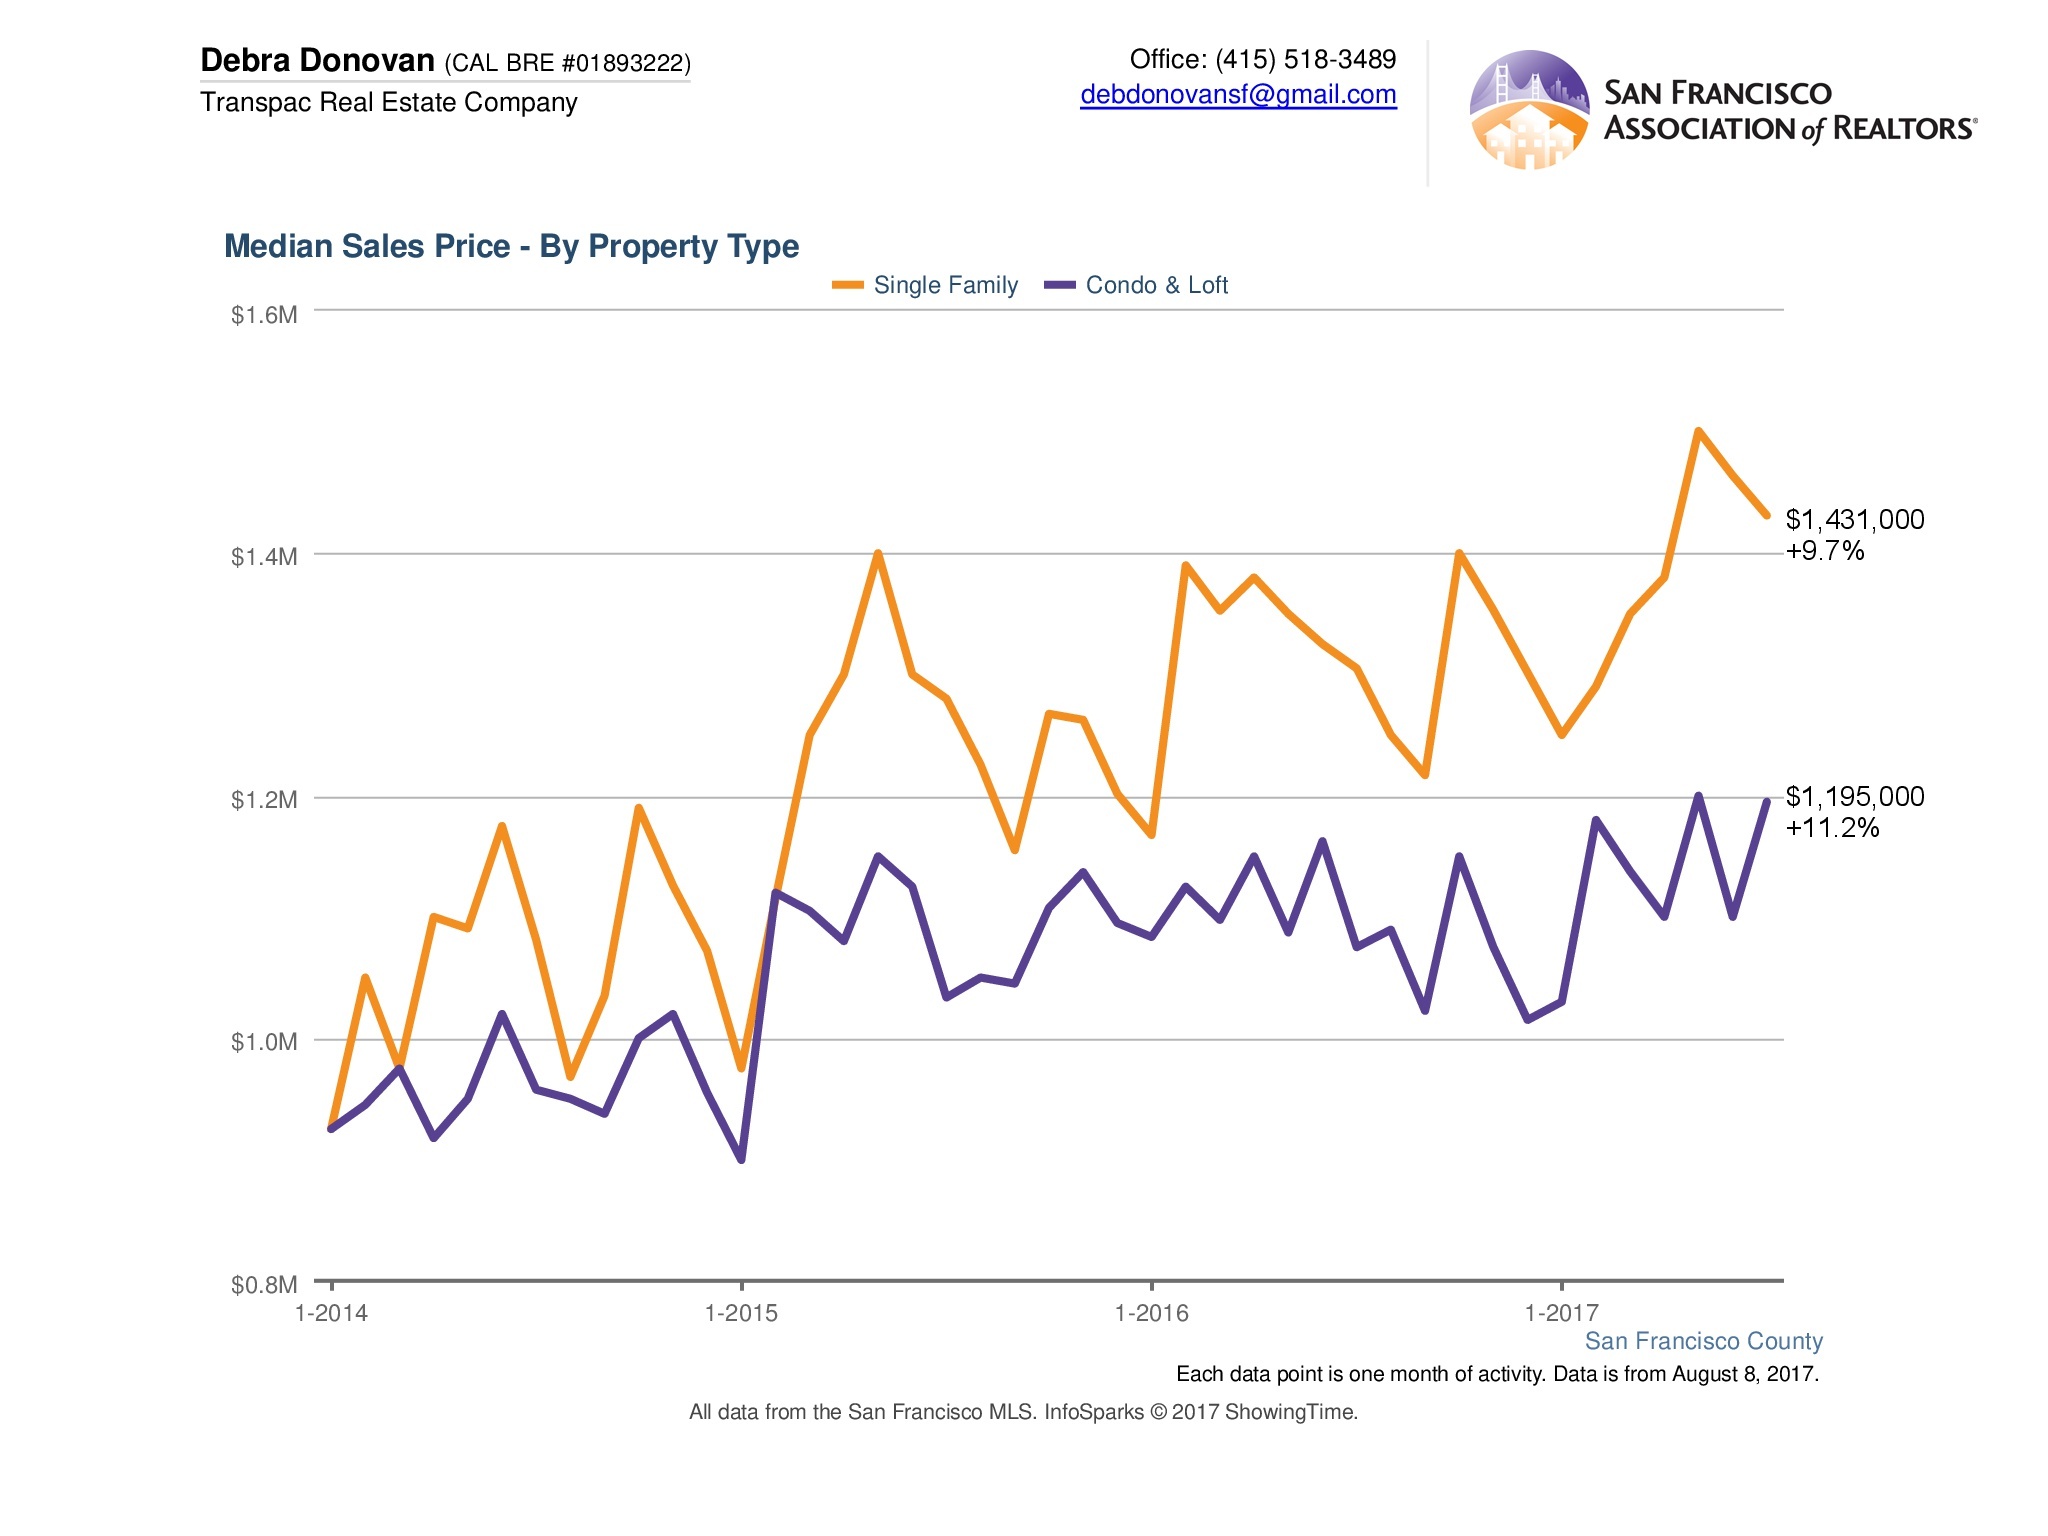
Median Sales Price
While the chart lines are not showing this properly for some reason, median home prices inched up slightly in July compared to June. They were also up when compared to July of last year.
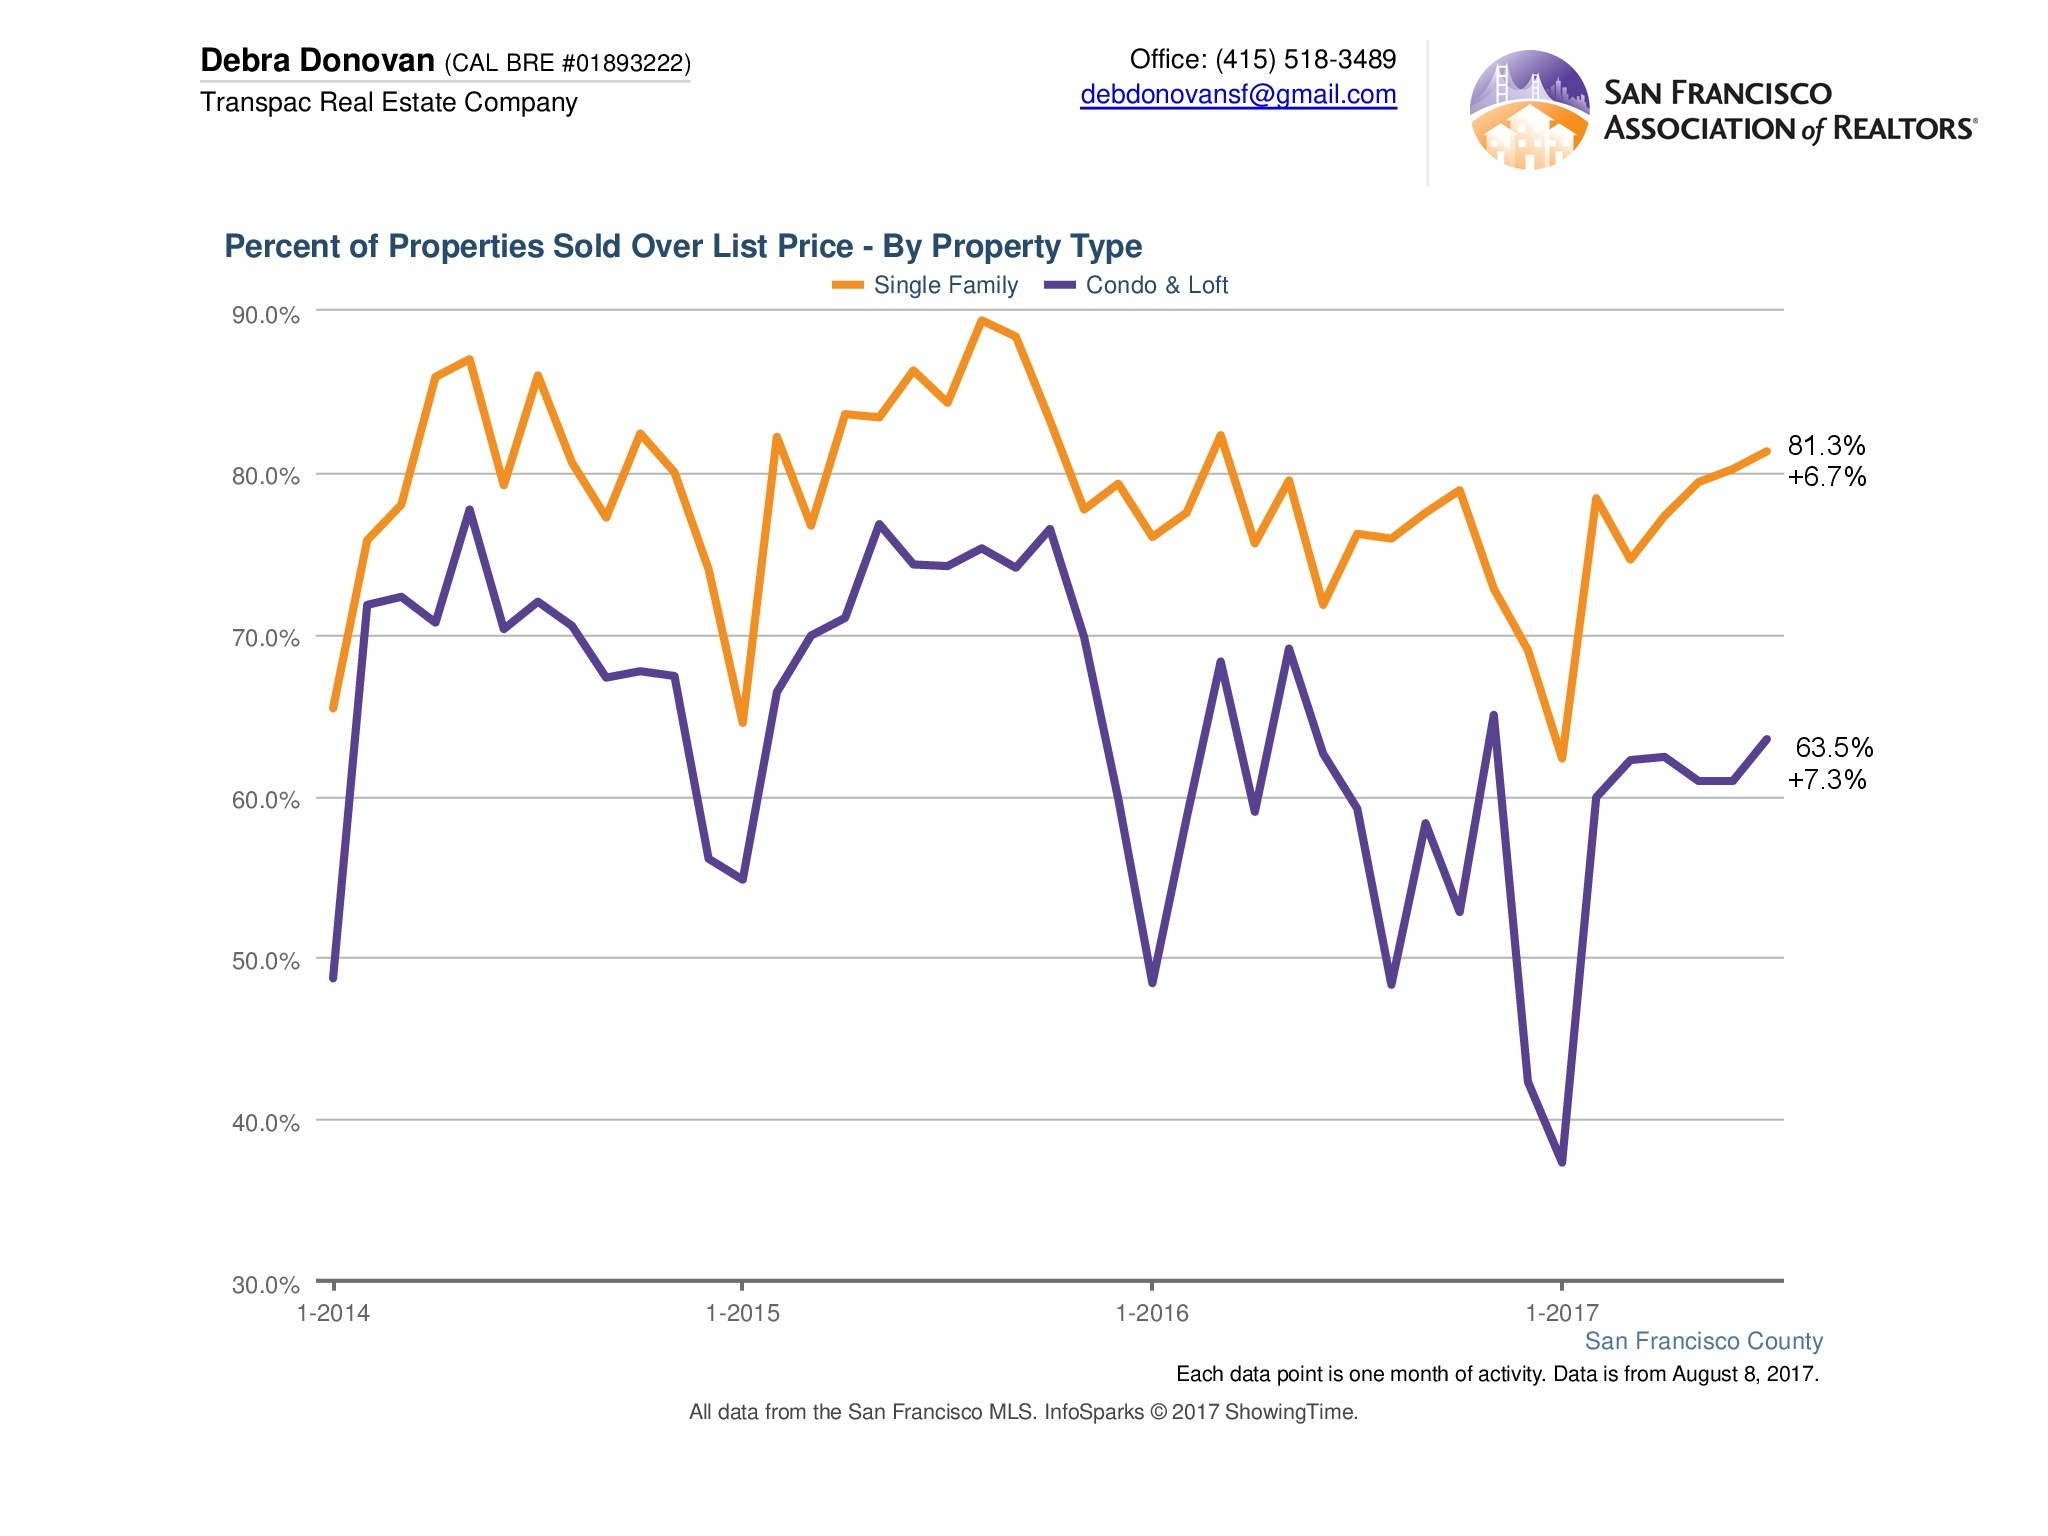
Percentage of Properties Selling Over List Price
The majority of homes sold are selling for over the property’s list price. About 80% of single family homes and 64% of condo/ lofts sold for over list price in July.
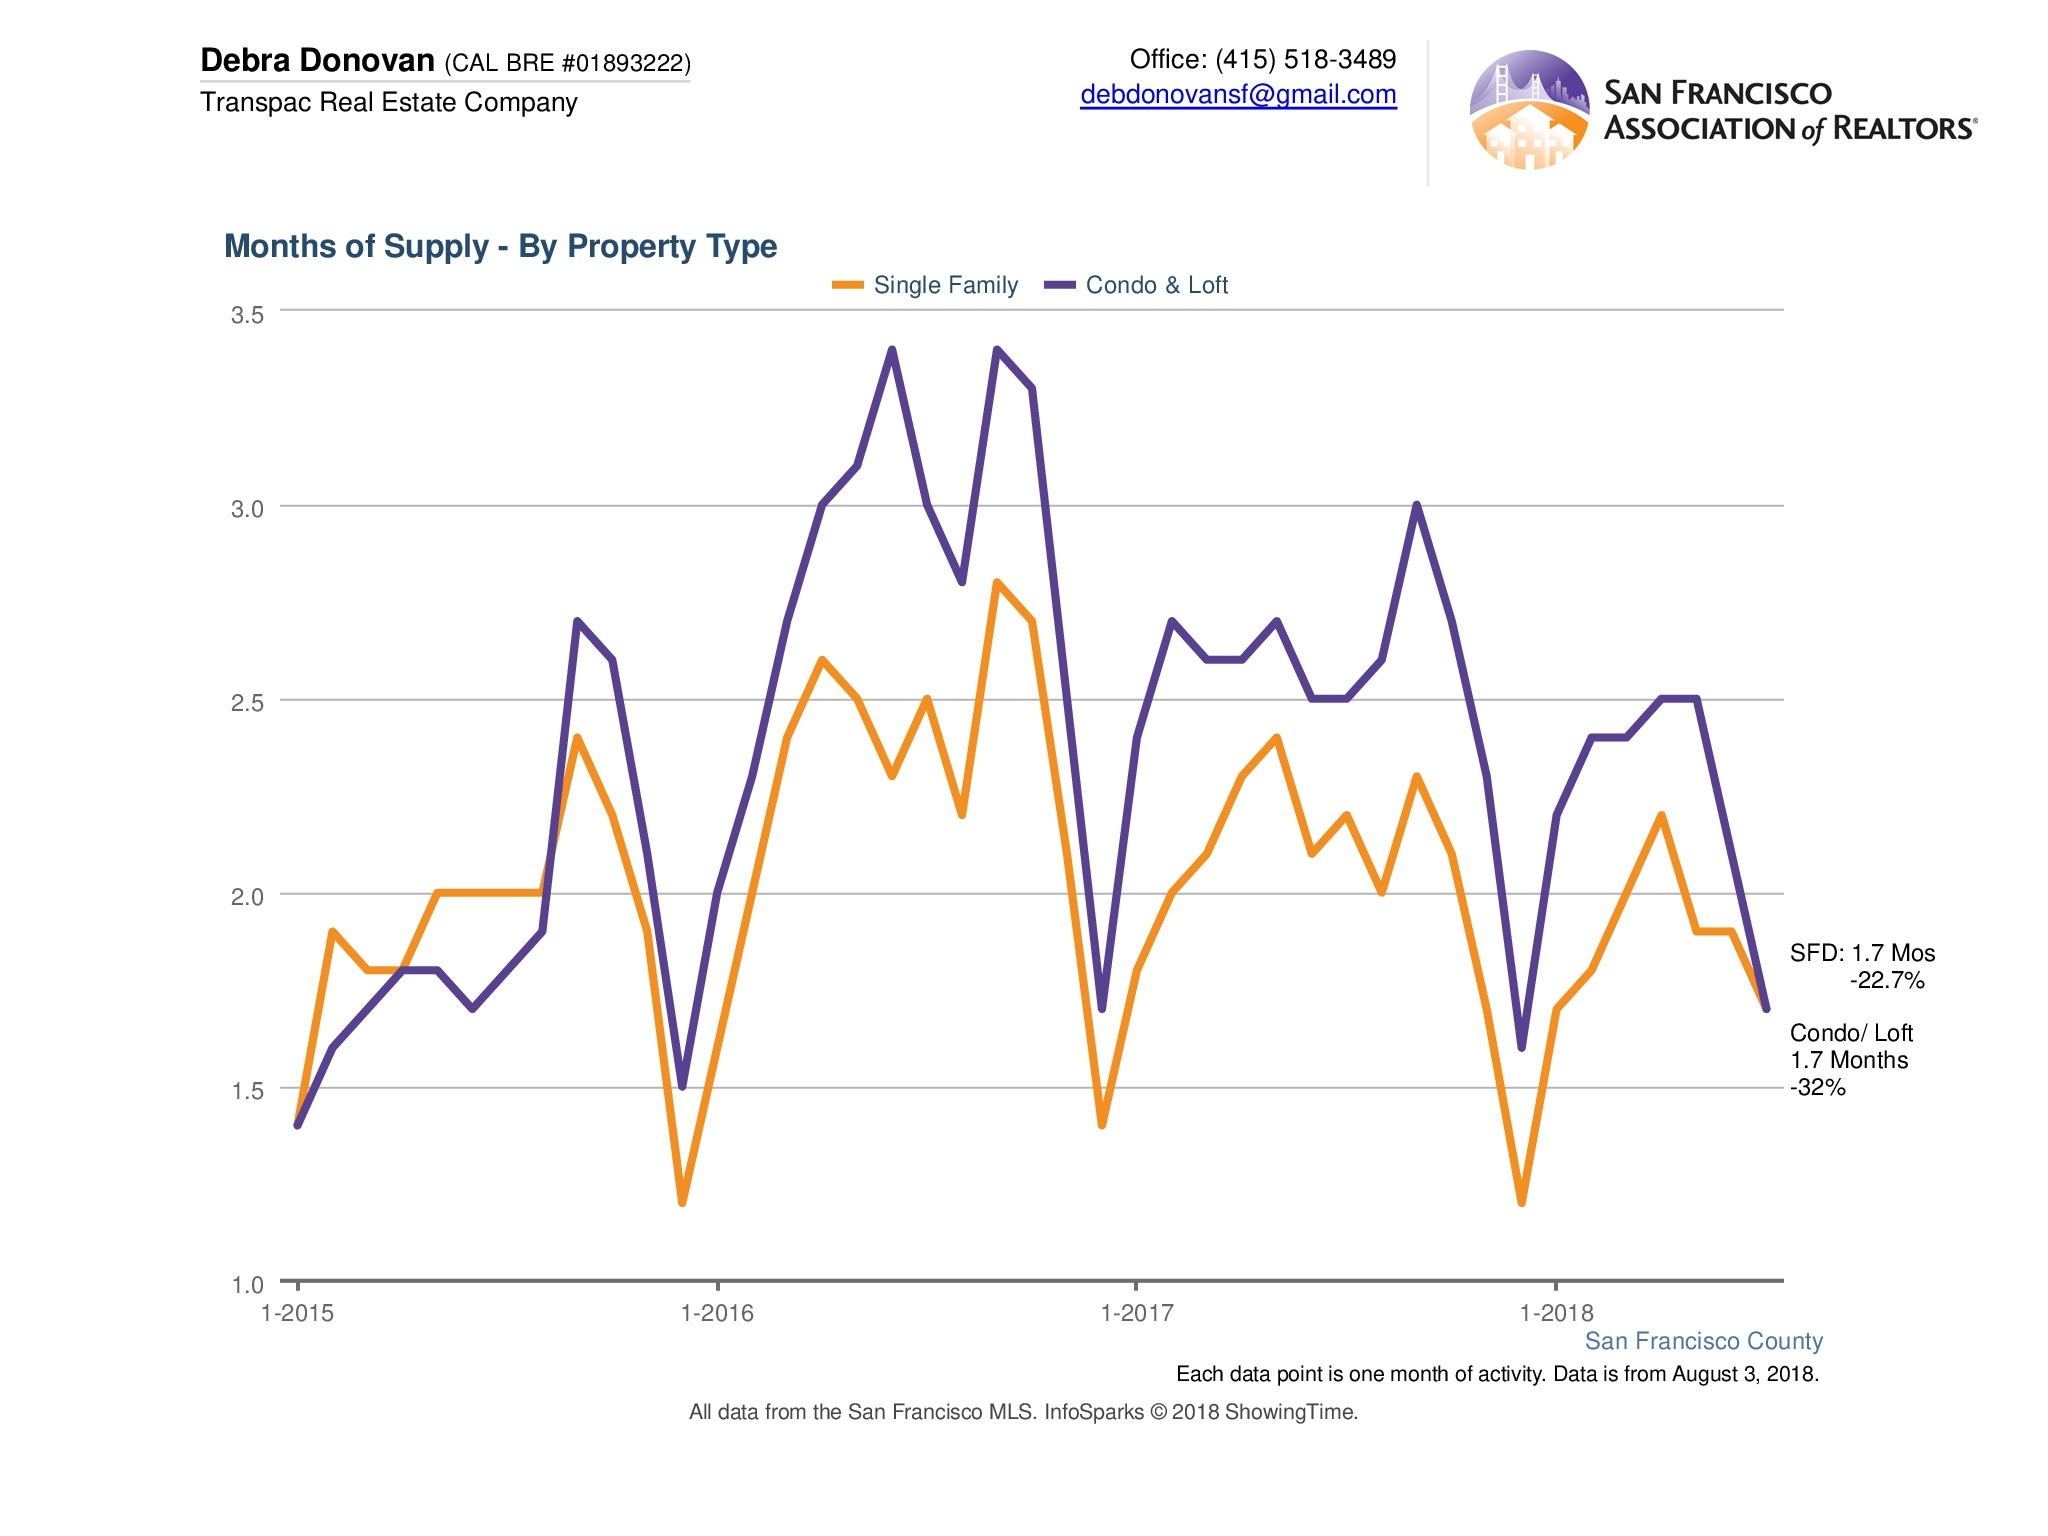
MSI (Month’s Supply of Inventory
Not surprisingly MSI, which is essentially the absorption rate of properties on the market, ticked down slightly when compared to last month and was down significantly when compared to July 2016.
The fine print: All information deemed reliable but not guaranteed or warranted. Data comes from MLS so does not include off-market and most new construction condo sales. The San Francisco real estate market is dynamic so statistics can change on a daily basis. These statistics are meant to be a snapshot of the day and time they were pulled.
Photo courtesy of Kaddi Sudhi