San Francisco Real Estate Market Update for May 2017

BOING!!
Just when you thought it couldn’t go any higher…
After a rather slow-moving first quarter, in May the median price for a single family home in San Francisco jumped to over $1,500,000, more than $100,000 over April and up 11% over the median price in May 2016. Further, condo and loft prices popped up to $1.2 million, also $100,000 more than the previous month.
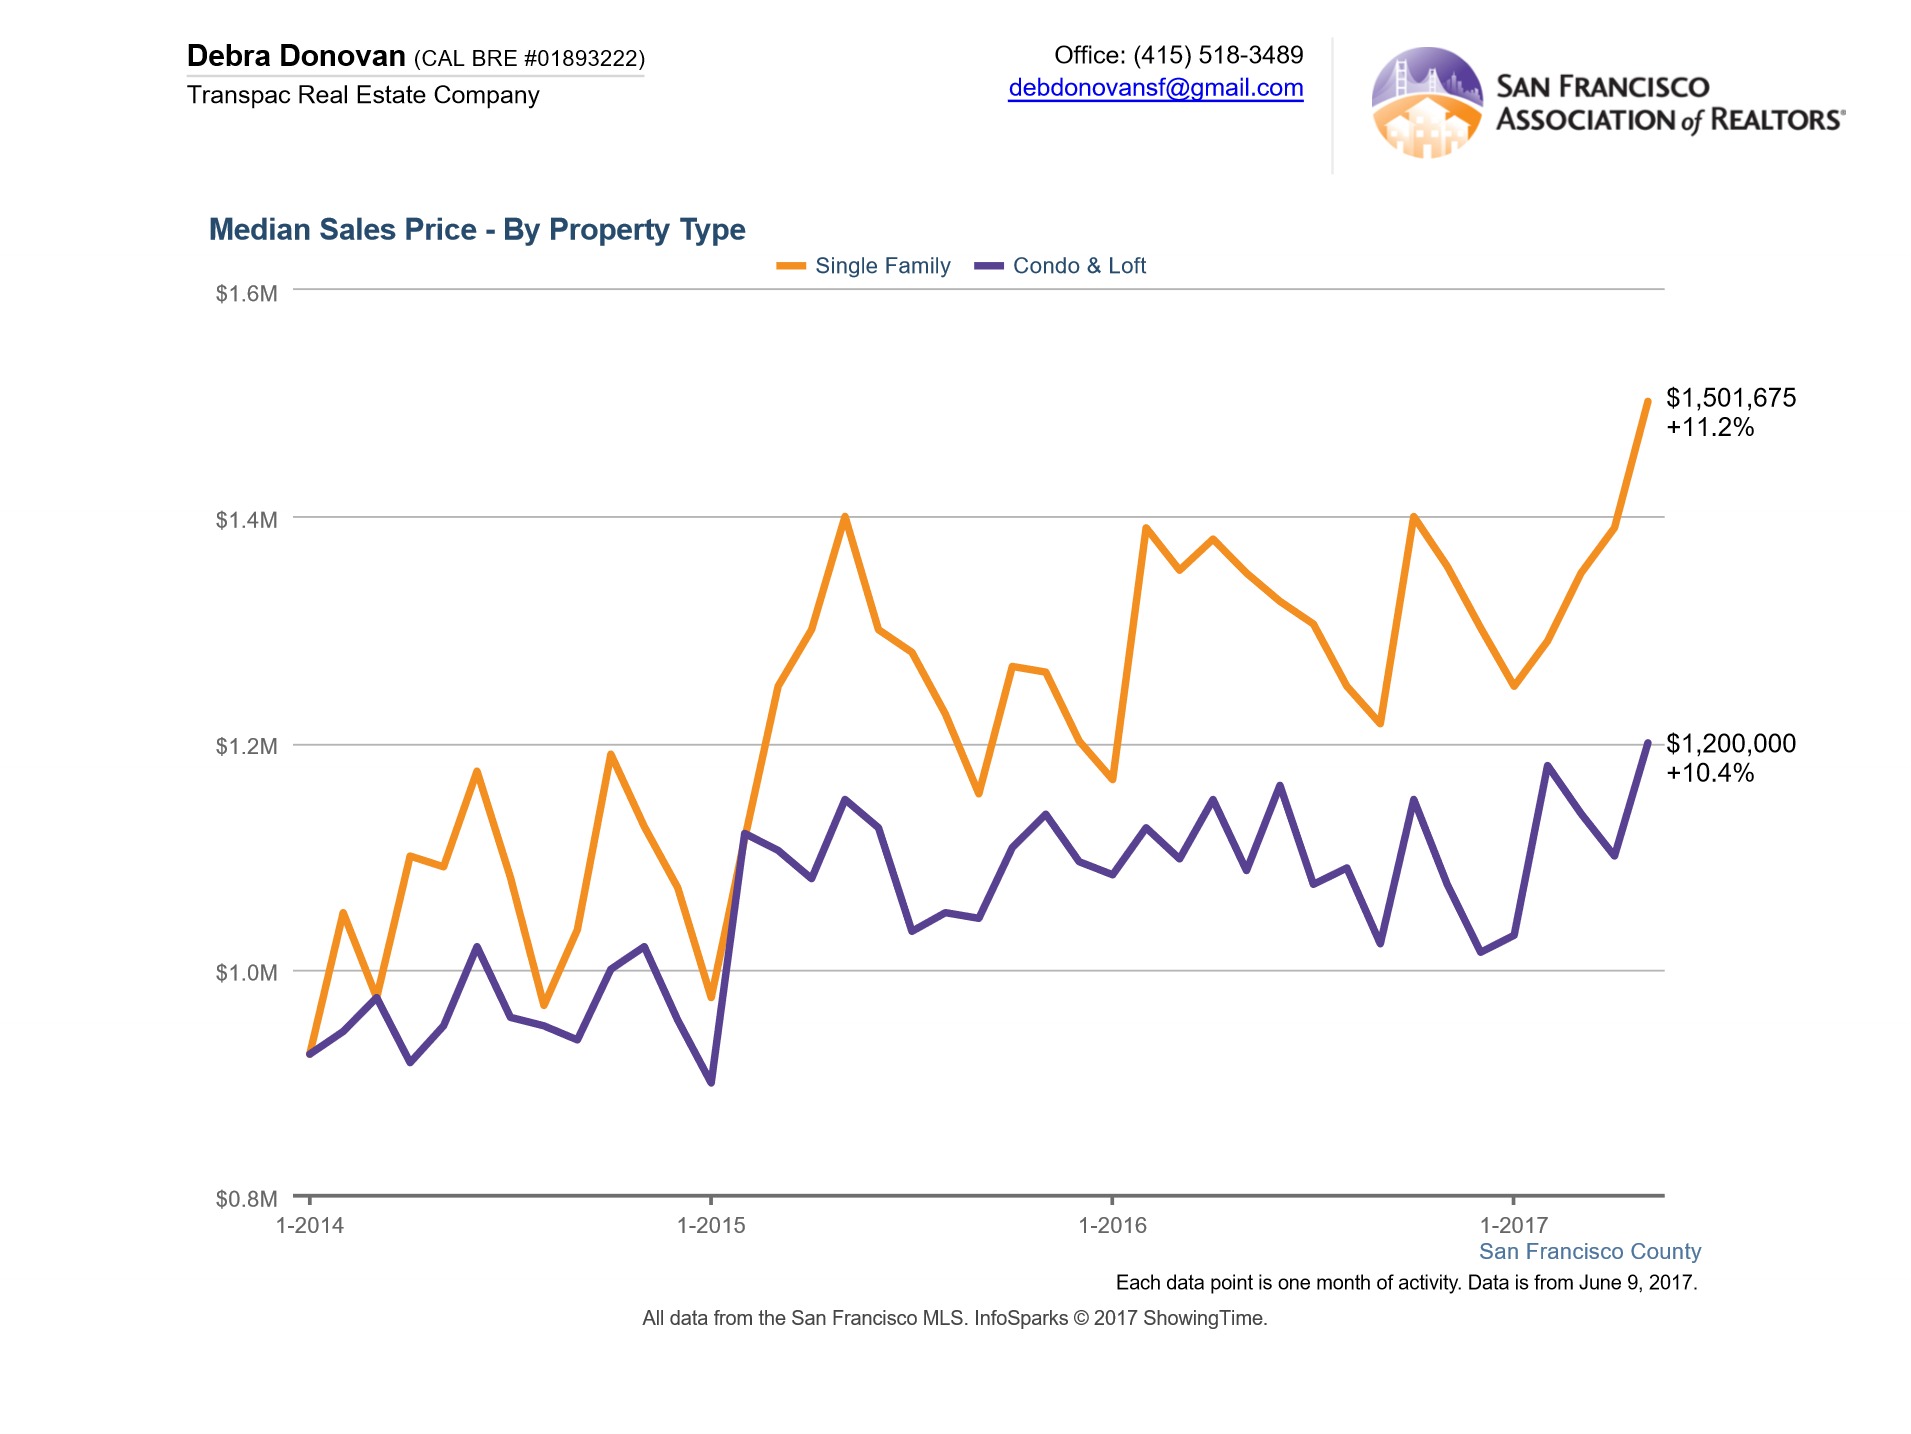
Now it can’t be overstated enough that a month of data does not make a trend. It’s much more valuable, and statistically sound, to view data over a longer period of time in order to get an understanding of where the market may be heading. Still, many of us were surprised that after what looked like a settling down of the market, buyers seemed to rally yet again. It will be interesting to see what the next month or two brings, given that the market here typically slows in summer.
But no jump in inventory…
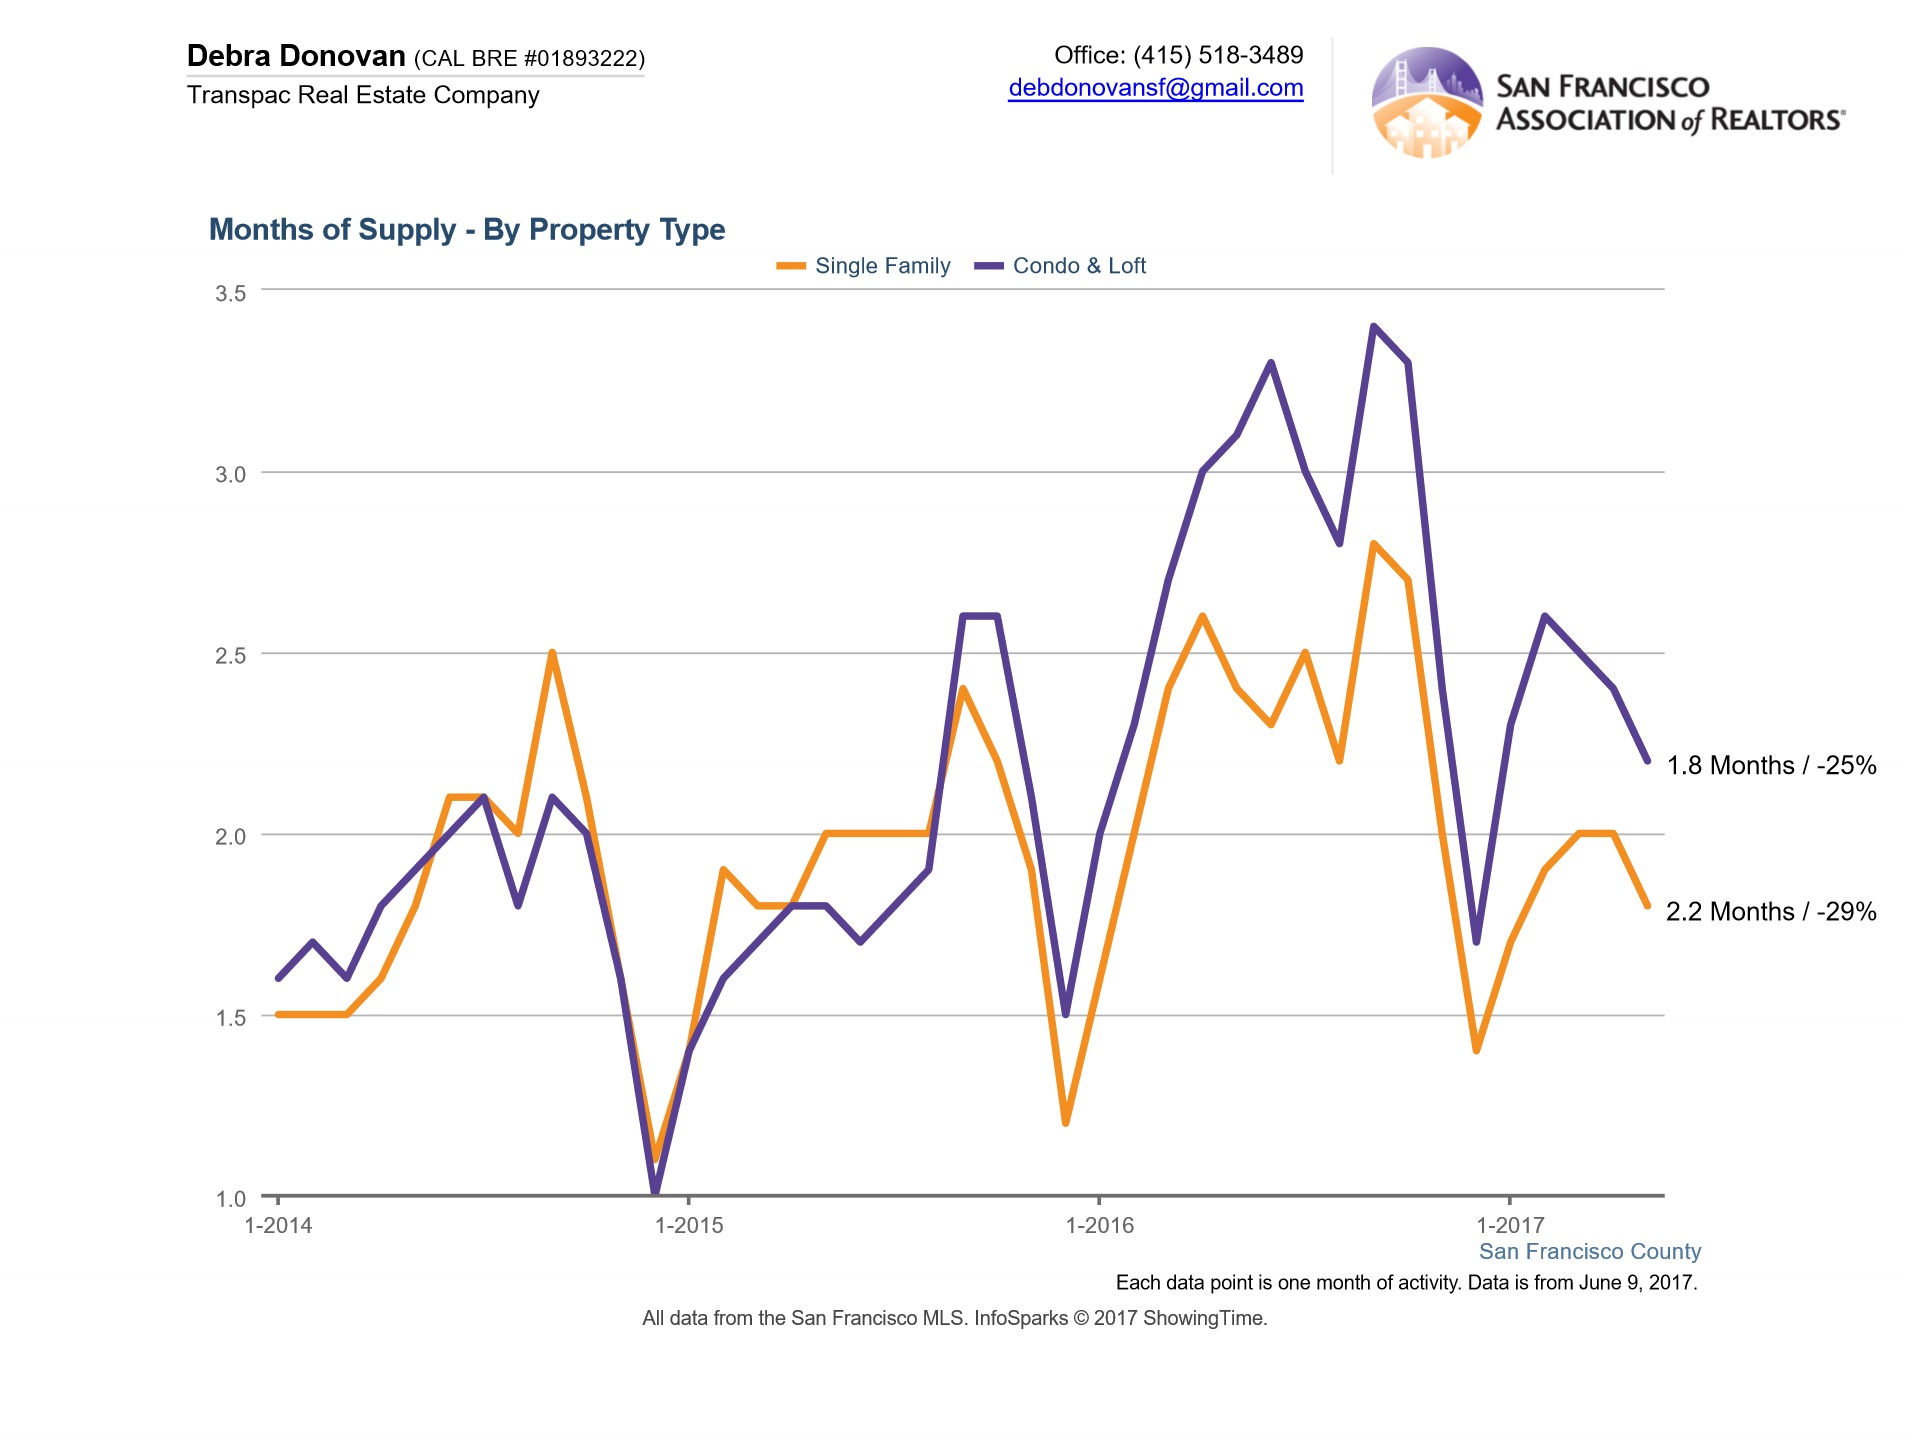
As home pricing went up, months supply of inventory went down. Not surprising in a competitive market such as this one. (Months Supply of Inventory, or MSI, is a measurement of how much time it would take for all of the inventory currently on the market to sell, based on the briskness of sales). In May, MSI decreased for both single family homes and condos/ lofts when compared to May of last year. At just under (for single family homes) and just over (for condos/ lofts) 2 months of inventory, May looked more like what we saw in typically inventory-challenged December and January. Once again we had very little inventory to start with that got snapped up very quickly. A lower MSI indicates a seller’s market, while a higher MSI connotes a buyer’s market.
Where they’re selling like hotcakes…
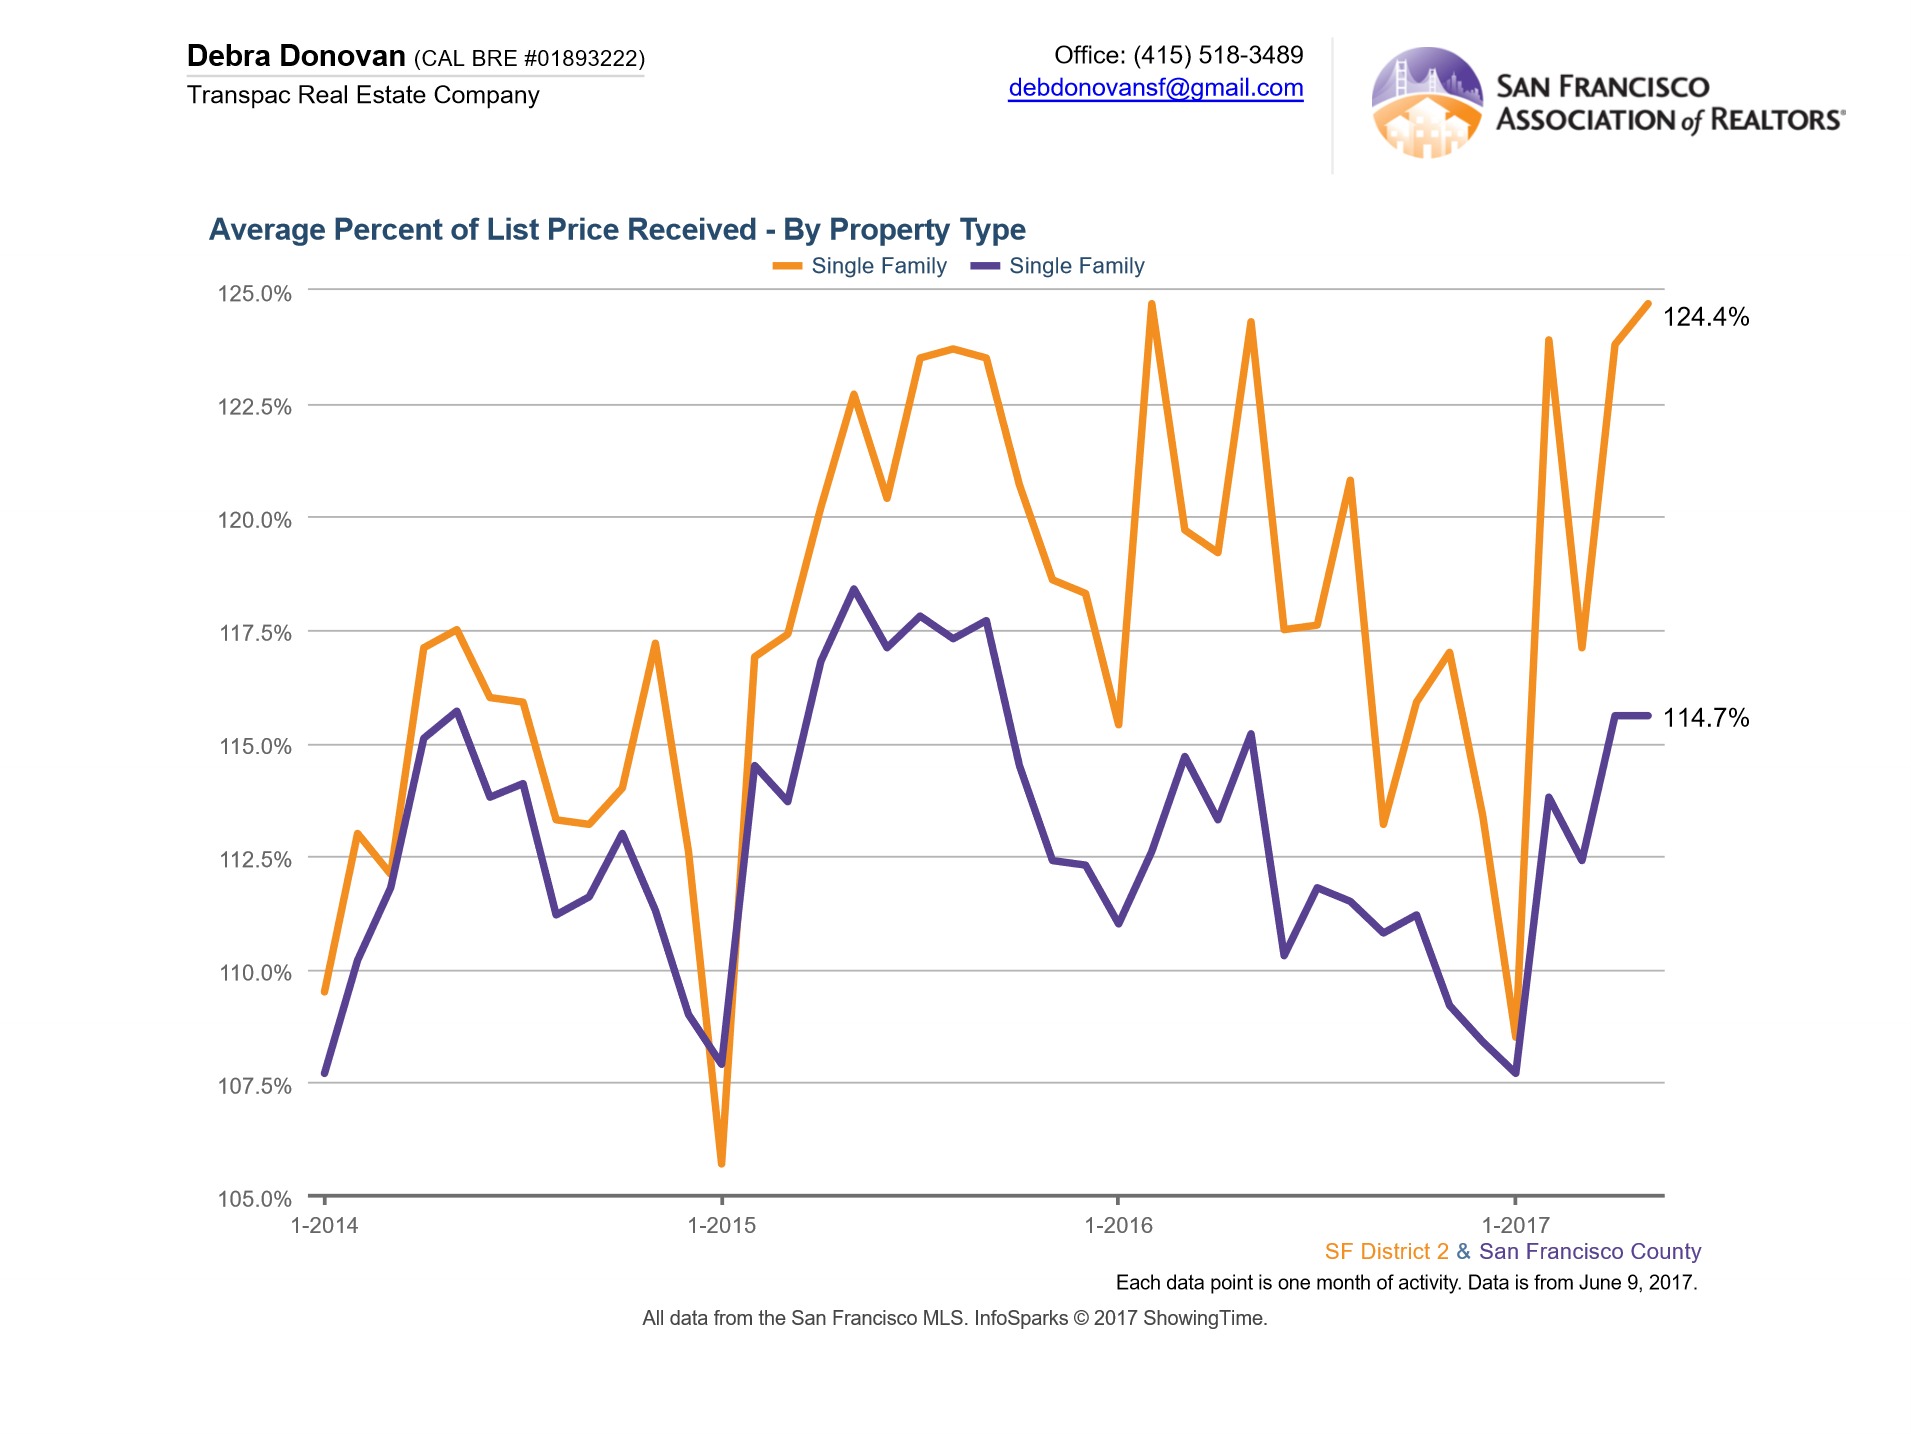
On average, San Francisco single family homes sold for almost 15% above asking price. But the winner for the area with the highest percentage of sold price vs. asking price was District 2 with an average sale price of almost 25% over asking. District 2 includes the Sunset, Parkside, and Golden Gate Heights. In May, there were 42 single family home sales in District 2. The area consists primarily of single family homes, and was second only to District 10 in total number of single family home sales for the month.
Condos and lofts, on the other hand, sold for 10% over list price on average city-wide. District 1, which includes the Richmond, Lake District, Sea Cliff, Lone Mountain, and Jordan Park/ Laurel Heights, showed the highest percentage of sold price over asking price with an average of over 16%. However there were only 9 condo/ loft sales in the district in May. Not surprisingly District 9, which consists of SoMA, Dogpatch, Yerba Buena, Mission Bay, Bernal Heights, and the Inner Mission, had the hightest number of condo/ loft sales, 62 sales, and saw an average of 6% over asking price.
May showed that the market is still hot, single family homes are hottest, and demand continues to outpace supply. We’ll keep an eye out to see how this trend fares through the summer.
The fine print: All information deemed reliable but not guaranteed or warranted. Data comes from MLS so does not include off-market and most new construction condo sales. The San Francisco real estate market is dynamic so statistics can change on a daily basis. These statistics are meant to be a snapshot of the time they were pulled.