San Francisco Real Estate Market Update – February 2019
January sales are typically among the lowest of the year. That is because in real estate, the data is the result of what the market looked like 30-45 days prior. So January sales reflect what was happening and on the market in late November and December. In these months, sales are slower as sellers hold off until after the holidays, particularly in the higher-priced luxury market, and many buyers take a break as well.
The good news is that so far February seems to be picking up. We’ve gotten more inventory on the market and judging from the open houses I’ve hosted as well as chats with other agents, buyers seem to be out in numbers again. The stock market has steadied in the new year, the government shutdown is over, and the Fed announced that they will not be raising rates again until at least mid-this year. Perhaps this is leading buyers to have more confidence in the market.
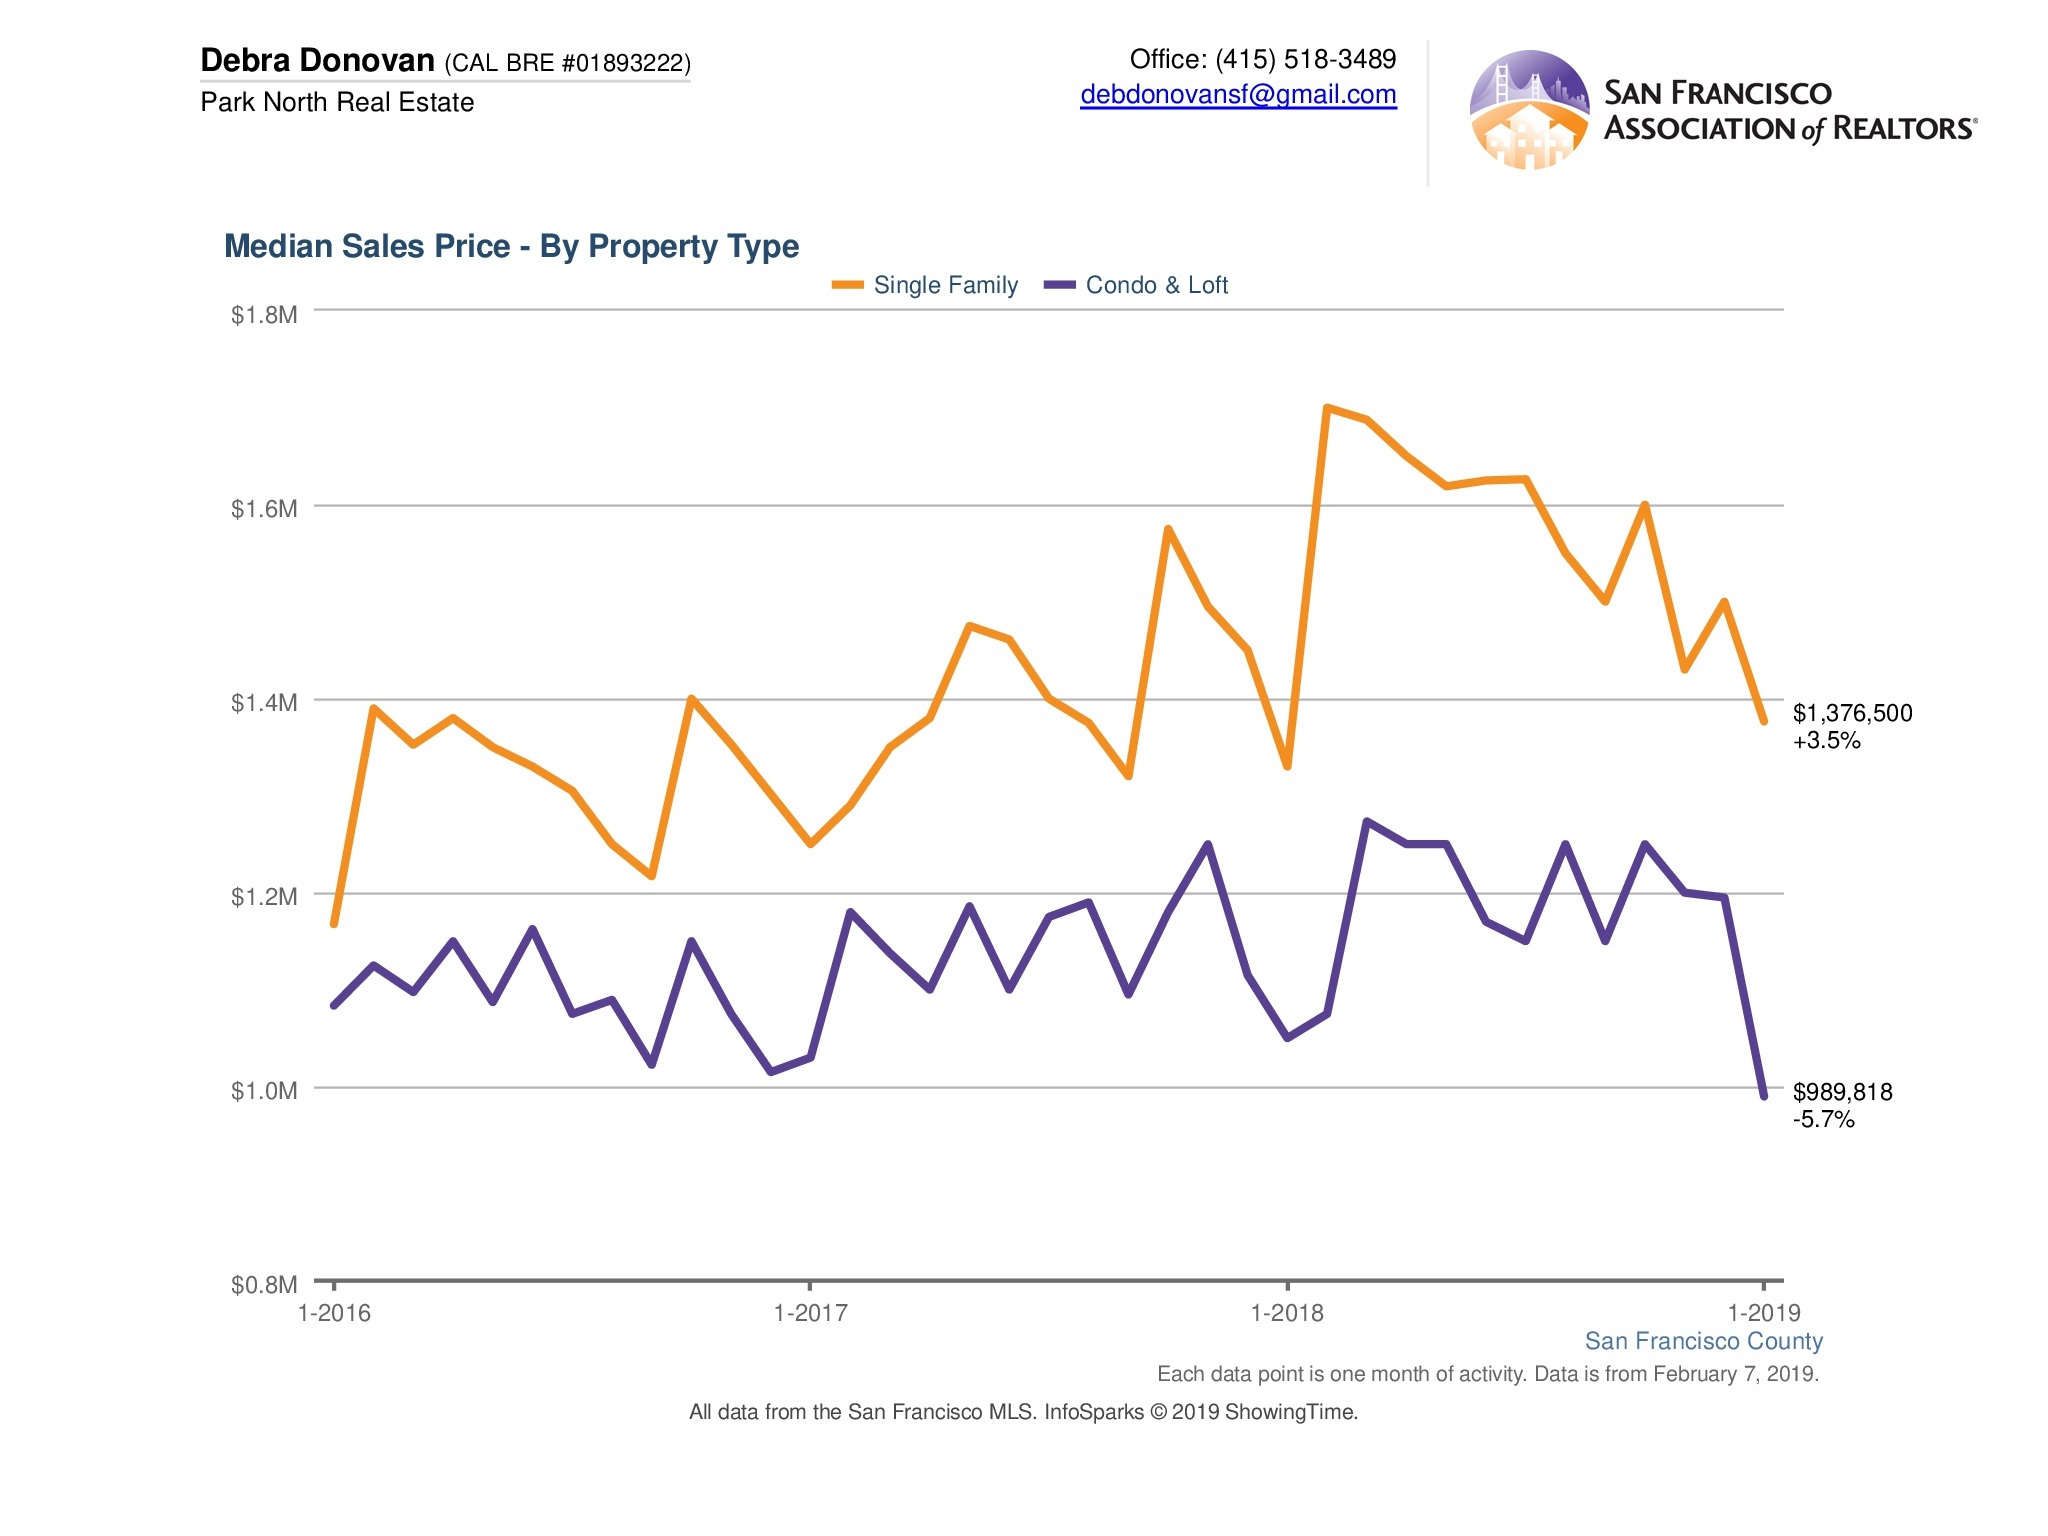
Median Sales Price:
Median sales price dipped in January. Single family home prices dropped to $1,376,599, which although down from the 4th quarter was still up compared to January of the previous year. Condos and lofts had a median sales price of $989,818, down 5.7% compared to the same month last year and the first time prices dipped under $1 million since January 2015.
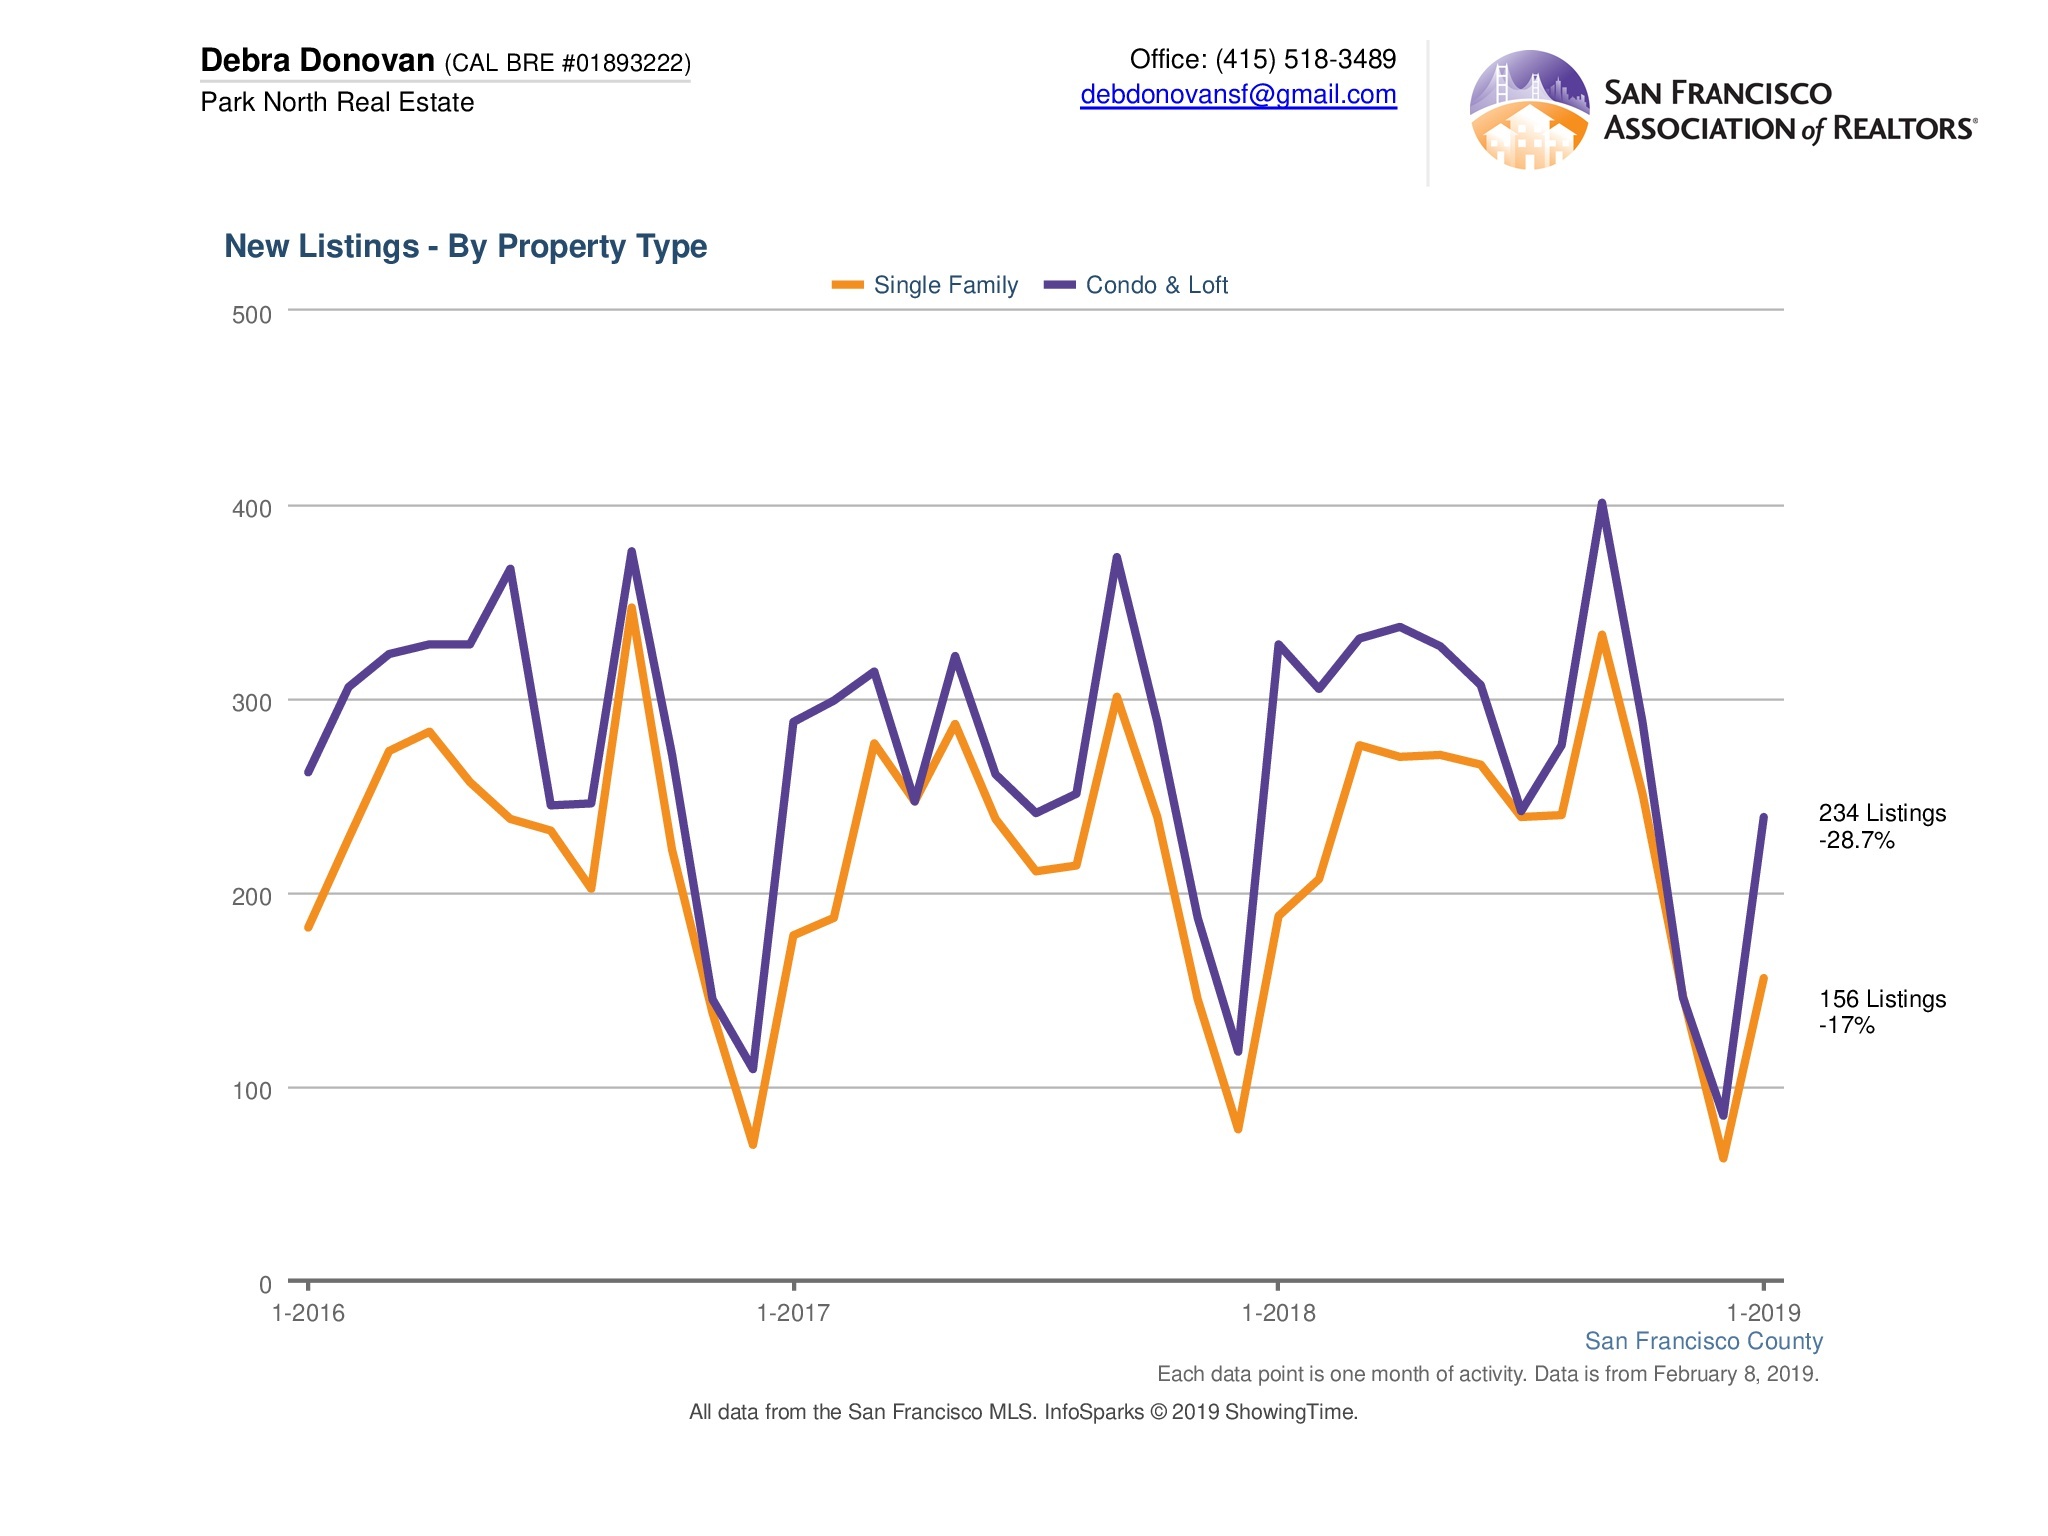
New Listings:
New listings were down significantly for both single family homes and condos and lofts. A paltry 156 single family homes came on the market in January, down 17% compared to last year. Condos and lofts were down almost 29% with only 234 new units coming on-market.
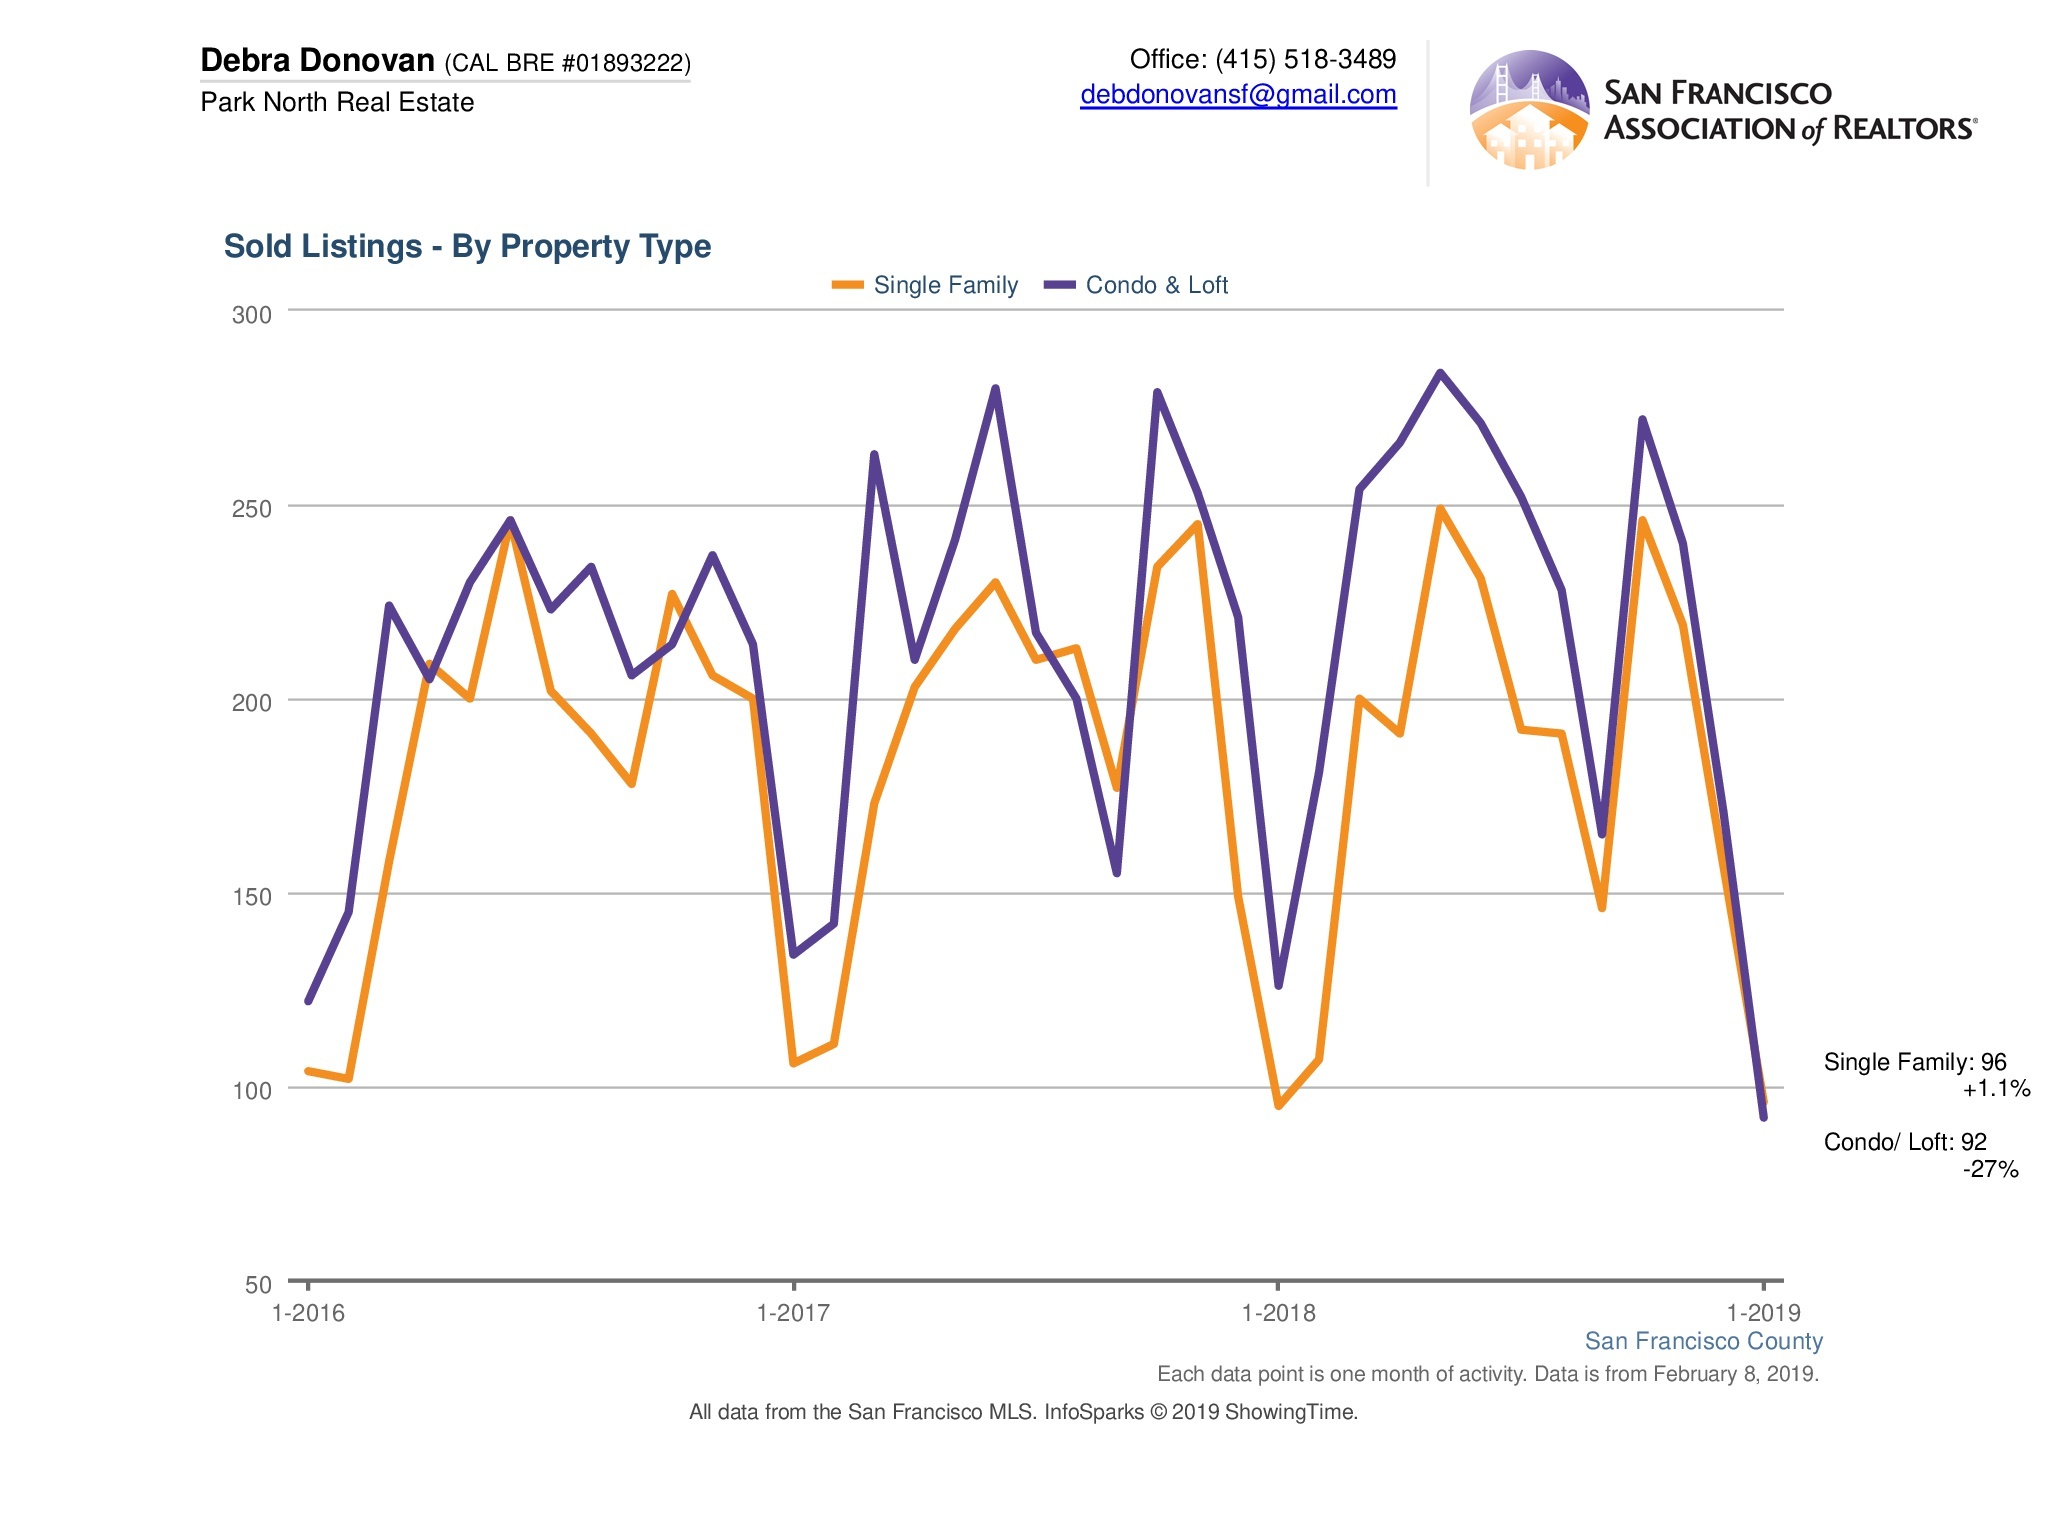
Sold Listings:
The number of single family homes that sold in January was mostly on par with the previous year. Condos and loft sales, however, were down significantly compared to the previous year. This may have been affected by new construction sales, which typically aren’t listed in the MLS and so don’t show up in these statistics.
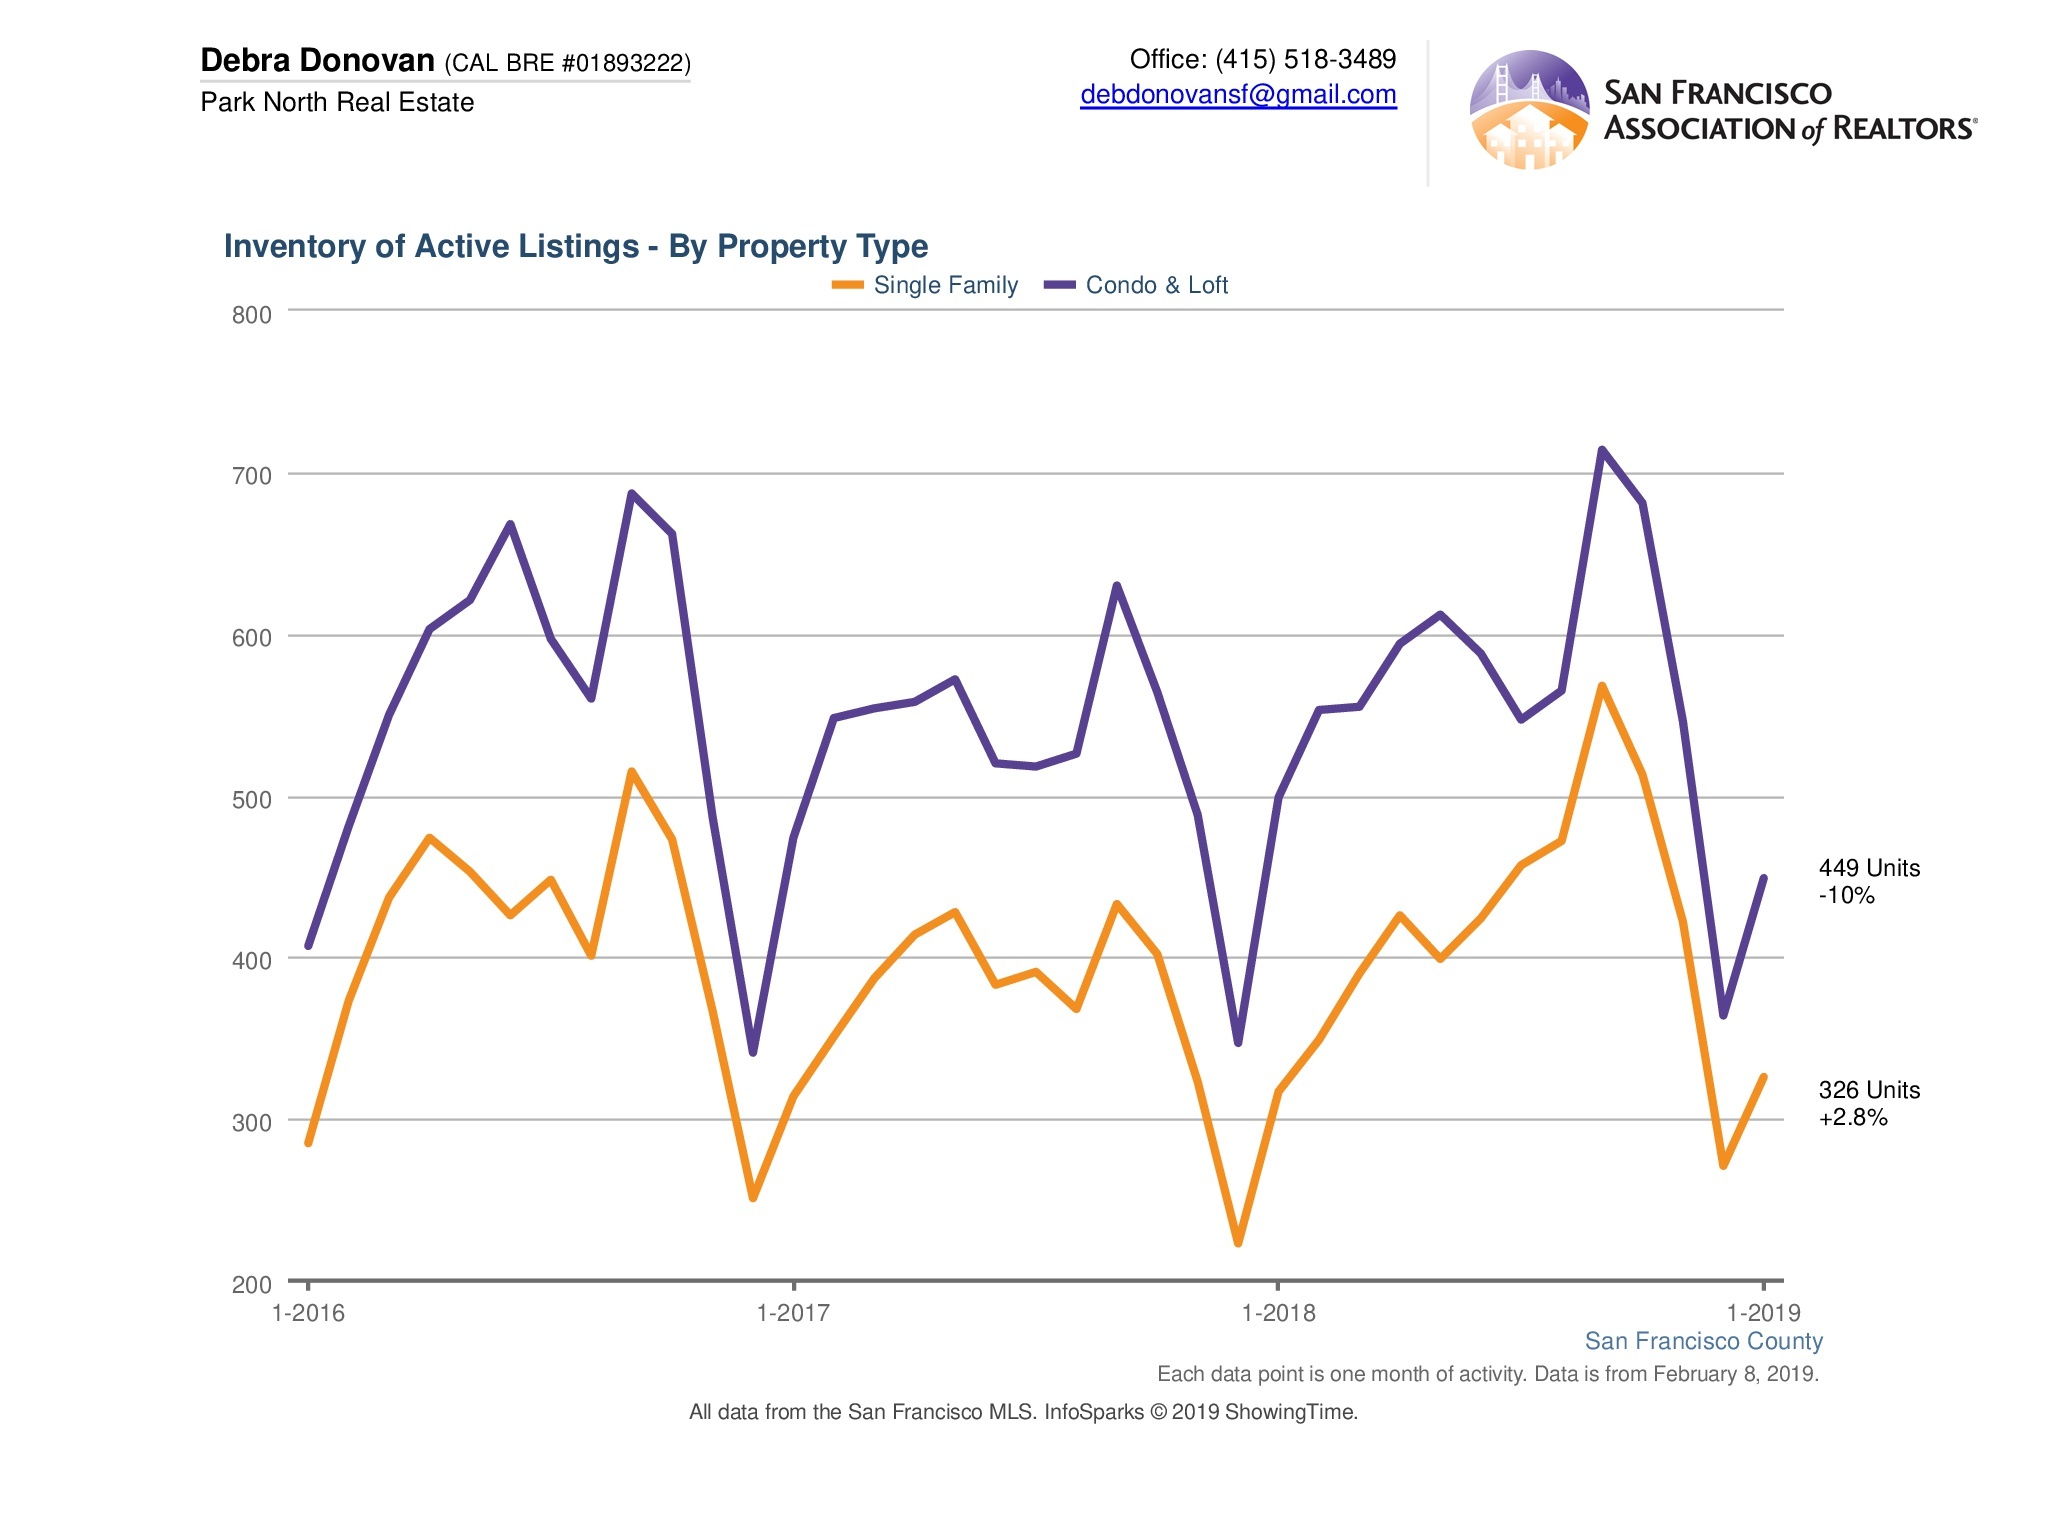
Active Listings:
Active listings, the number of listings available for sale at the end of the month, ticked up slightly for single family homes, but were down for condos and lofts. Both were an increase compared to December 2018, again showing properties staying on the market longer. This can also be seen from the Days on Market chart below.
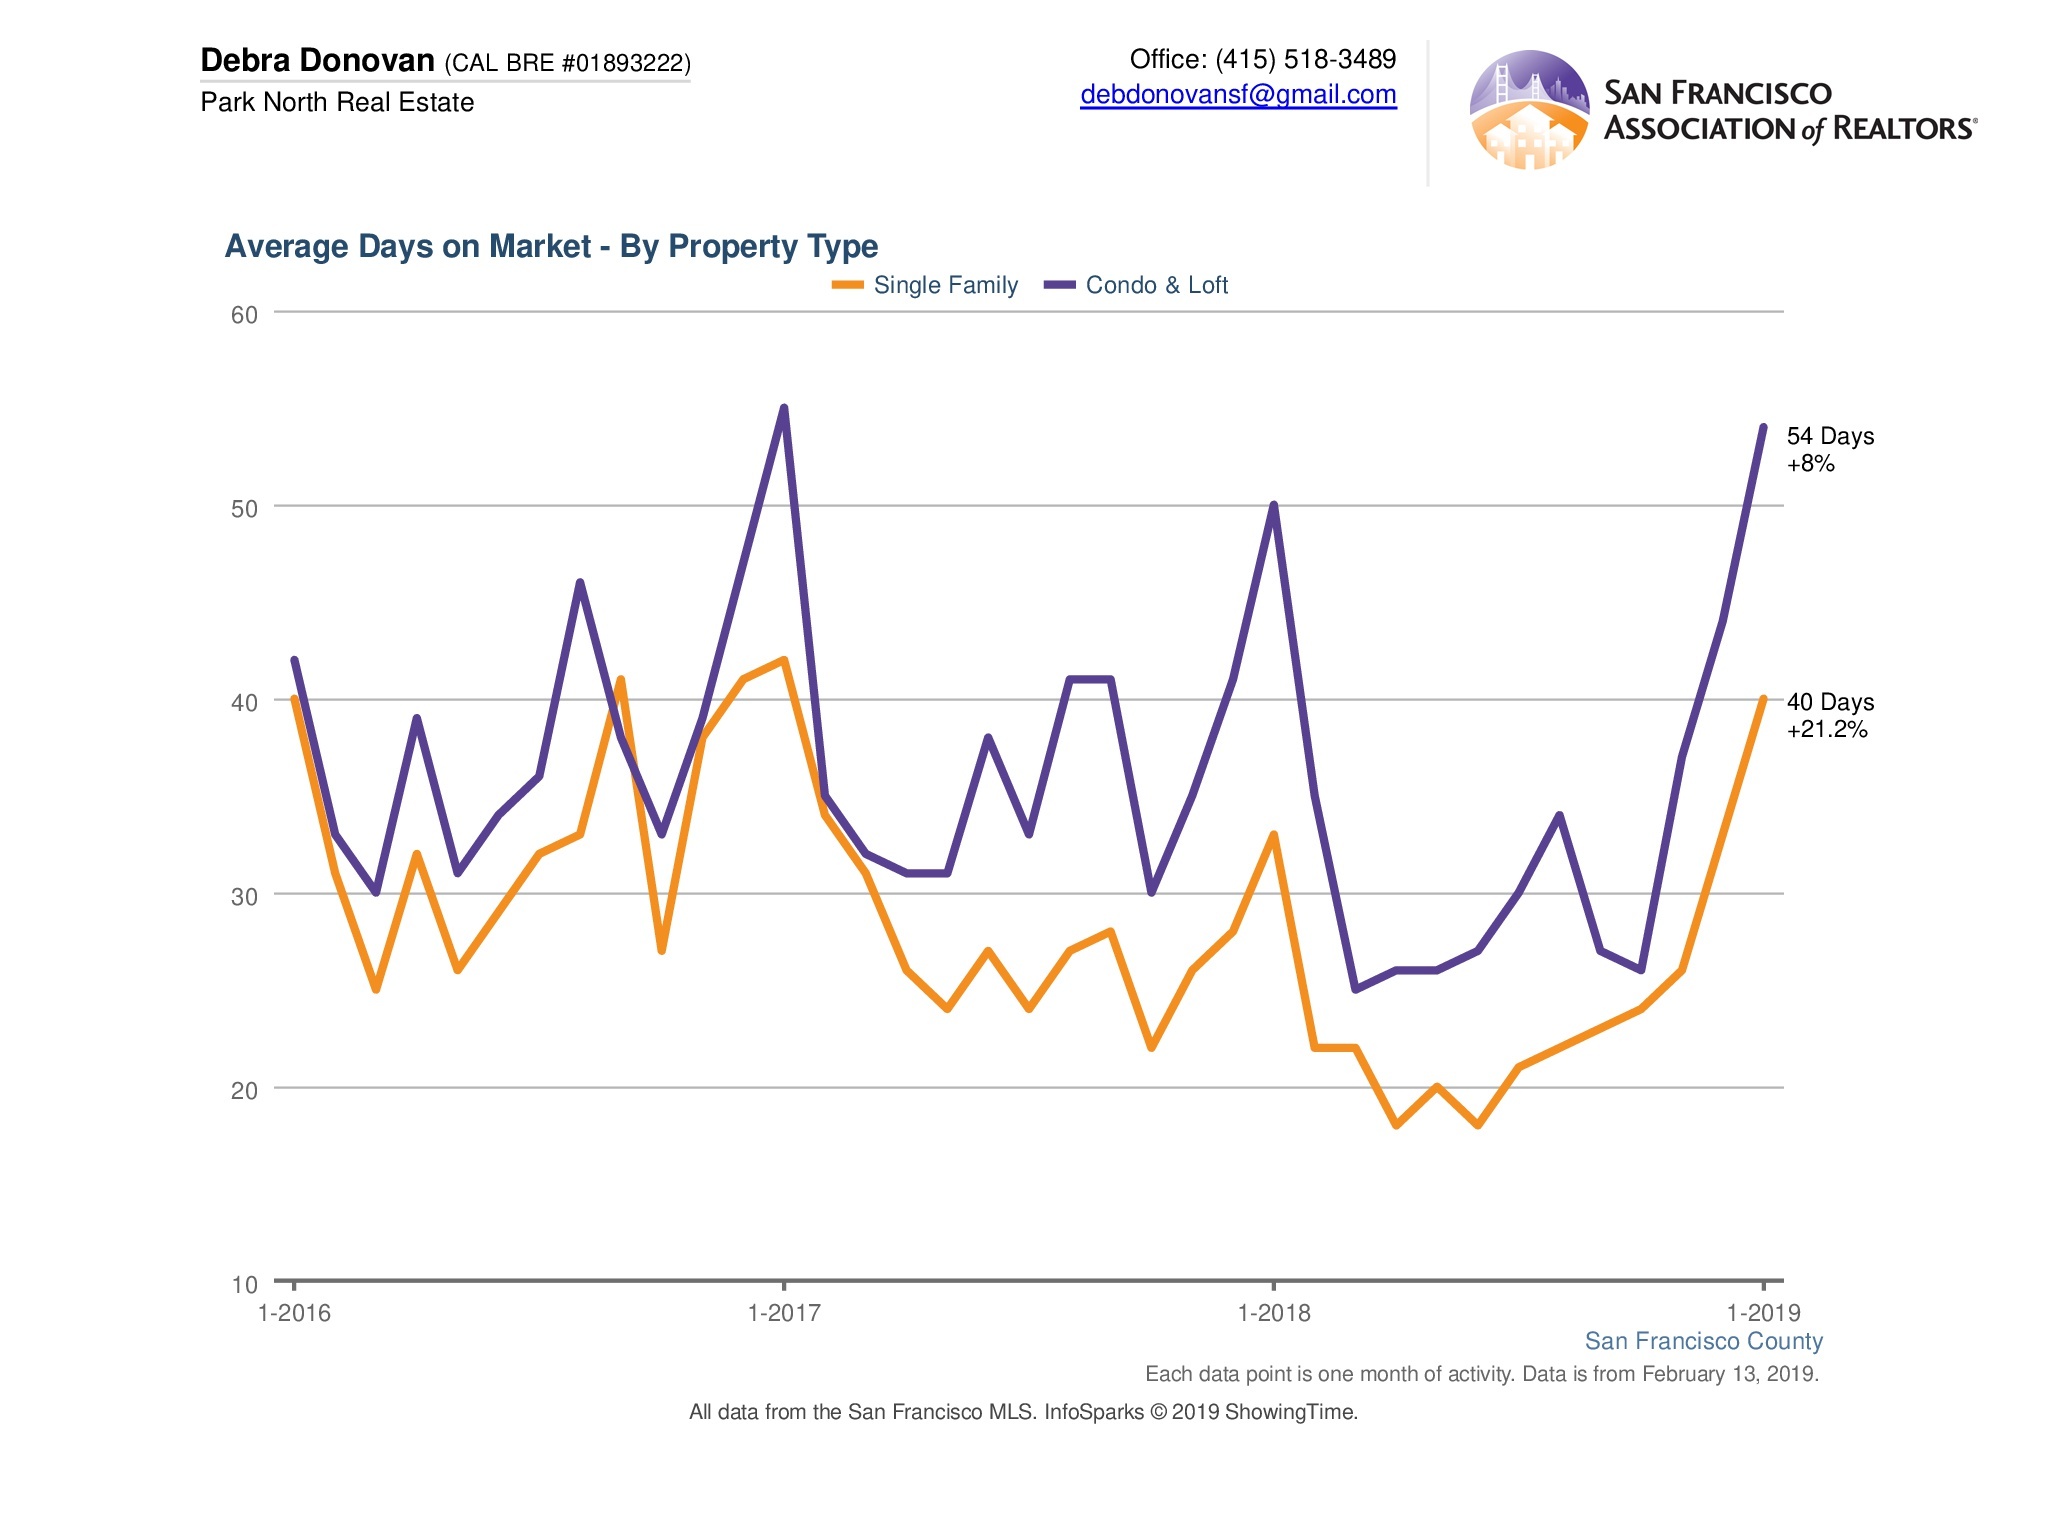
Days on Market:
As we’ve been seeing over the past 6 months, but especially at the end of last year, homes are selling but staying longer on the market before doing so. So not surprisingly, both single family homes and condo/ lofts languished longer on the market in January as it’s already a slow month. Single family home average days on market leaped to 40 days while condos and lofts averaged 54 days on the market.
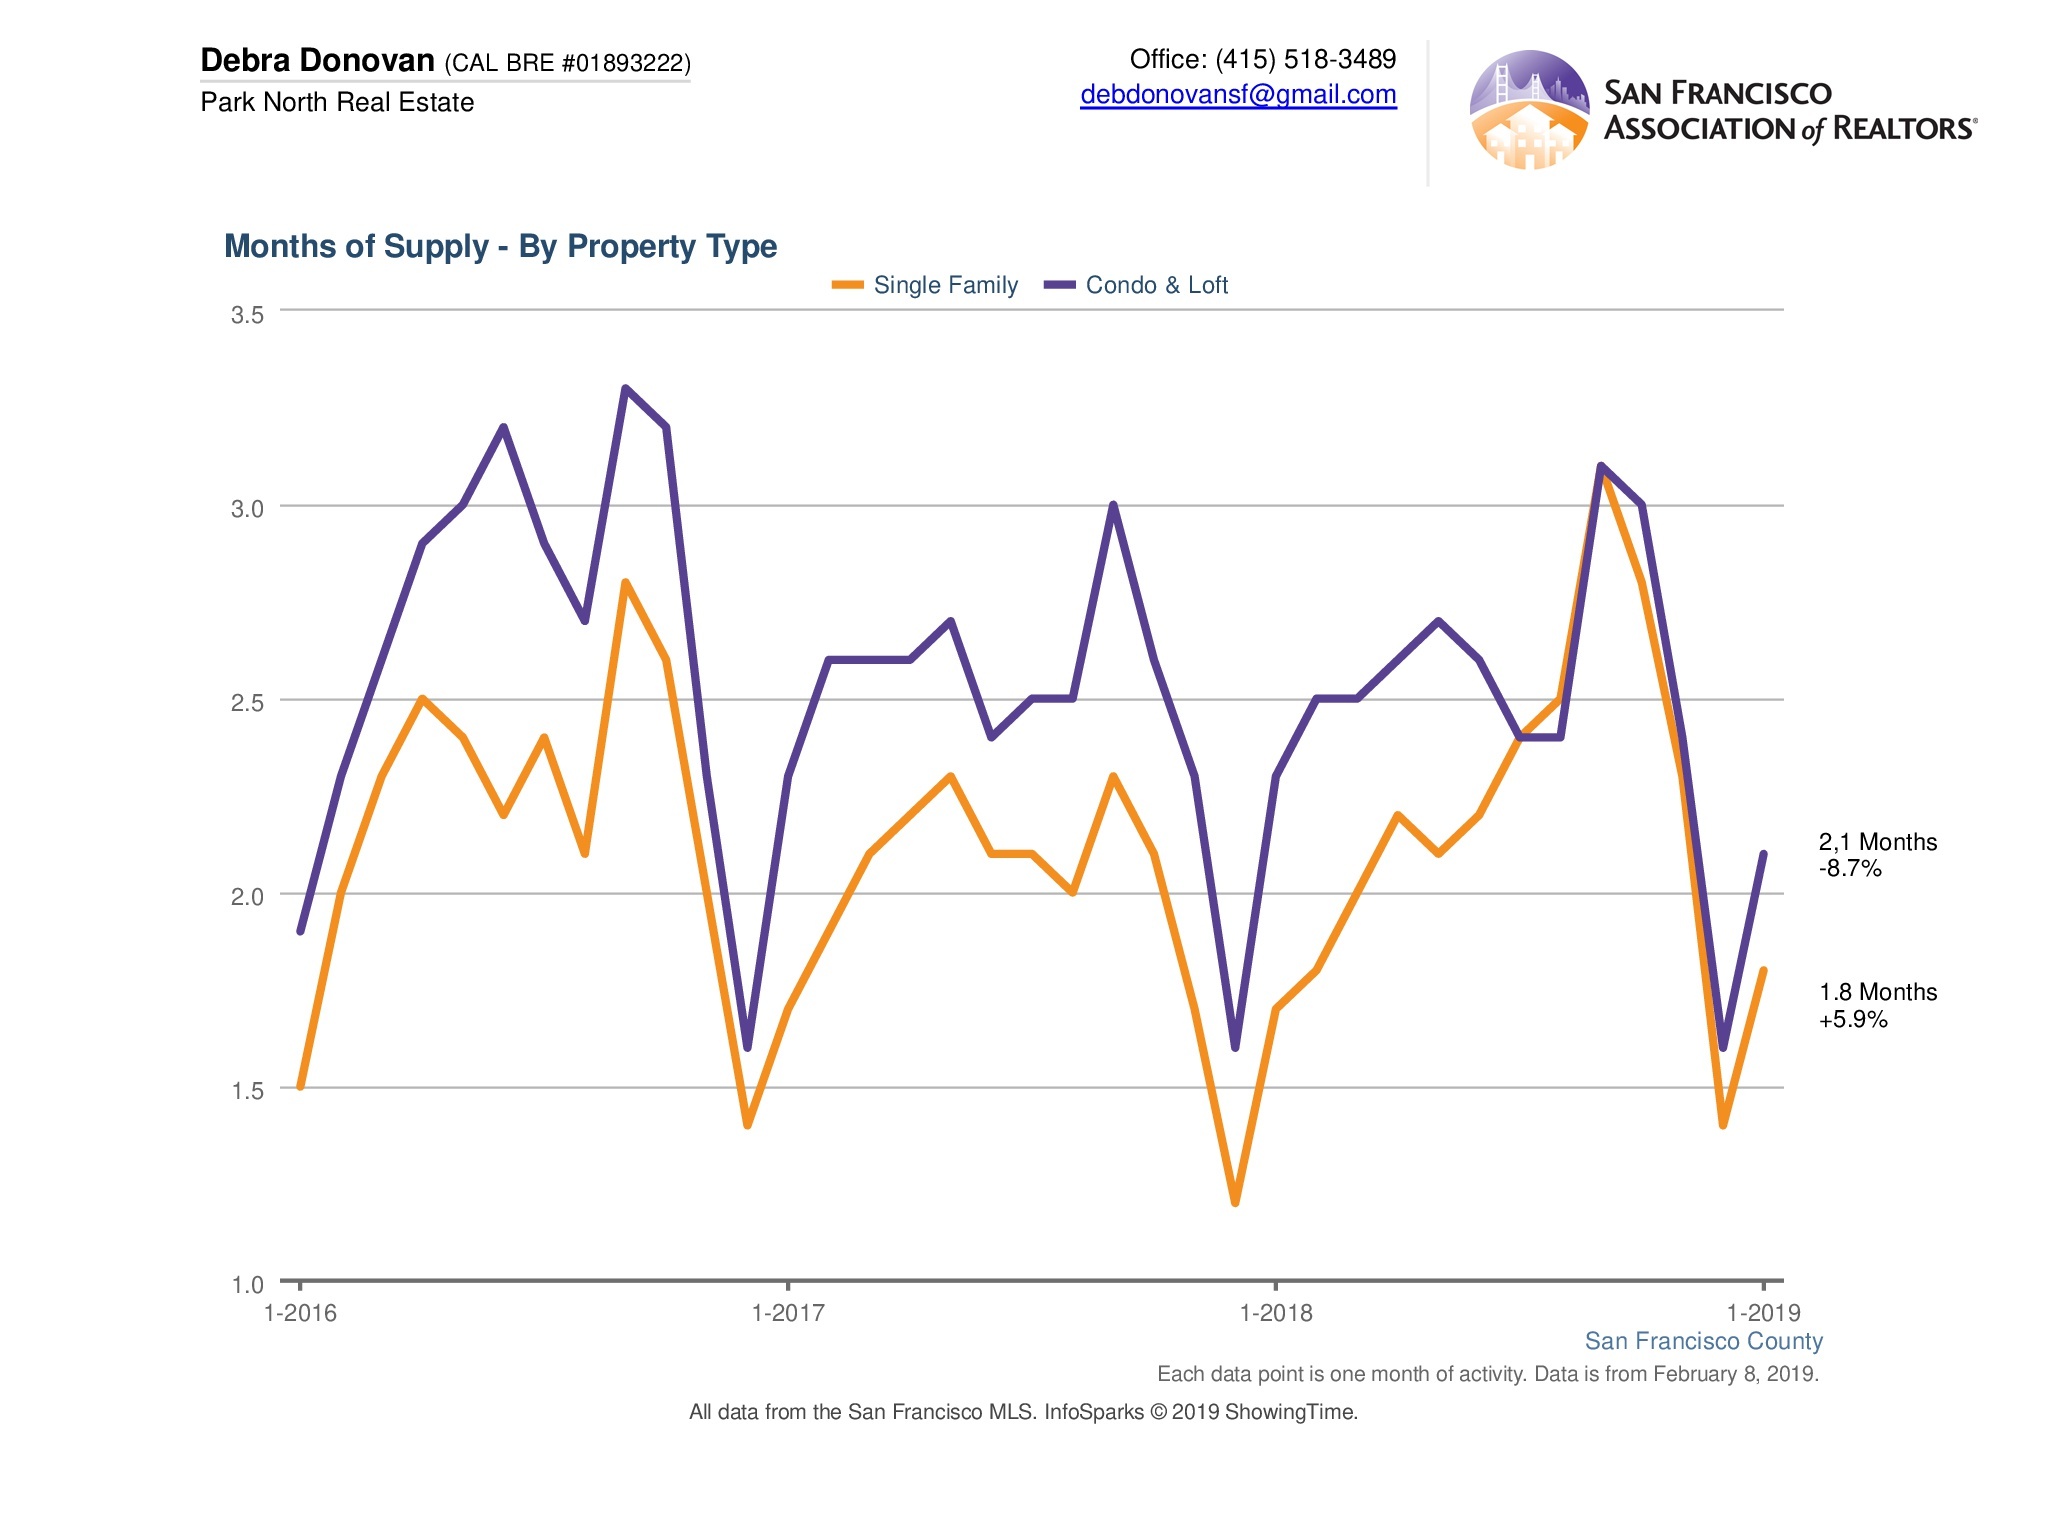
Months Supply of Inventory (MSI):
As sales languished a bit and homes sat on the market longer, MSI naturally also increased. There was about 1.8 months of inventory for single family homes, up 5.9% compared to January of last year (and up from 1.5 months in December 2018). Condos and lofts had about 2 months of inventory, which was a decrease from January last year, but up slightly from 1.7 months in December. Remember, it’s still a seller’s market. A more balanced market would show 4-6 months of inventory.
The fine print: All information deemed reliable but not guaranteed or warranted. Data comes from MLS so does not include off-market and most new construction condo sales. The San Francisco real estate market is dynamic so statistics can change on a daily basis. These statistics are meant to be a snapshot of the day and time they were pulled.