San Francisco Real Estate Market Update – February 2018
January was a bit topsy turvy. The new tax laws went into effect, the stock market plunged and then mostly settled again. So far, though, none of this seems to have effected our red-hot real estate market.
What remains to be seen is whether anticipated interest rates hikes might have an impact in the future. Just today new Fed Chairman Jerome Powell seemed upbeat about the economy, leading many to believe that the Fed will increase the number of interest rate increases in the coming year from a planned three to four. Many also believe the first of such increases could happen as soon as the March 20th when the Fed meets.
We will find out soon enough. In the meantime, here are the numbers for January.
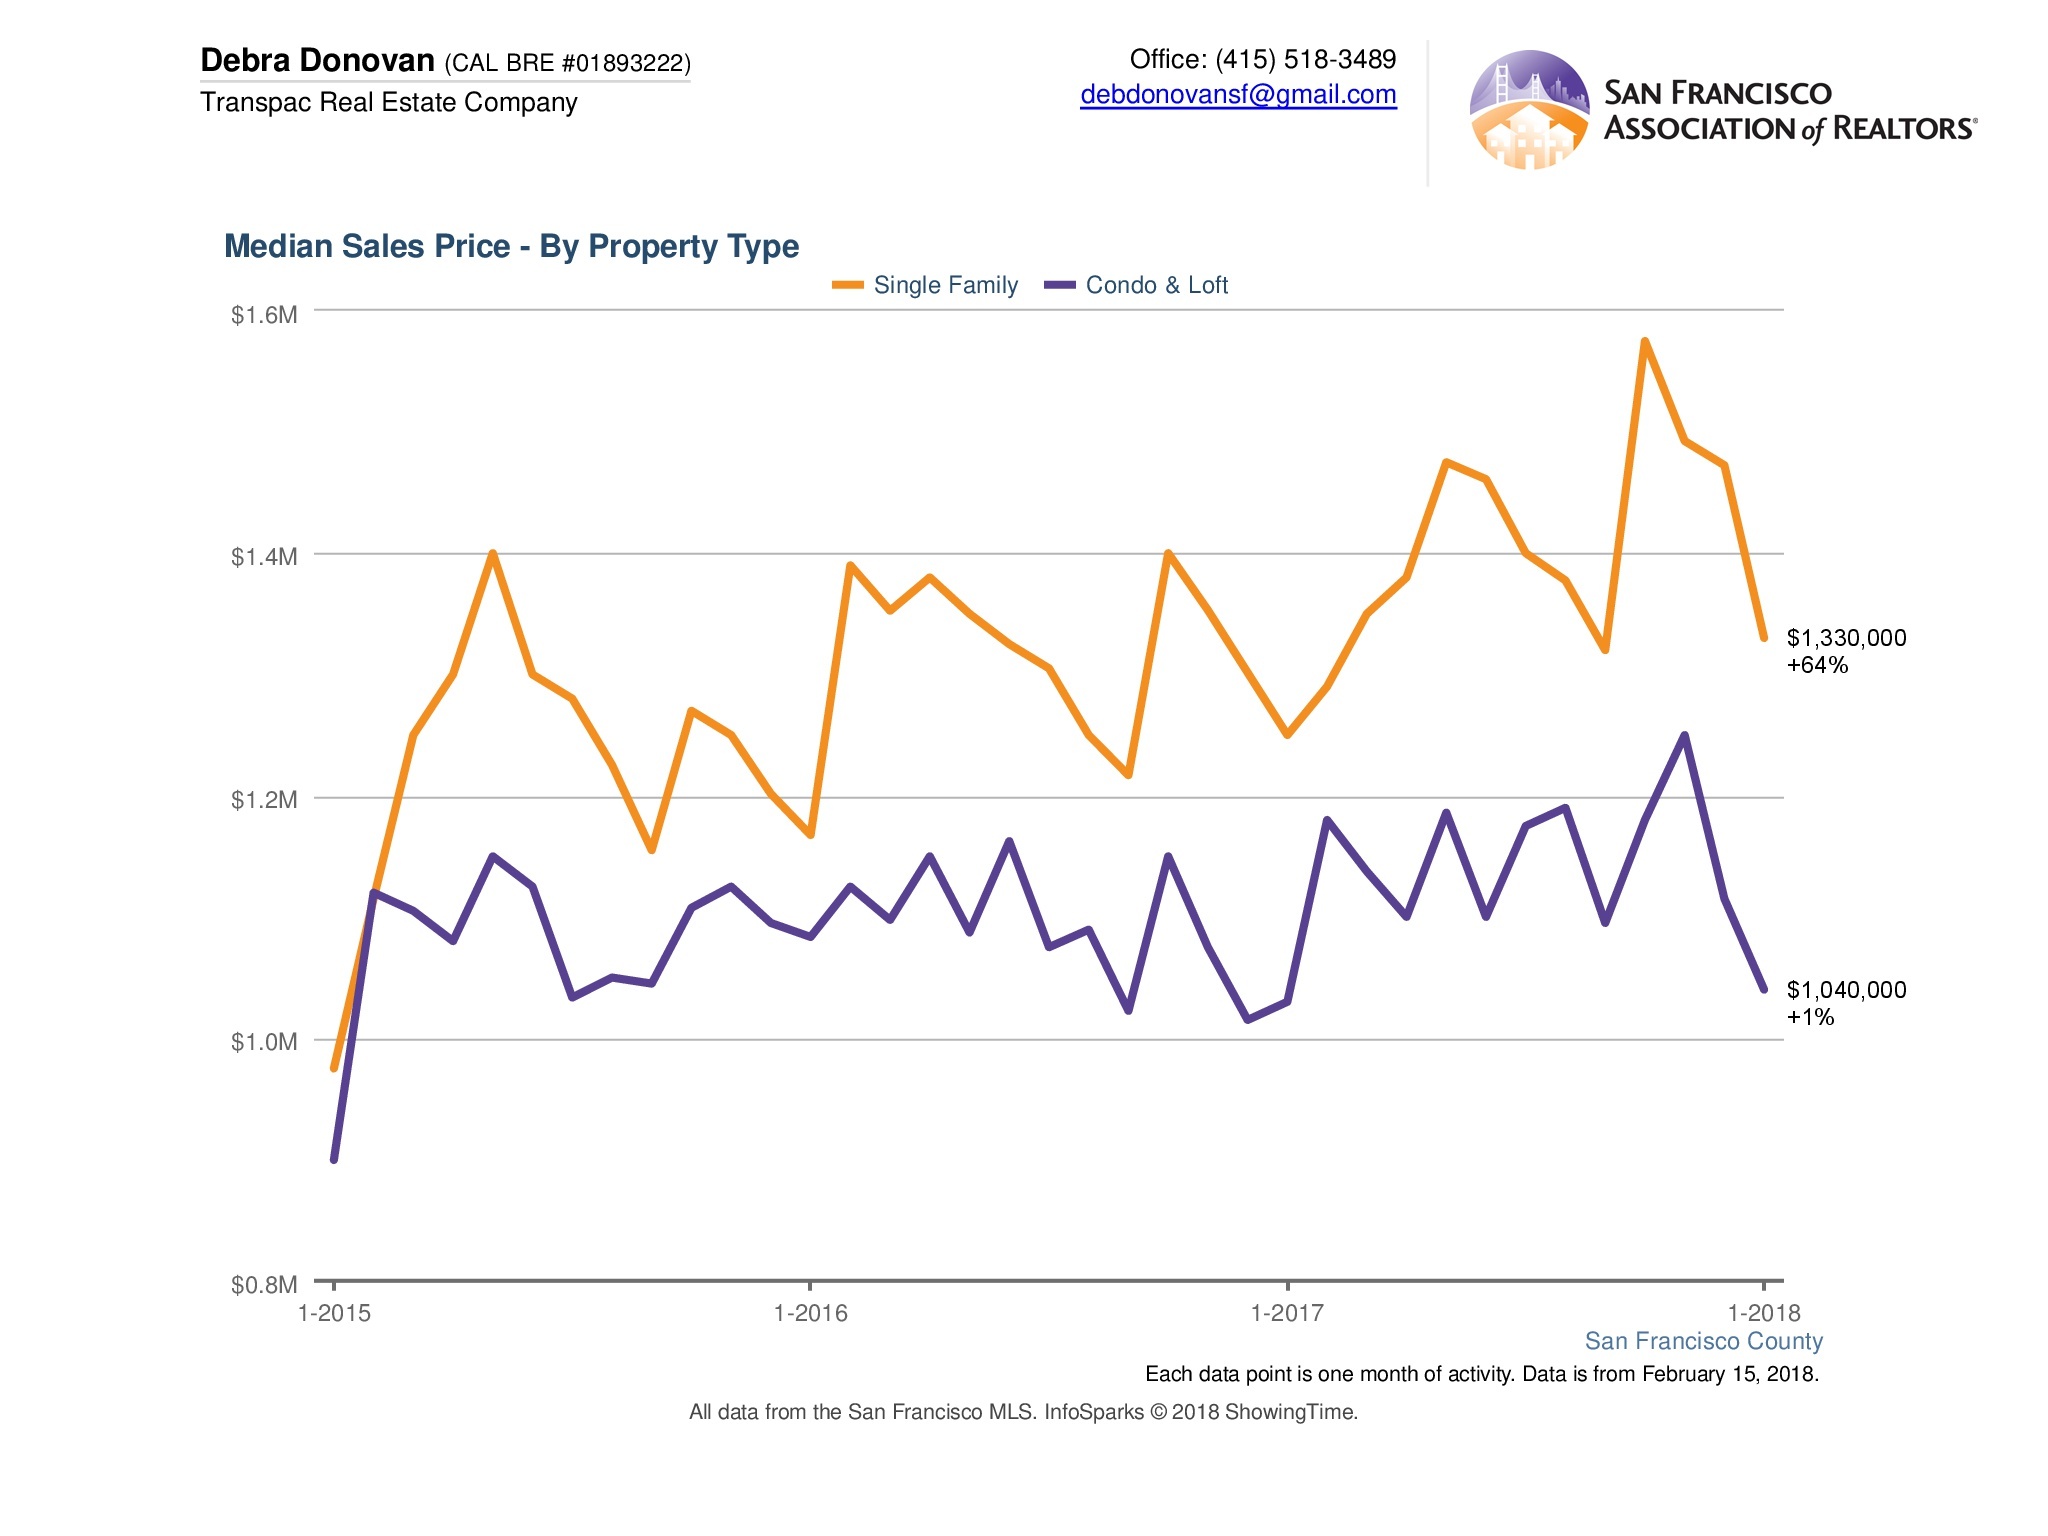
Median Sales Price:
The median sales price for single family homes was $1,330,000. That’s up 6.4% compared to January 2017, but the lowest median sales price we’ve seen in a given month since September 2017. Condo and loft prices also slipped slightly compared to the previous month, but they were still up about 1% when compared to January 2017. I would NOT encourage you to see this as an indication of a downward trend in prices. First because a month of data does not a trend make, but also because in real estate what sells in one month is due to homes going into contract the month before. Many sellers, particularly in the higher end and luxury markets, take December off from the market.
New Listings:
Even though new listings more than doubled for single family homes and condos compared to December, overall new listings were down over 17% for both when compared to January of last year.

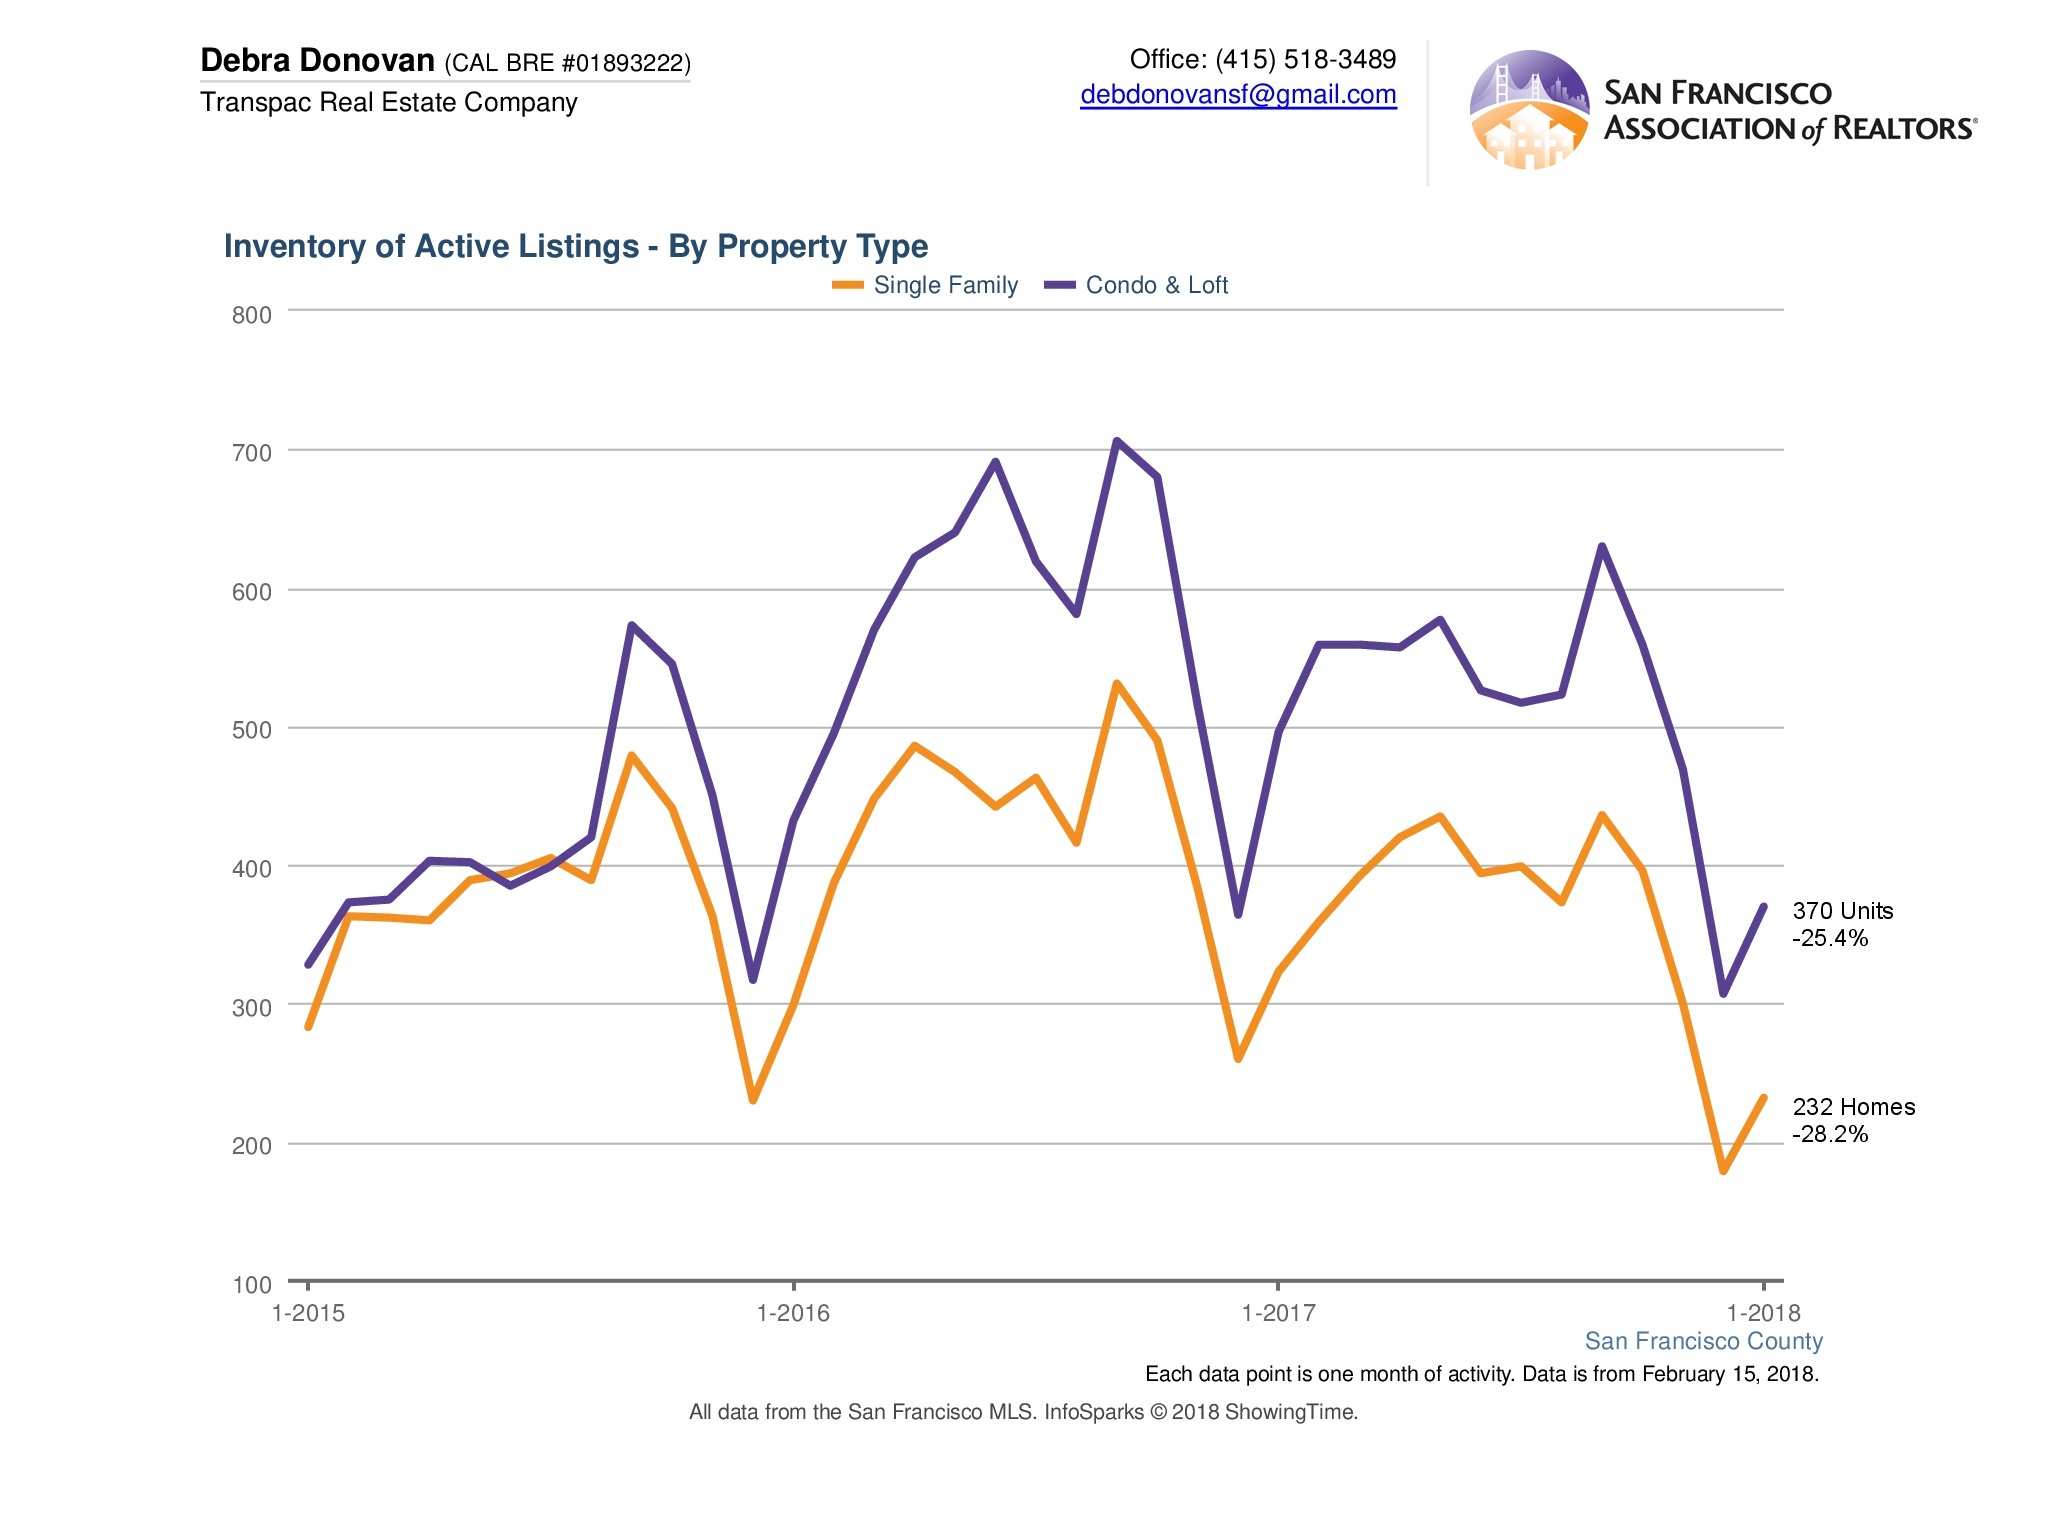
Active Listings:
Active listings were also dramatically down from the same time a year ago. Single family home inventory, clocking in at only 232 homes, was down over 28%. Condo and loft active listings were down over 25%.
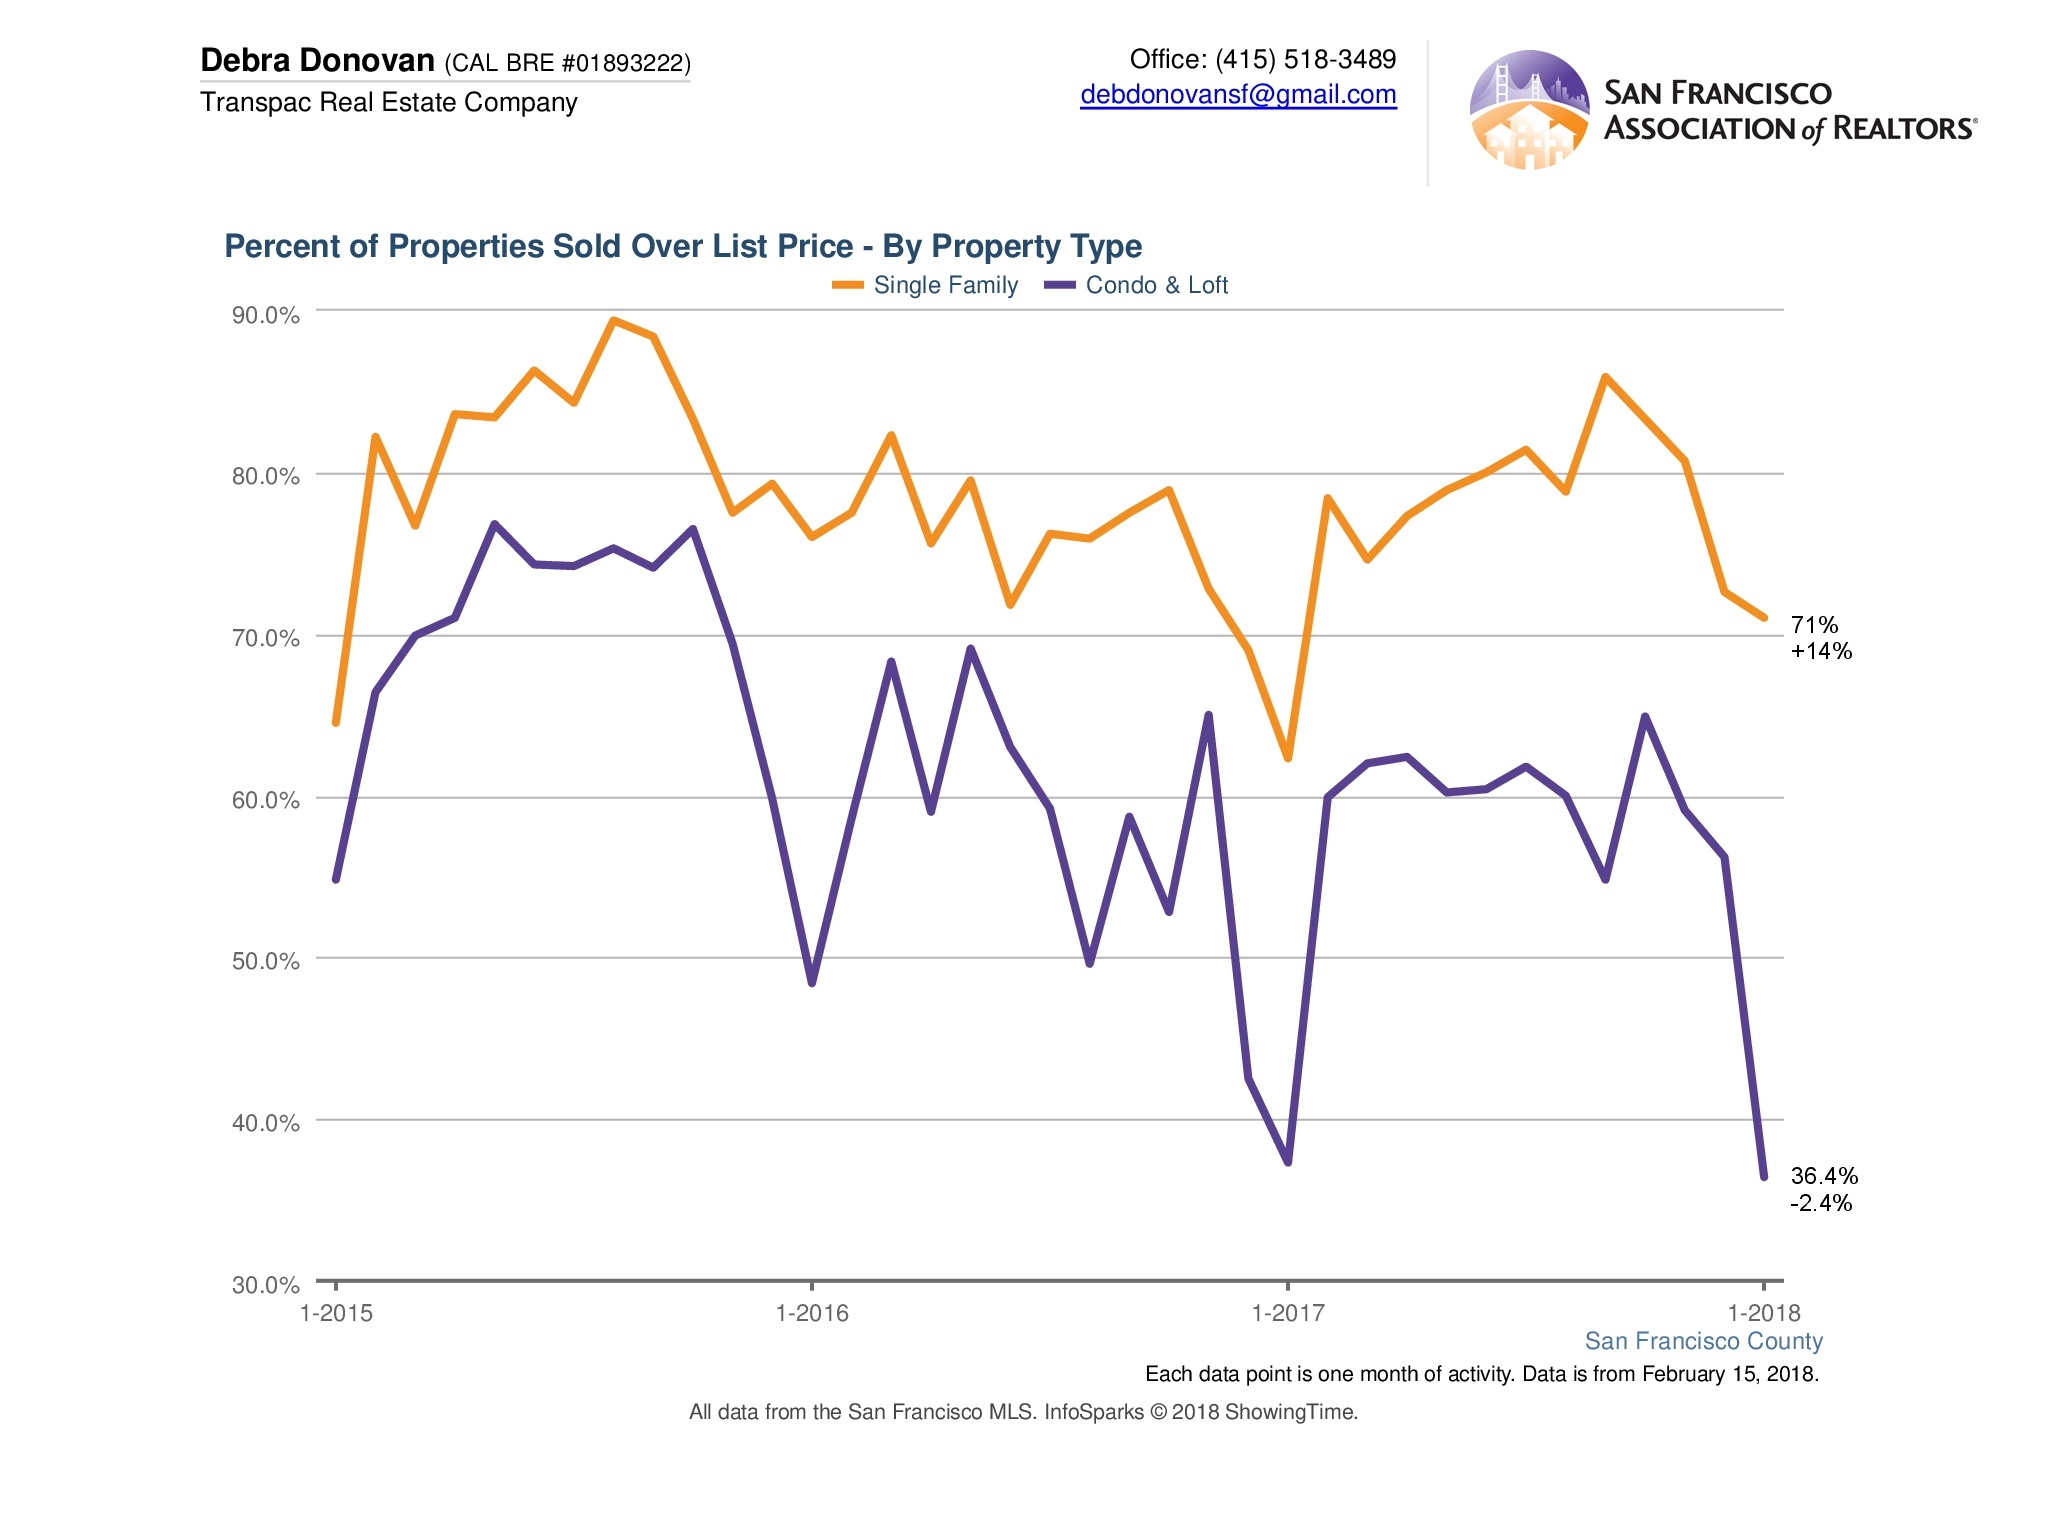
Percentage of Properties Sold Over List Price:
70% of single family homes sold for over their list price in January, an increase of 14% compared to last year. It’s interesting to note that this is also the lowest percentage since January of last year, likely for the same reasons median price fell. On the flip side, only 36.4% of condos and lofts sold for over list price, a decrease of 2.4% compared to January of last year. This is largely due to the influx of new construction seen in the downtown, SoMA, and South Beach areas, which has resulted in a cooling of prices in those areas. Units in other parts of the city saw healthier list price vs. sales price results.
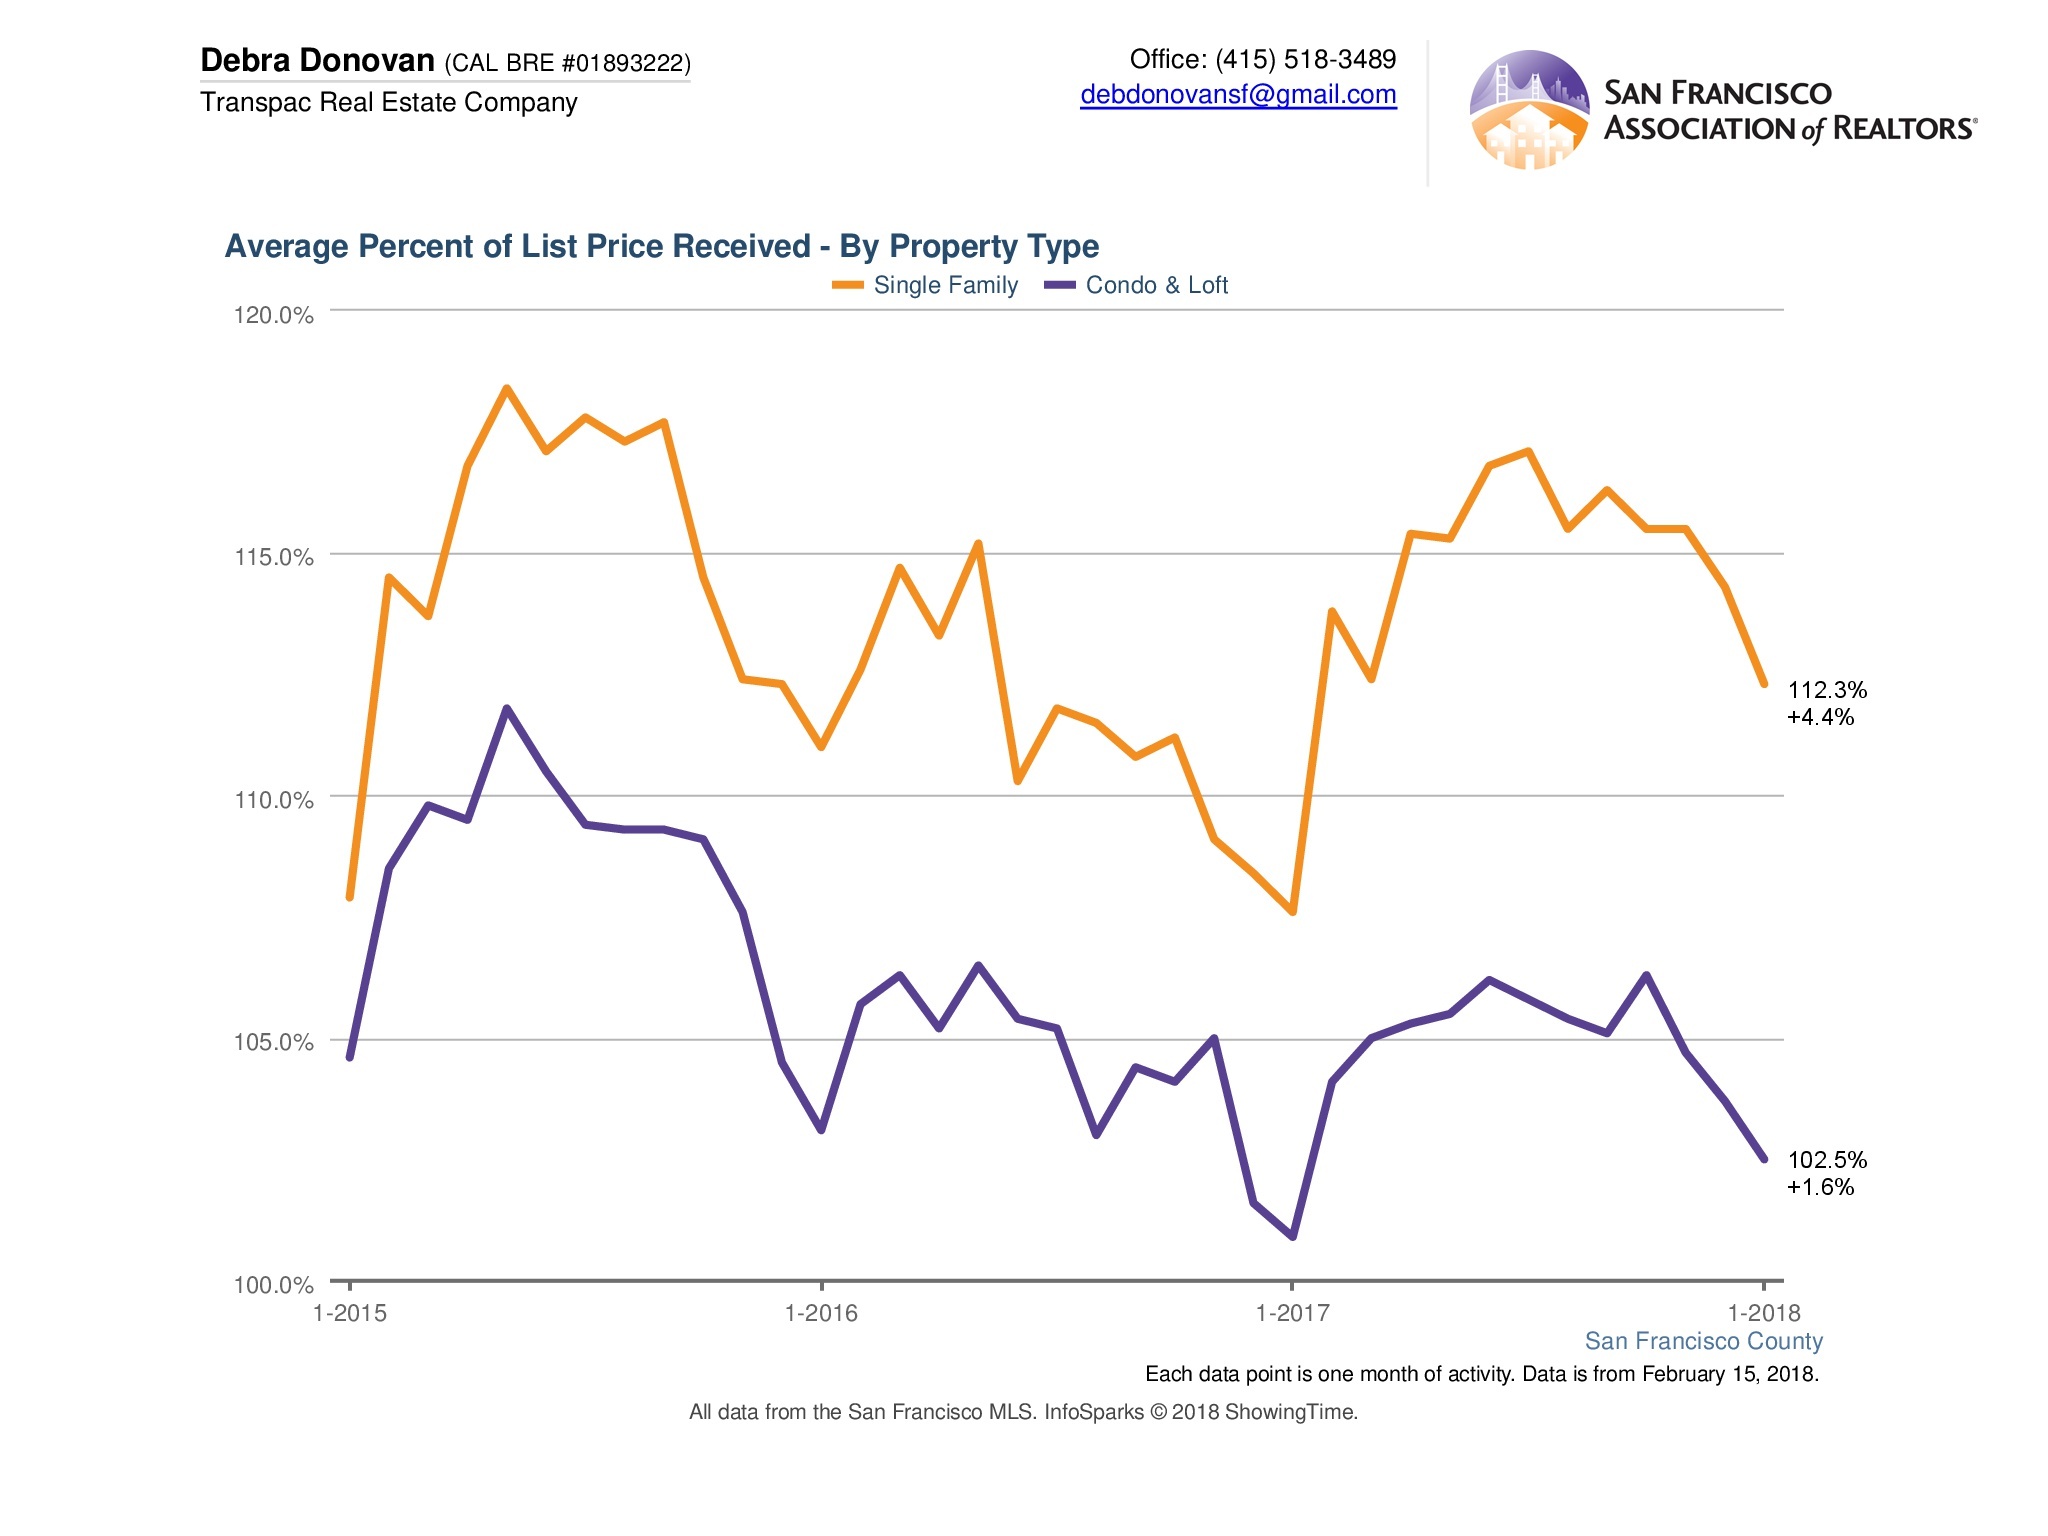
Percentage of List Price Received:
While dipping slightly from the previous month, the percentage of list price received remained fairly steady for both single family homes and condos/ lofts. Single family homes enjoyed an average 12% above list price, increasing 4.4% over January 2017. Condos averaged 2.5% sale over list price, up 1.6% over the same month last year.
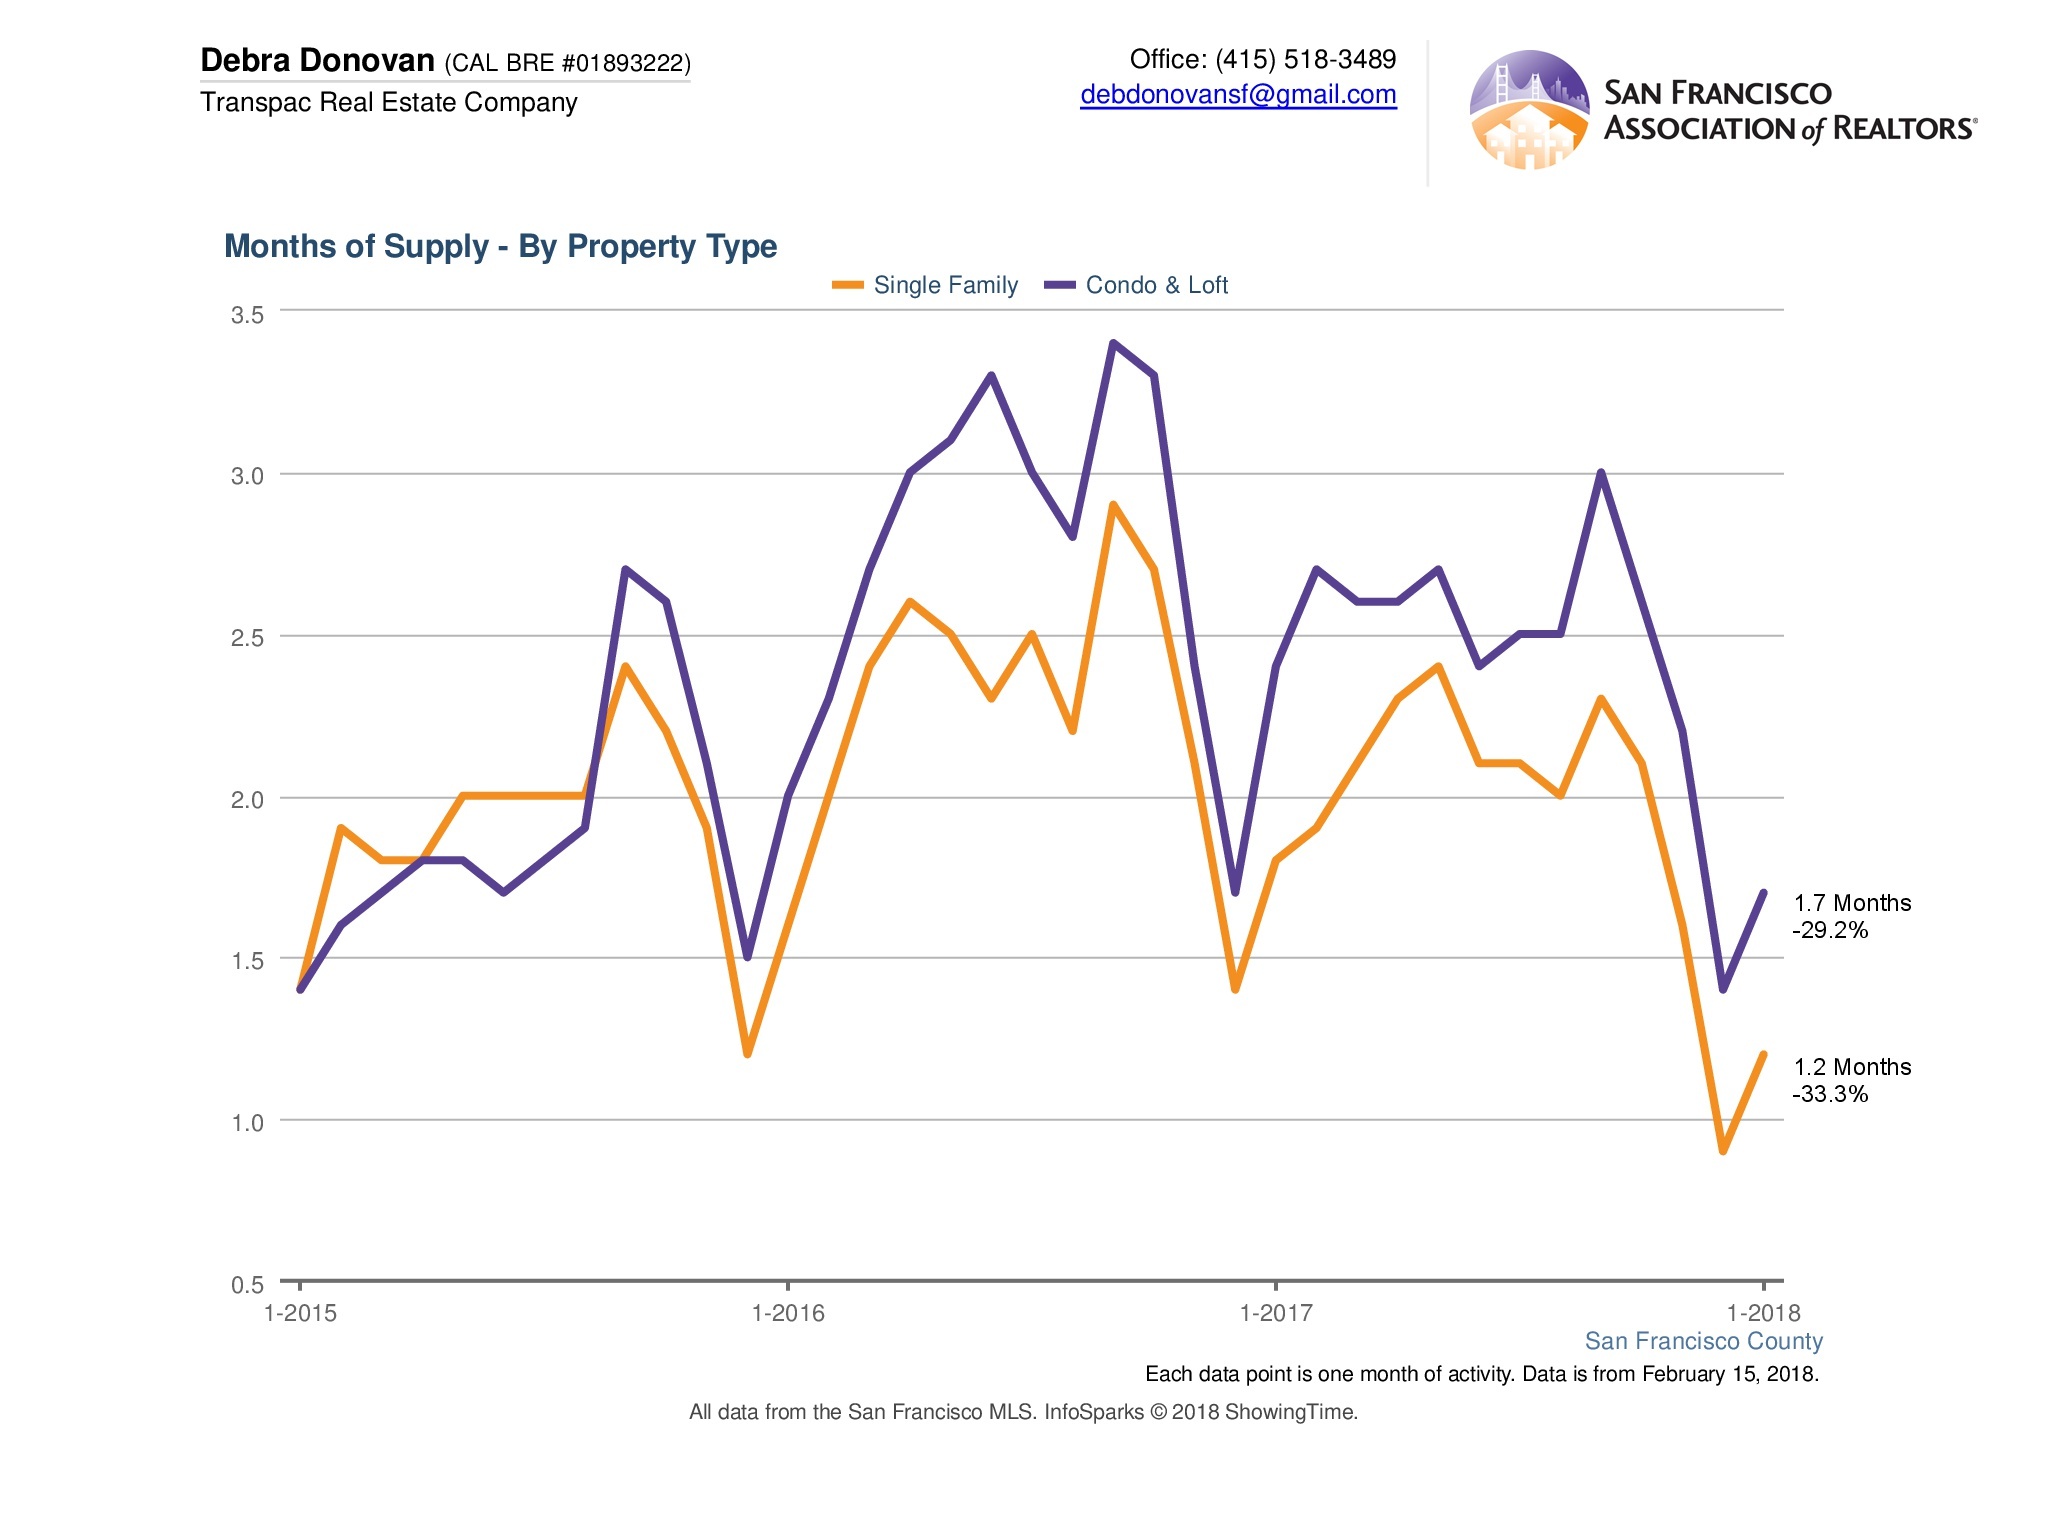
MSI:
Months supply of inventory was down a whopping 33% for single family homes and almost 30% for condos/ lofts compared to January 2017. MSI, or Months Supply of Inventory, is the amount of time it would take for all of the inventory currently on the market to sell given the current pace of sales. This is another indicator of how historically low our inventory is as demand outstrips supply.
The fine print: All information deemed reliable but not guaranteed or warranted. Data comes from MLS so does not include off-market and most new construction condo sales. The San Francisco real estate market is dynamic so statistics can change on a daily basis. These statistics are meant to be a snapshot of the day and time they were pulled.