January 2020 Real Estate Market Update – 2019 Wrap-Up

Happy New Year!!
As we dive full-force into 2020 here’s a quick look back at how the San Francisco real estate market fared in 2019. Prices grew, though not as dramatically as in previous years. Inventory continued to be an impediment with fewer new listings than the previous year. That, combined with buyer demand, contributed to homes still selling quickly with many selling for over their listing price.
The past several years has seen a crazy real estate market with eye-popping price increases, but it is possible that trajectory is now slowing. Still, expect next year to be another healthy year for San Francisco real estate as buyer demand remains high and interest rates remain low and perhaps, go even lower.
BONUS: If you really want an illustration of the long-term health and vitality of the San Francisco market, be sure to check out the bonus slide at the bottom!
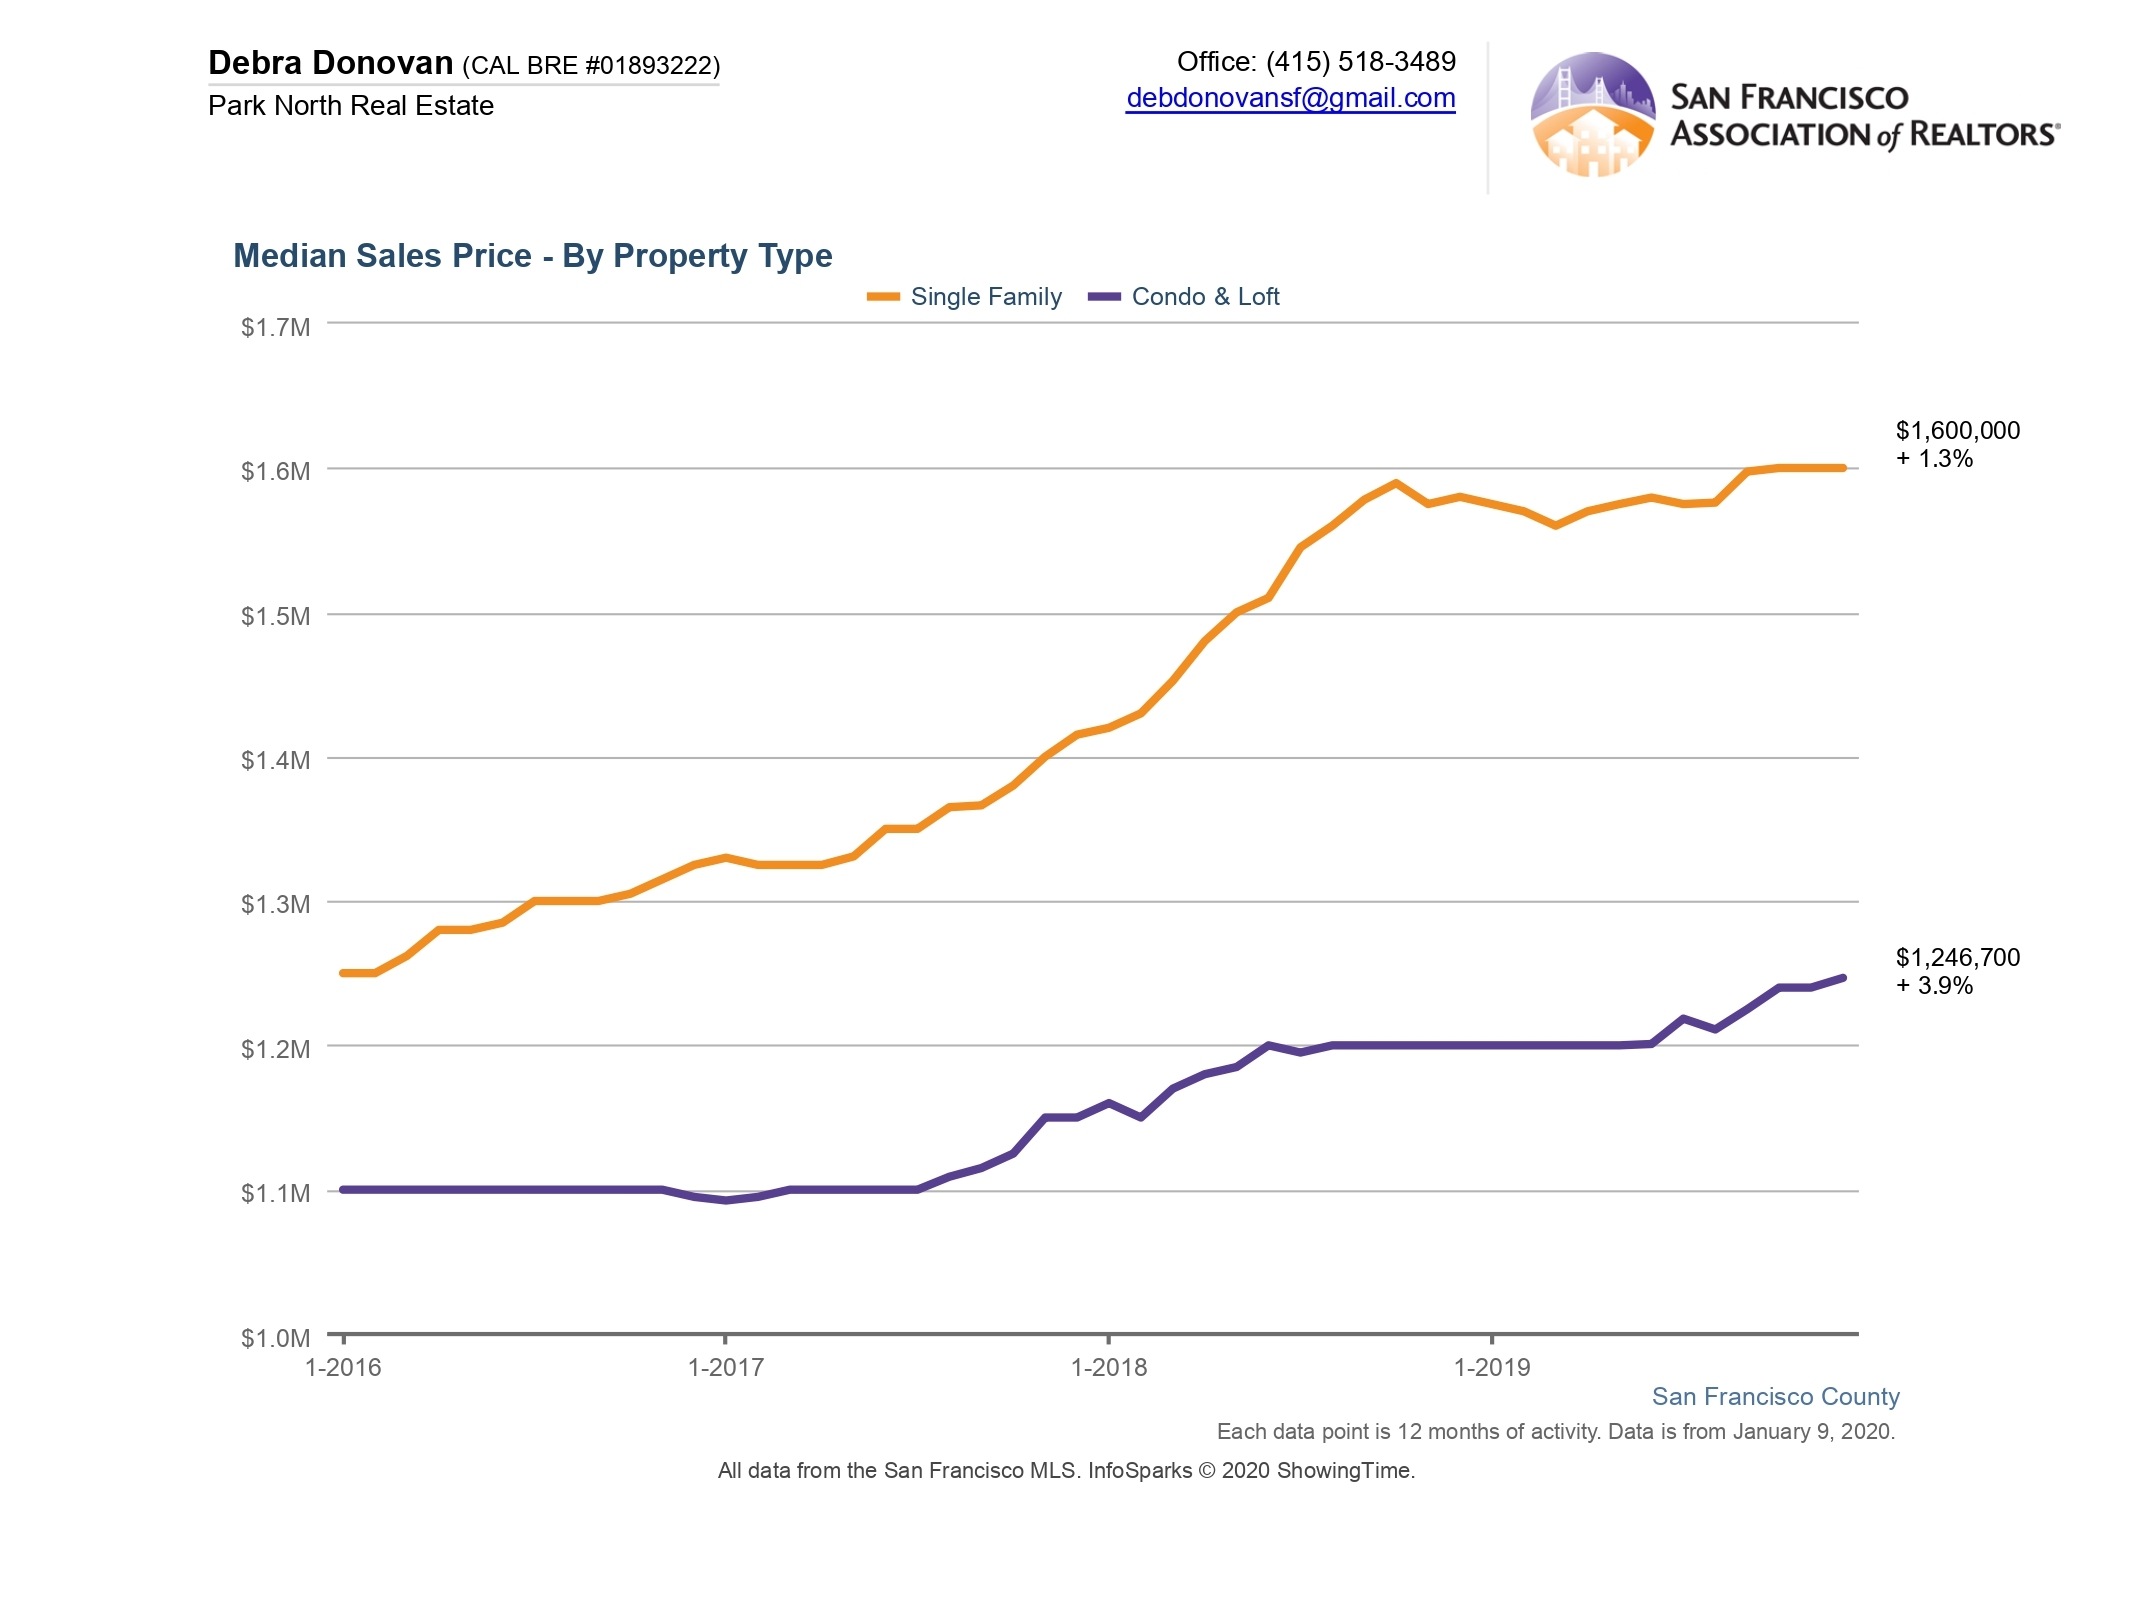
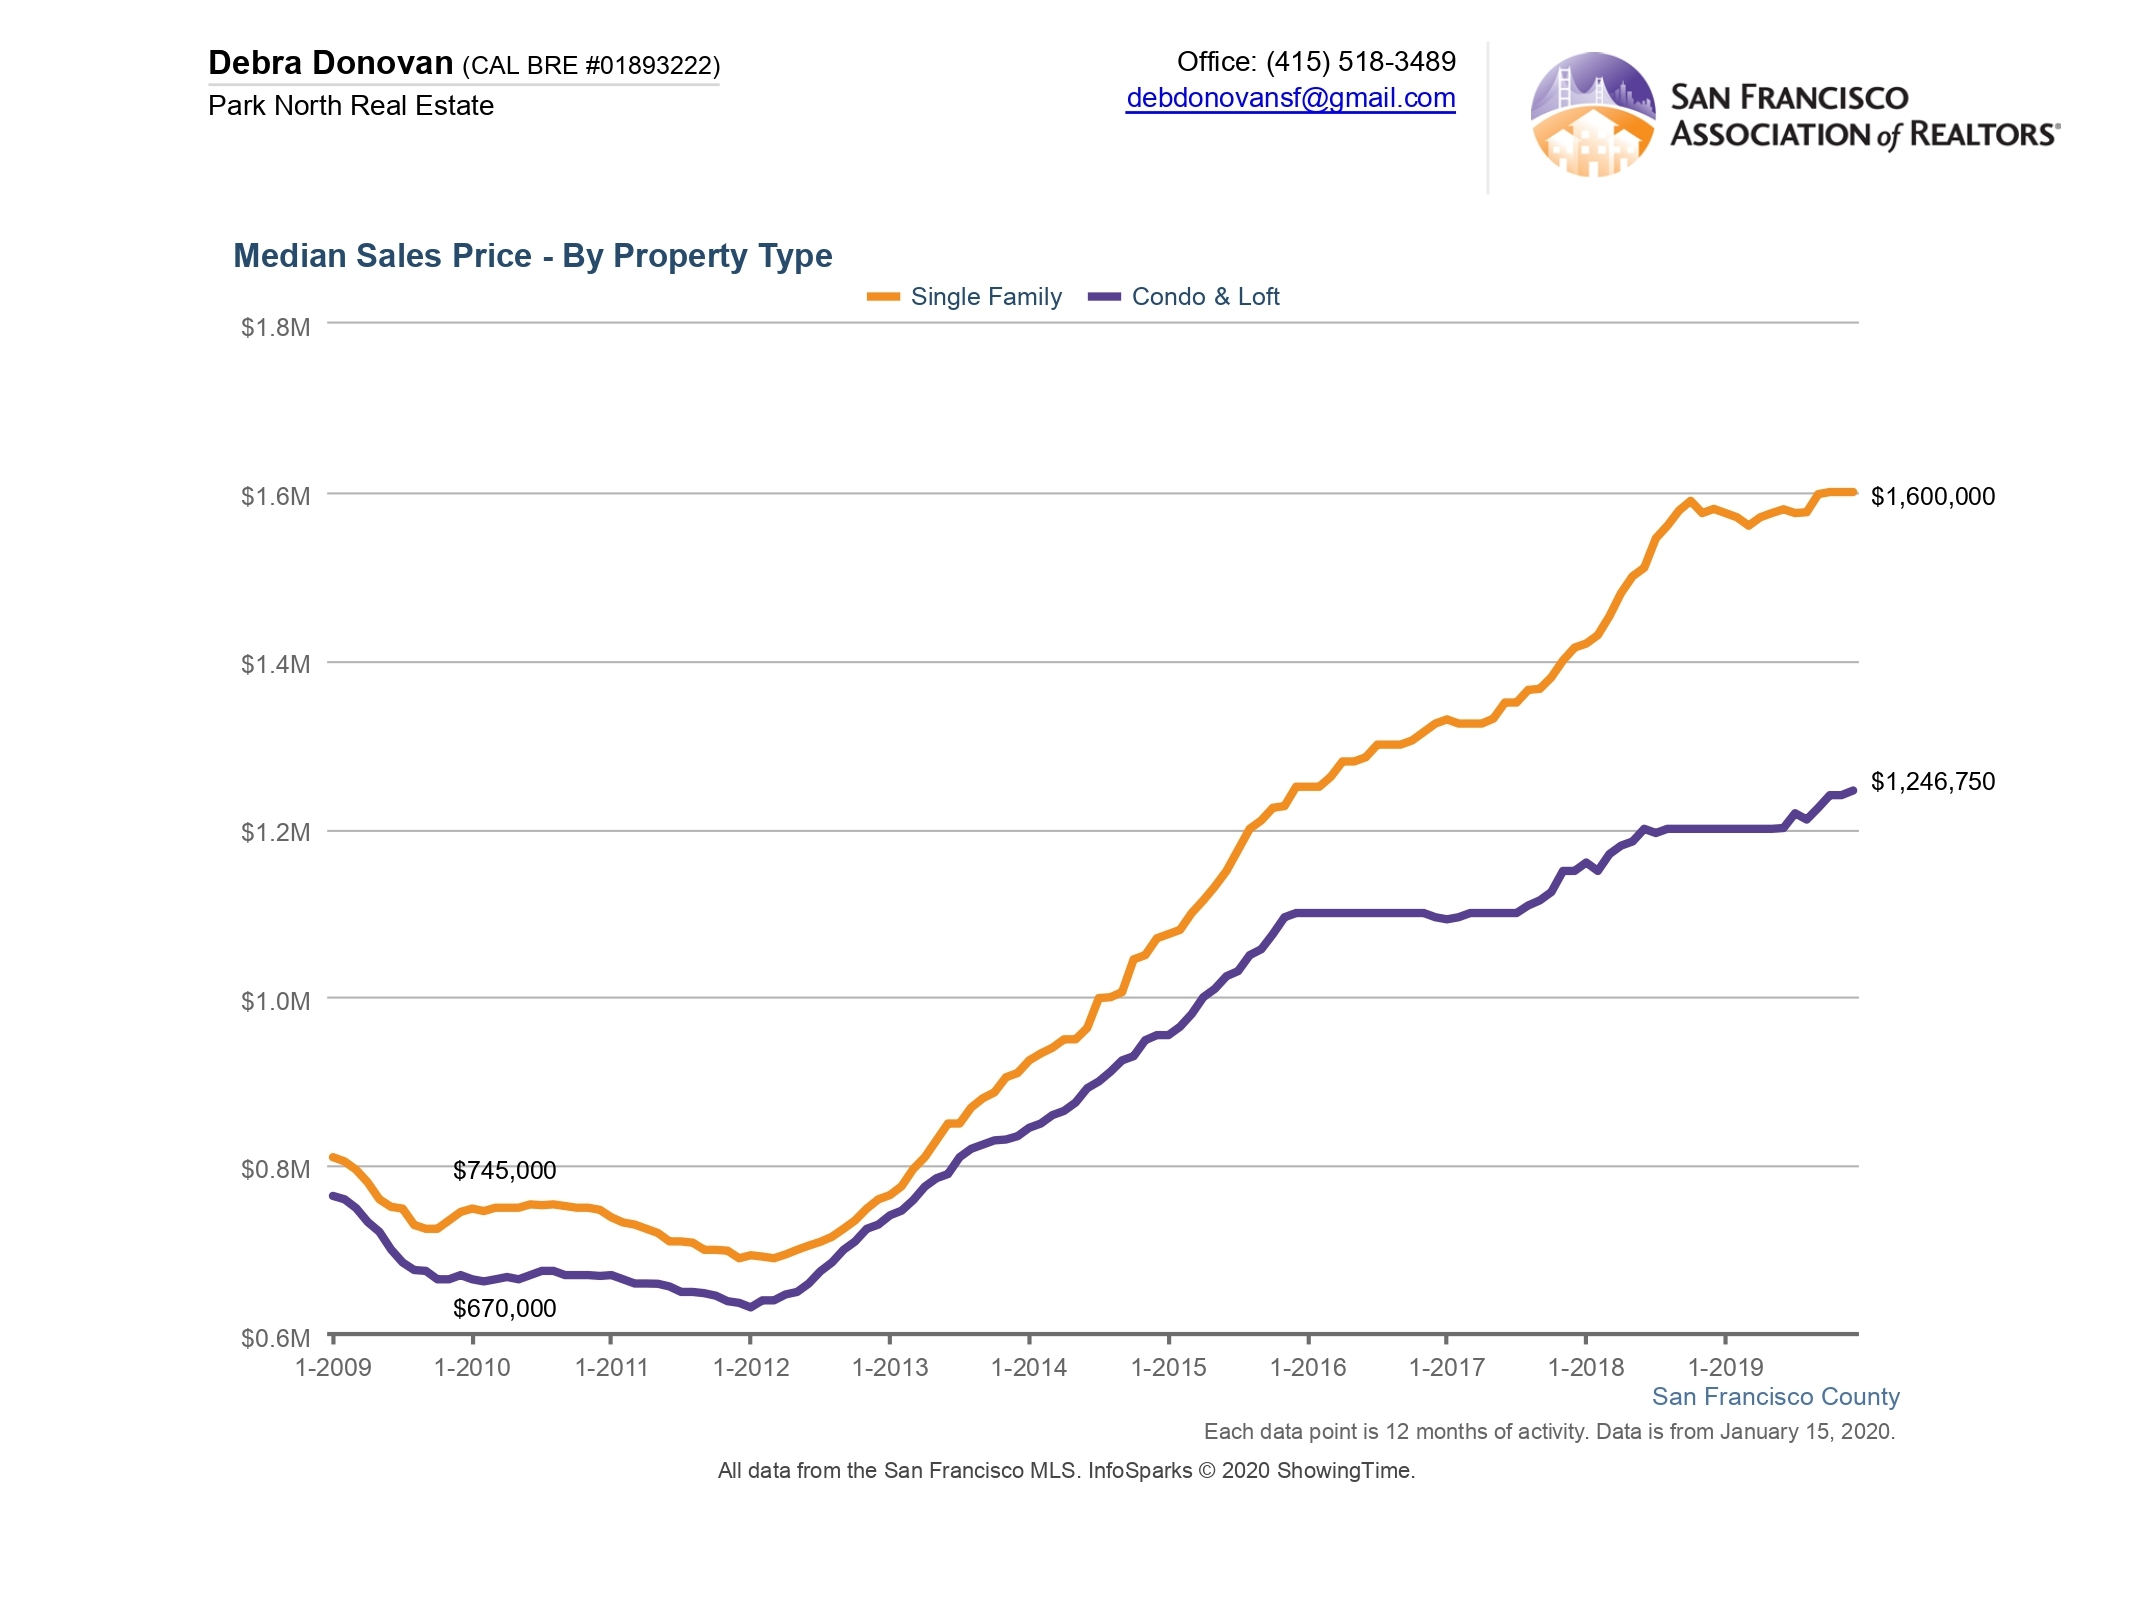
Median Sales Price:
While median prices for homes did go up in 2019, it was not as dramatic as in years past. Single family homes ended the year with a median sales price of $1,600,000, a 1.3% increase over 2018. Condos and lofts fared a bit better, increasing 3.9% to $1,246,750. This typically does not include sales in new construction that are usually not listed in the MLS.
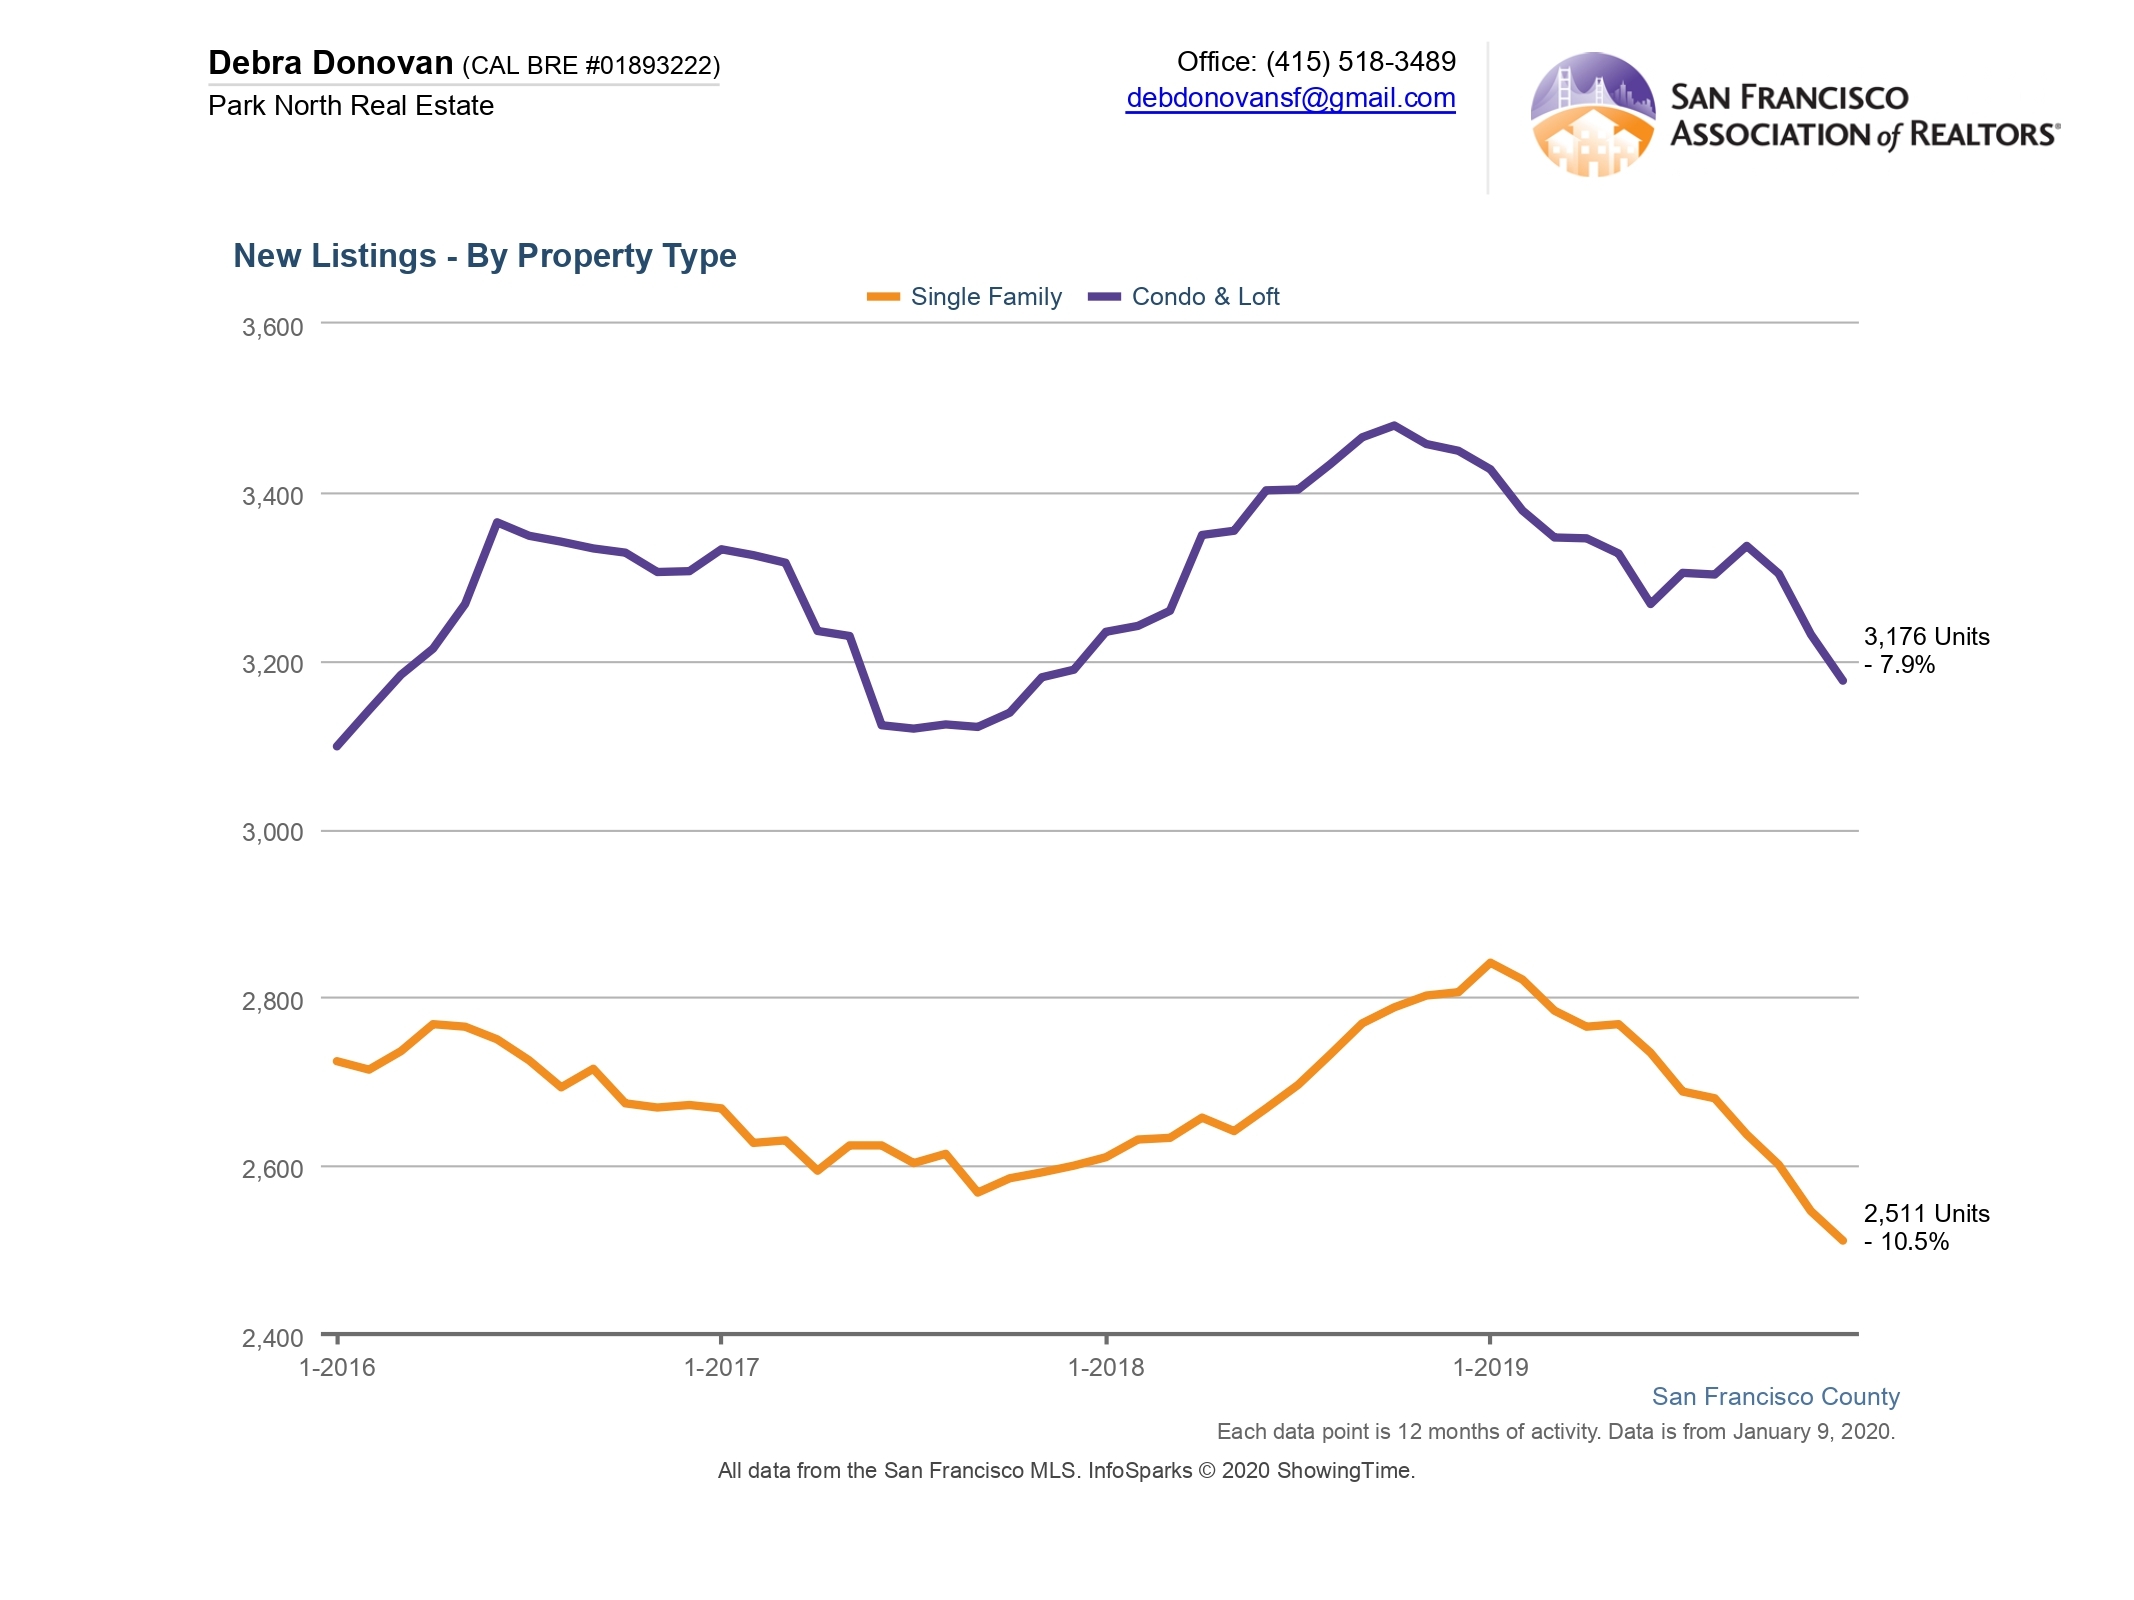
New Listings:
Inventory continued to be an issue in 2019. New listings for single family homes were down more than 10% compared to the previous year. Condos and lofts were down almost 8%.
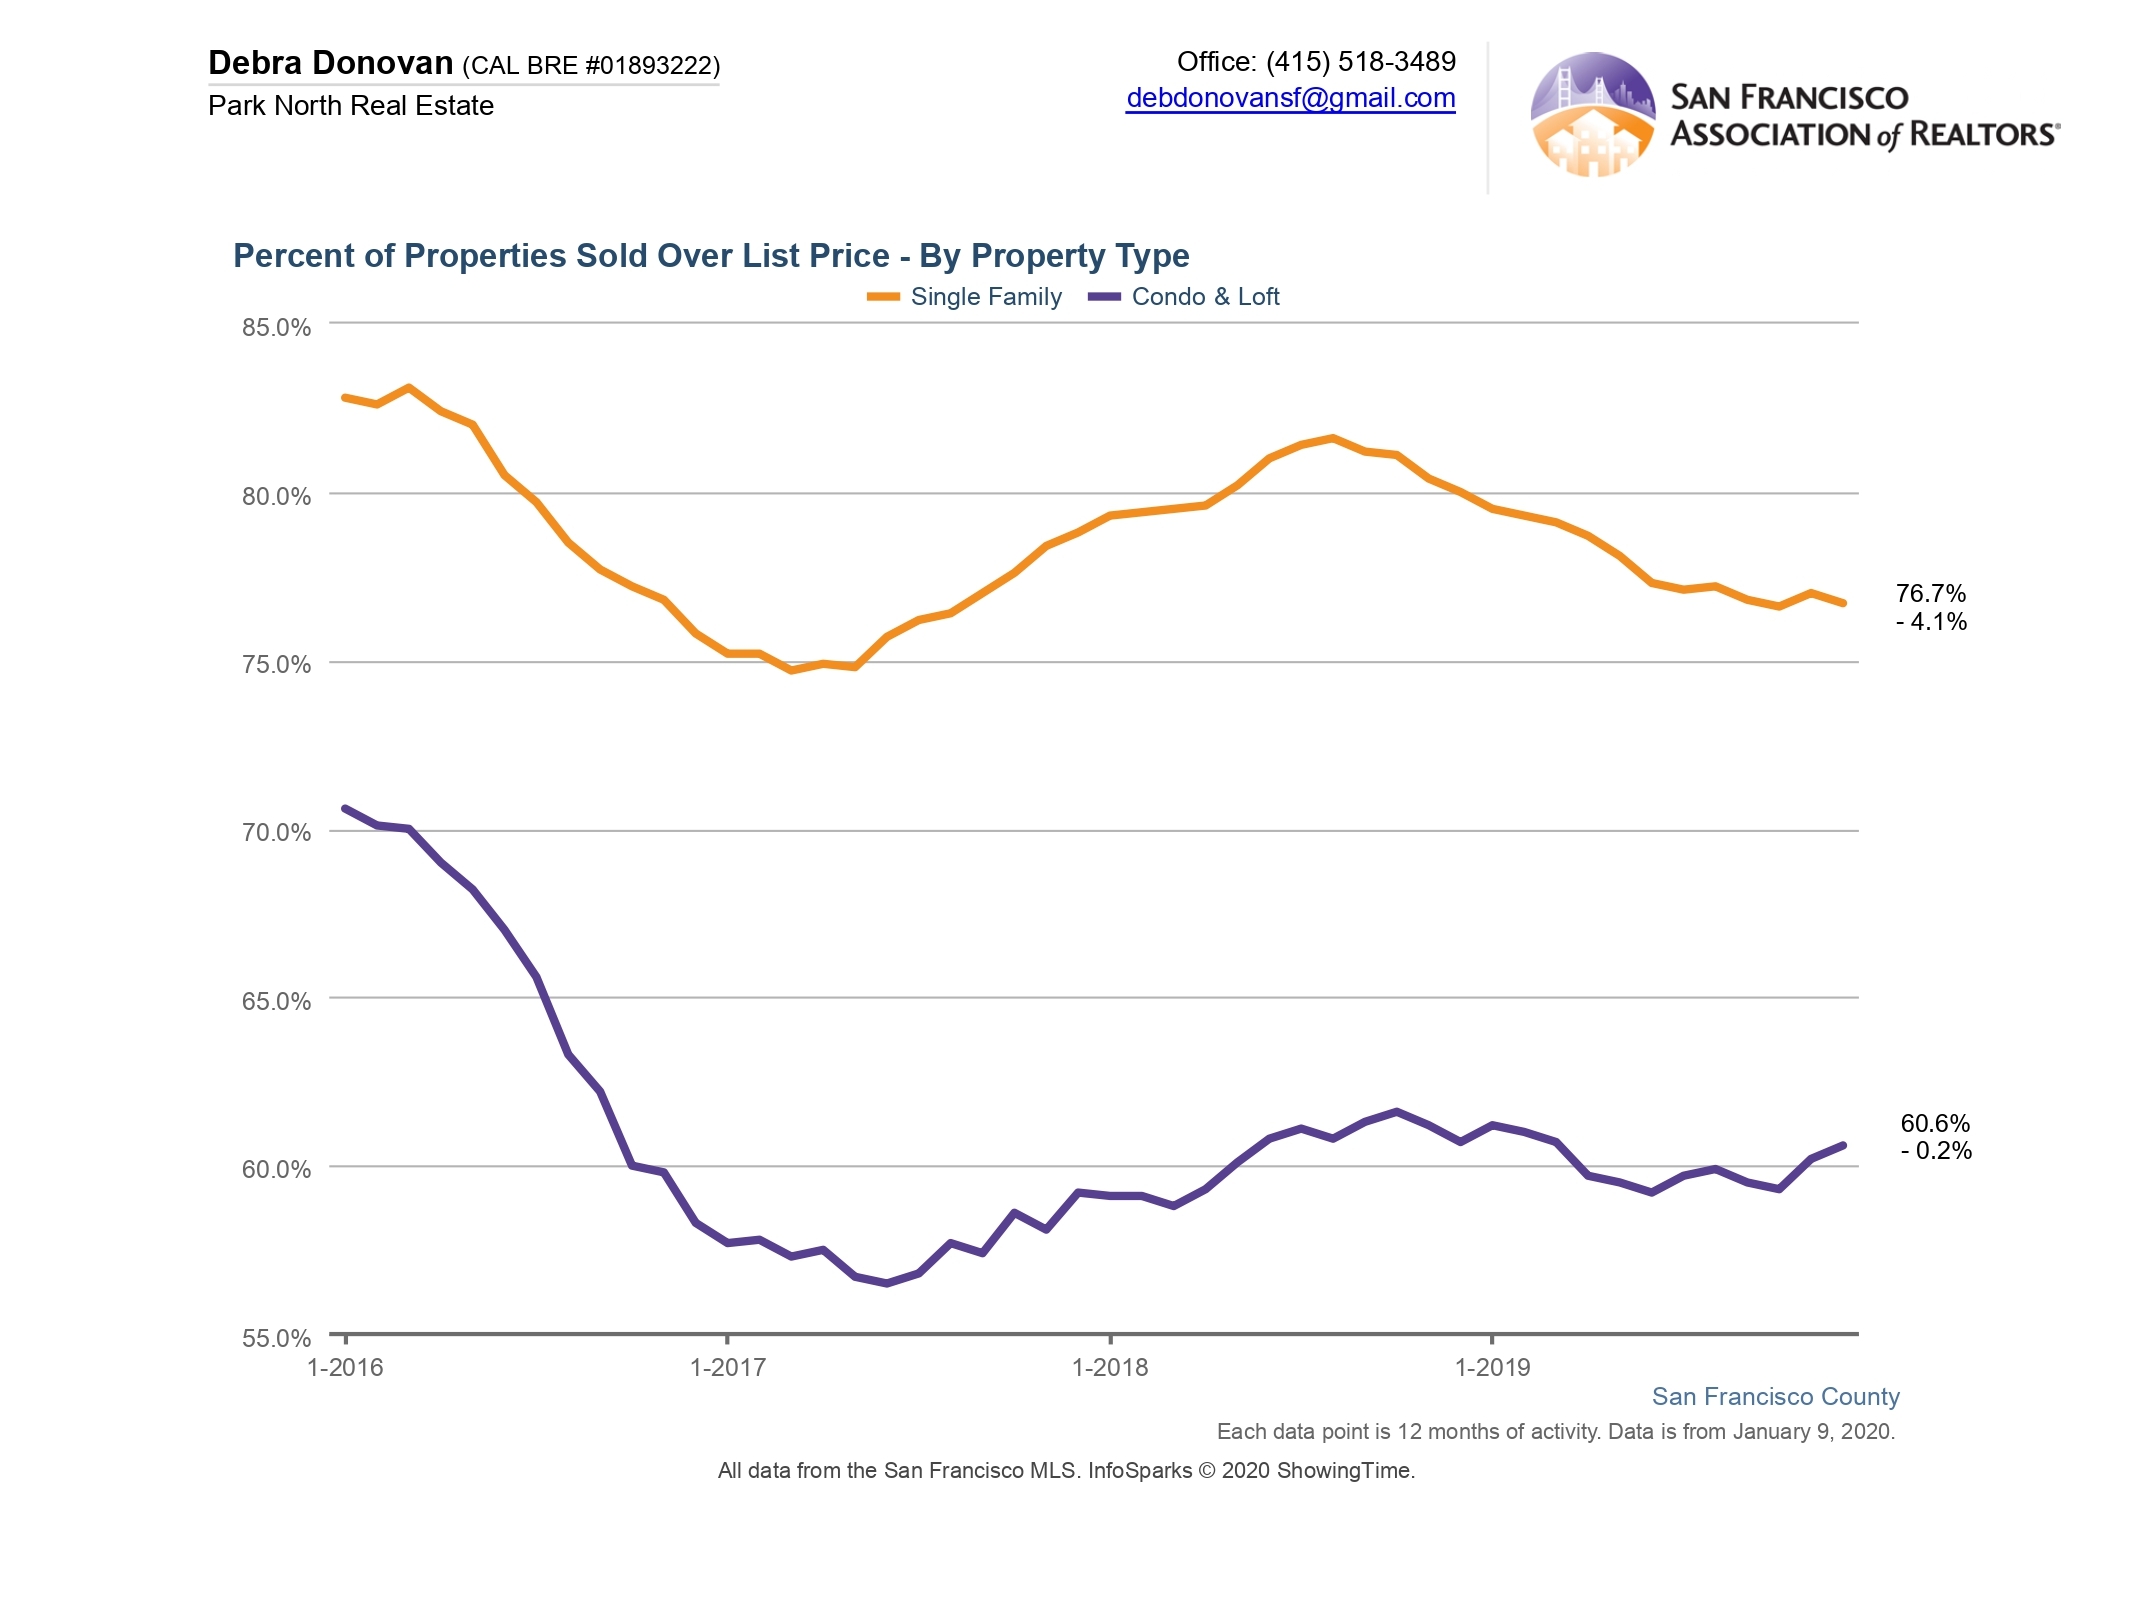
Percentage of Properties that Sold Over List Price:
More homes sold over their list price in 2019 than didn’t. Still, the percentage overall continued to decrease as the year passed. This could be partly due to more “transparent pricing” from the get-go, but I also think it’s because buyers have felt less willing to overbid as significantly as they have in years past.
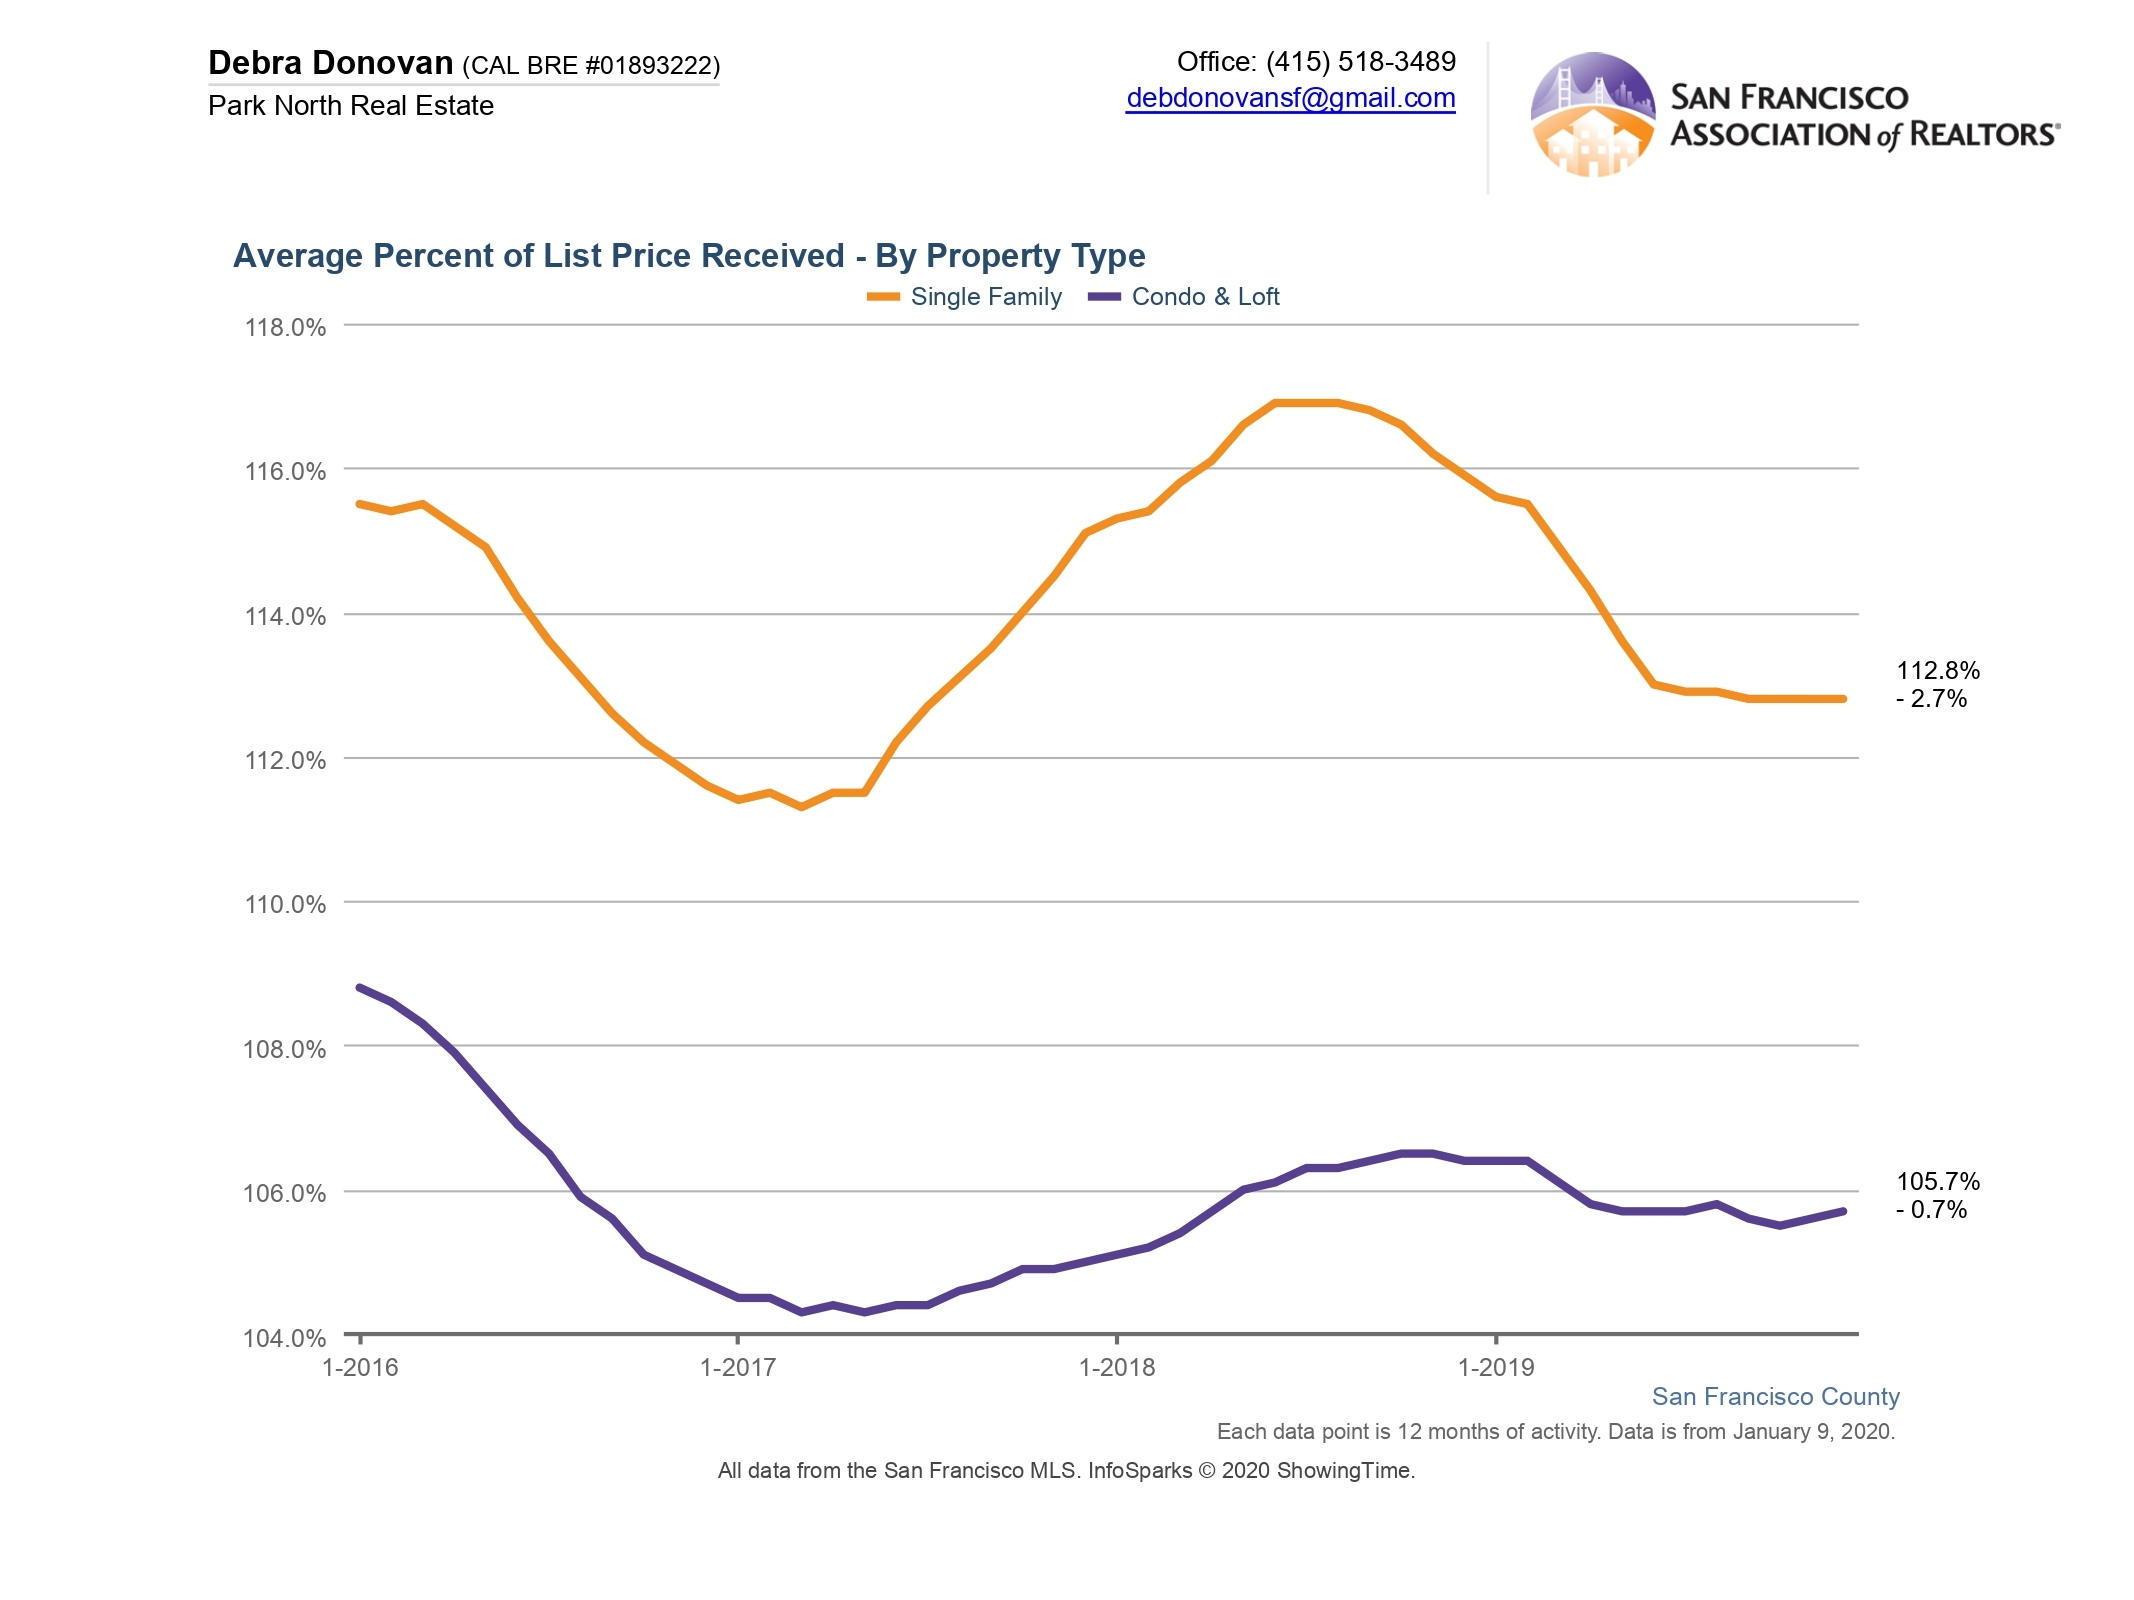
Average Percentage of List Price Received:
On average, single family homes sold for an average of about 113% over their listing price, down almost 3% compared to the previous 12 months. Condos and lofts sold for just under 106% of list price, effectively remaining steady compared to the previous year.
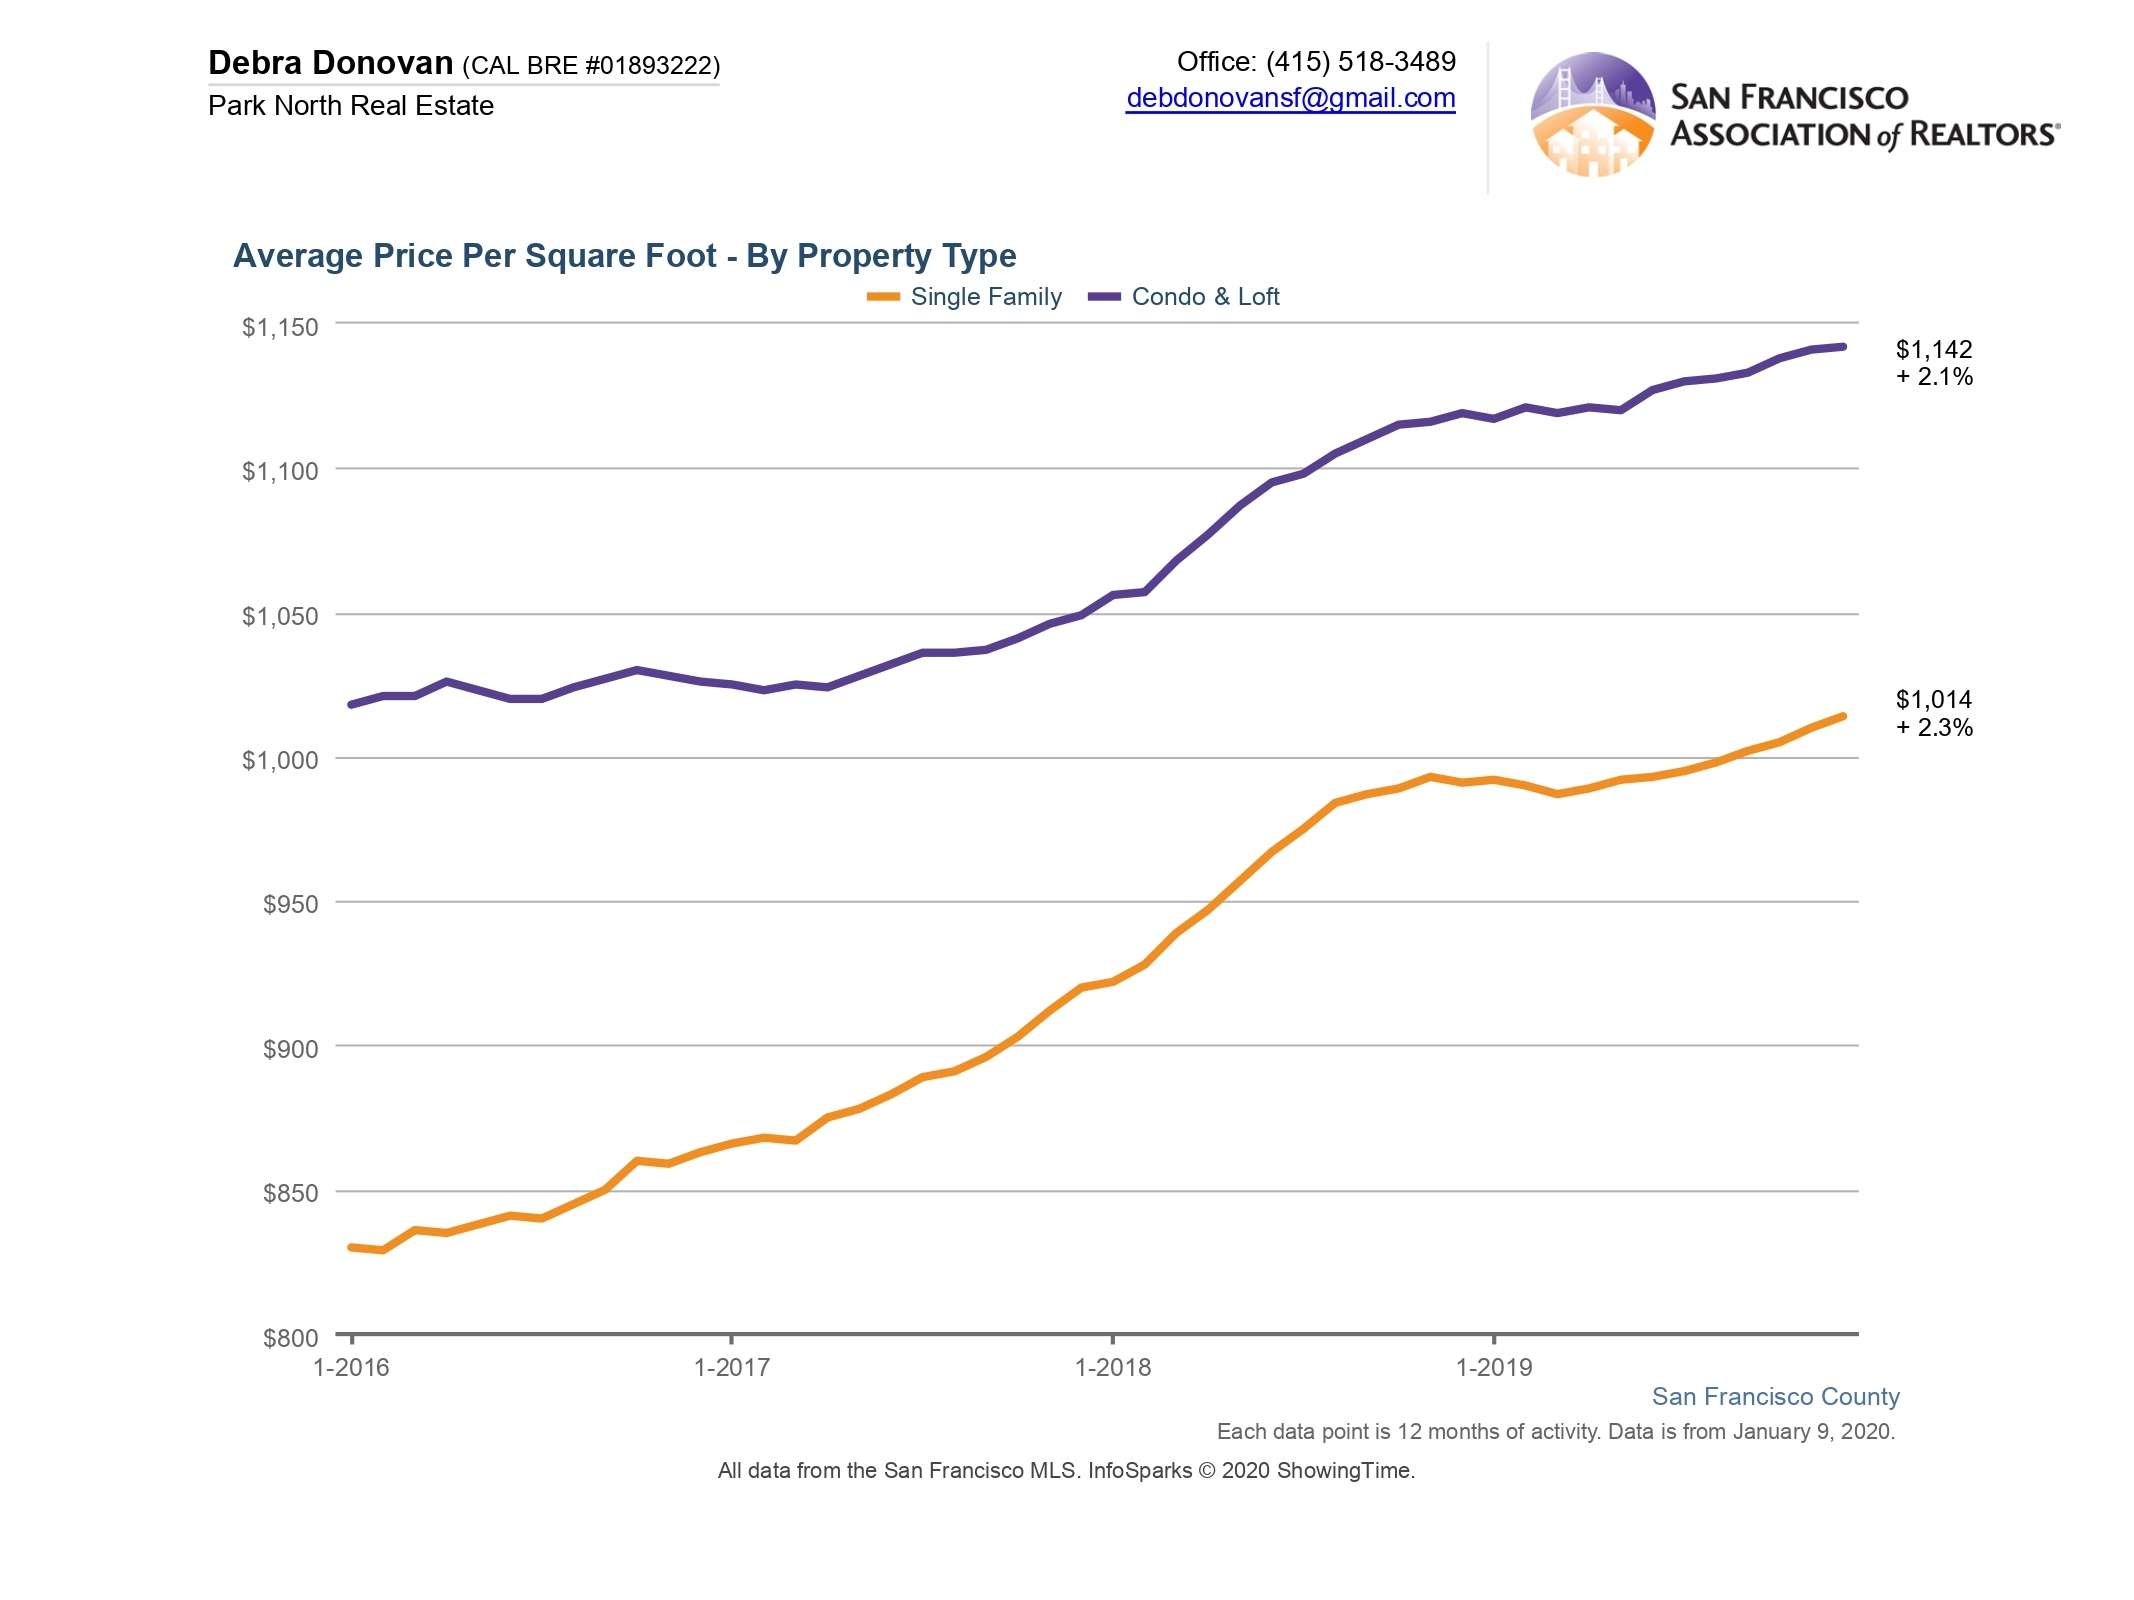
Average Price per Square Foot:
Like median price, the average price per square foot of homes inched up in 2019. The average price per square foot in San Francisco was $1,104, up just a bit over 2% compared to 2018. Condos and lofts sold for an average of $1,421 a square foot, up 2.1%. Price per square foot can vary greatly by neighborhood. These stats are a City-wide average.
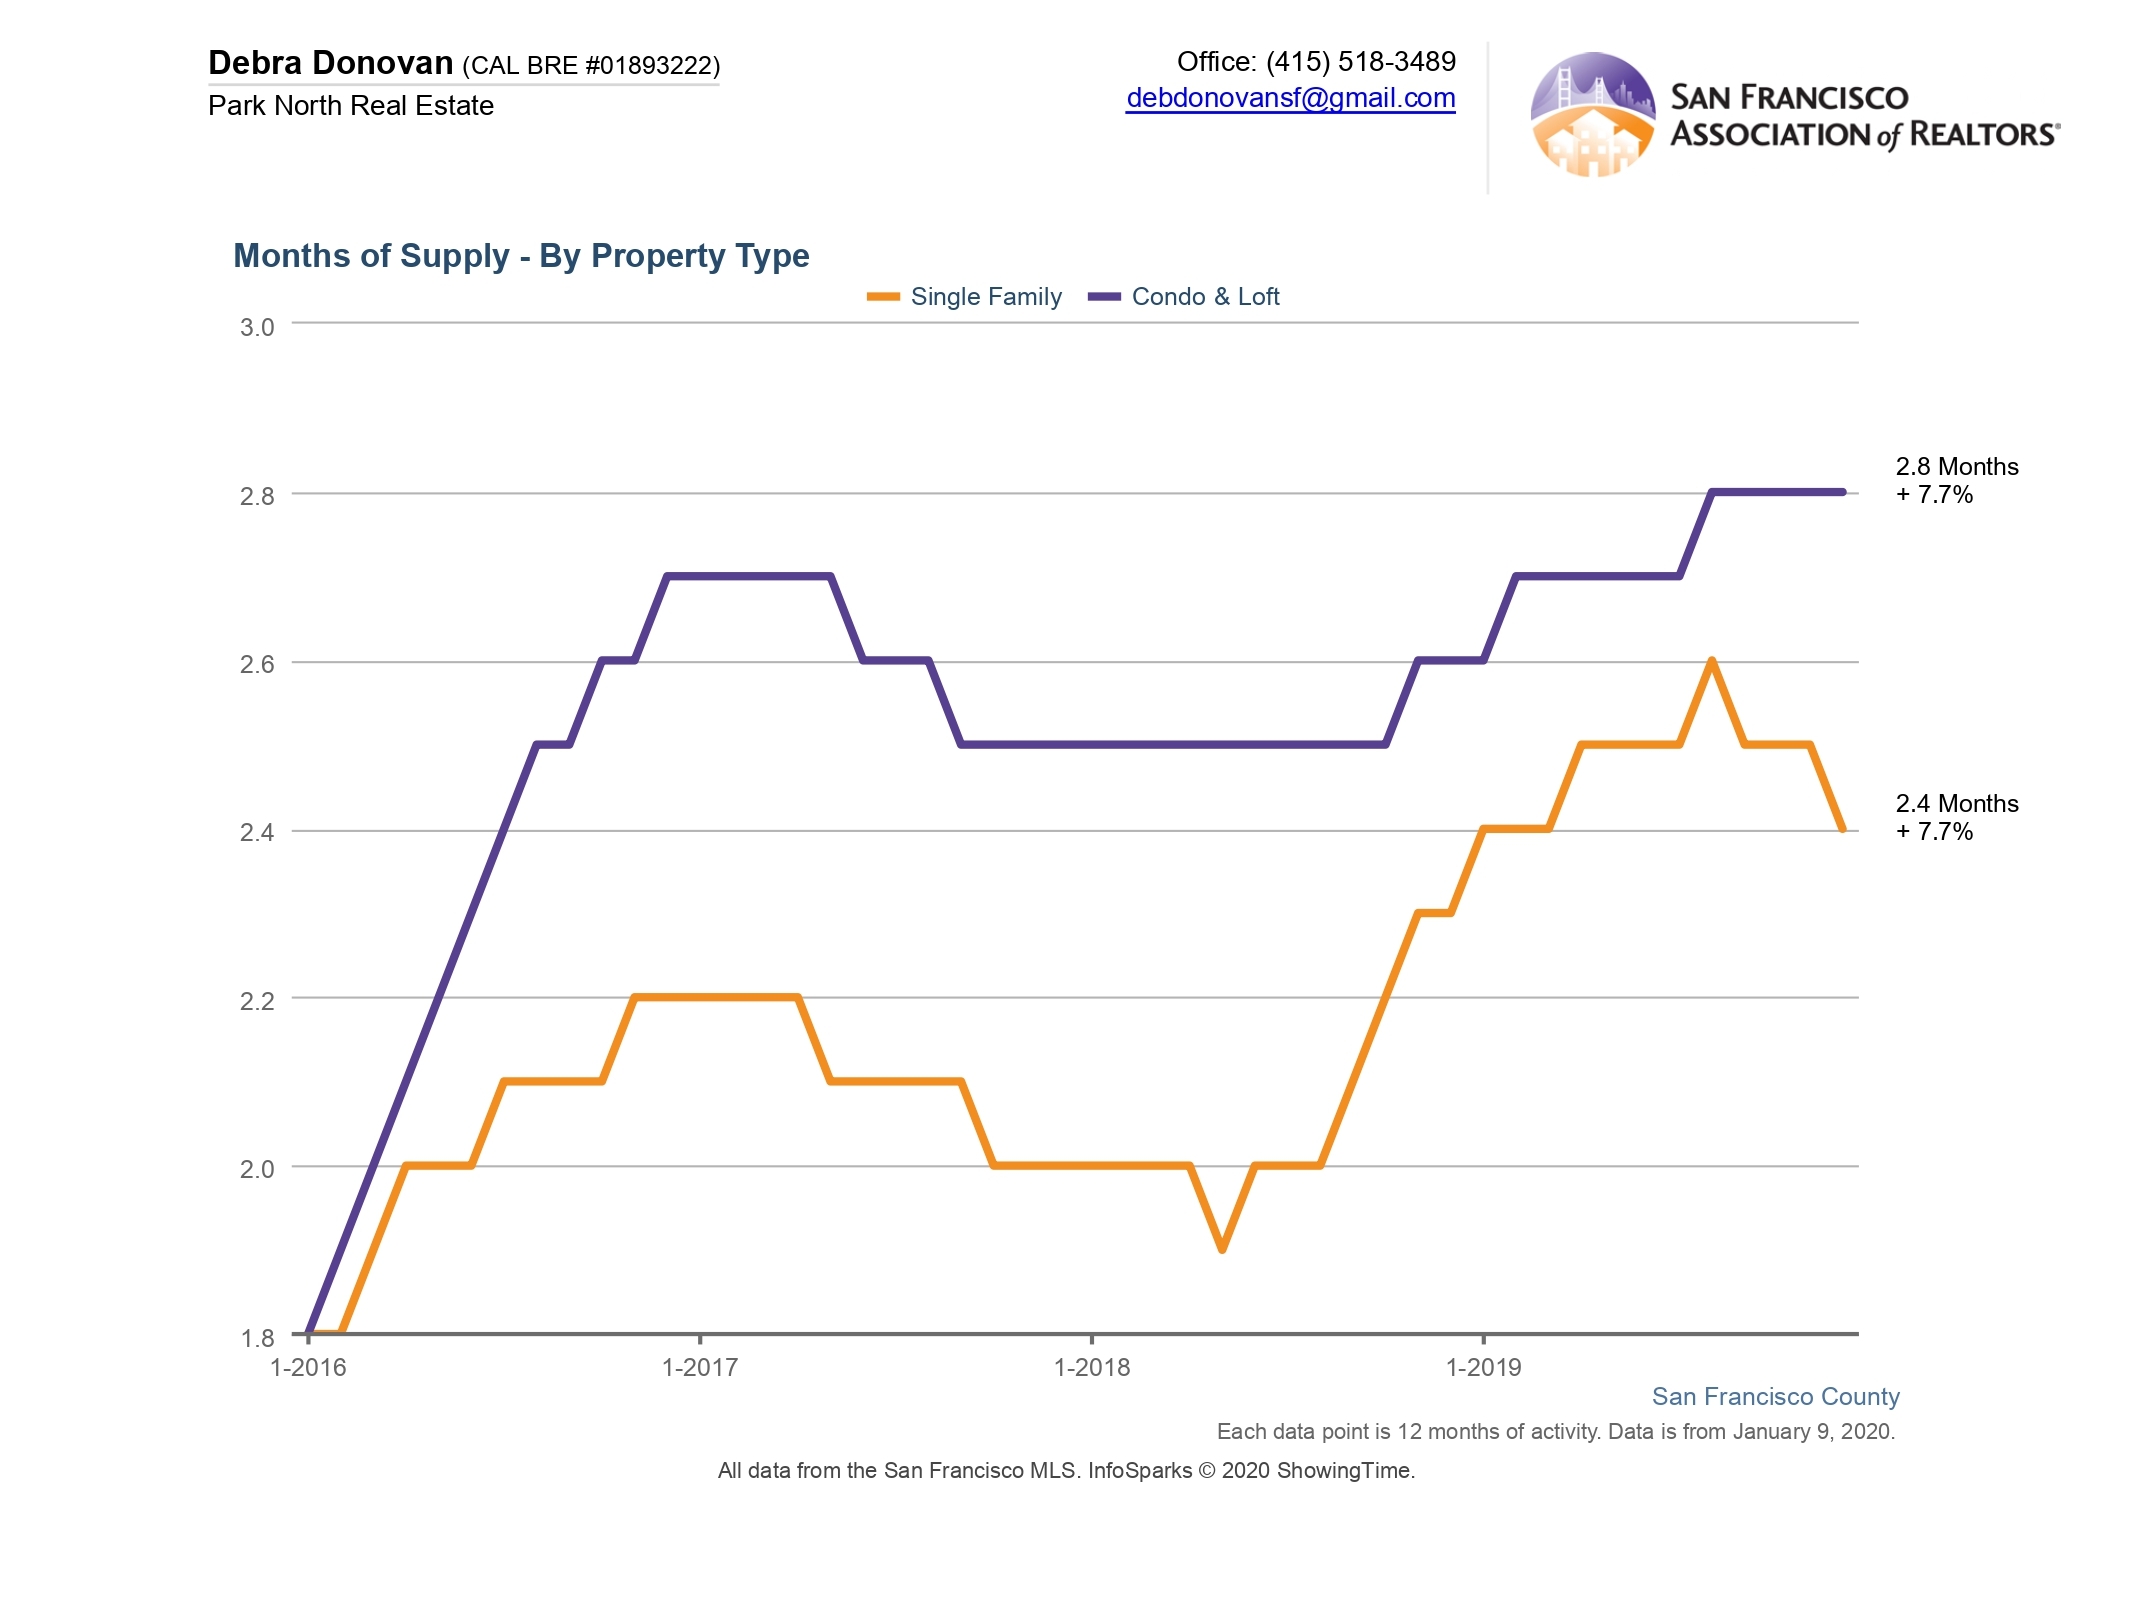
Months Supply of Inventory:
MSI for single family homes was around 2.4 months, a 4.3% increase from 2018. Condos and lofts had almost 3 months of inventory, up almost 8% compared to 2018. It’s still very much a seller’s market.
Days on Market:
2019 ended with single family homes spending 25 days on the market, up almost 9% compared to 2018. Condos and lofts spent an average of 33 days on the market, up 6.5% compared to the previous year.

And a Bonus Slide to Blow Your Mind:
Since it’s now the beginning of a new decade (yes, I know, technically…) there’s been a lot of talk about looking back over the previous 10 years. So I thought it would be interesting to look back 10 years to see what homes in San Francisco were selling for a decade ago. In 2009 the median price for a single family home was a mere $745,000 while you could get a condo or loft for just $670,000! Granted, 2009 was the throes of the Great Recession, but these prices also seemed insane at the time. If you had bought a home back then and held onto it, you’d have an incredible amount of equity by now. Which goes to show, if you’re ready to buy but taking a wait-and-see approach to try to “time” the market, the time is NOW.
The fine print: All information deemed reliable but not guaranteed or warranted. Data comes from MLS so does not include off-market and most new construction condo sales. The San Francisco real estate market is dynamic so statistics can change on a daily basis. These statistics are meant to be a snapshot of the day and time they were pulled.