August 2022 San Francisco Real Estate Market Update
The San Francisco real estate market continued the cooling that began in June. Median sales prices were down year-over-year, as was how much buyers needed to or were willing to overbid to get a home. The average days on market also increased, while the number of sold listings fell..
The cooling, though, is not definitive across the board. While many homes are selling just around, or even below, their asking price others are selling for far above their list price. Some of this is due to shifts in pricing strategy. Changing is the game plan of under pricing a property by ten to twenty percent to foster more competition and more offers. This is particularly true in the condo and TIC markets, but even single family home sellers have been adopting more transparent pricing. This is good news for buyers who in the past have been frustrated with this practice.
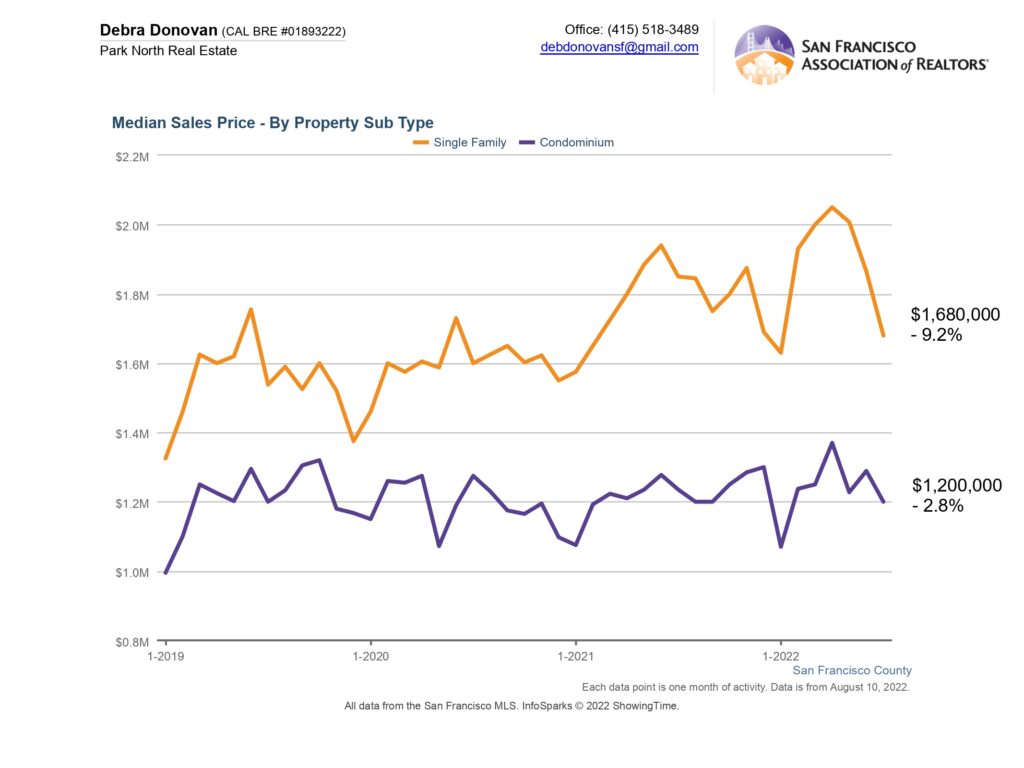
Median Price:
The median sales price for a single family home dropped again in July compared to July 2021, decreasing over 9% year-over-year. Condos also decreased almost 3% compared to last July.
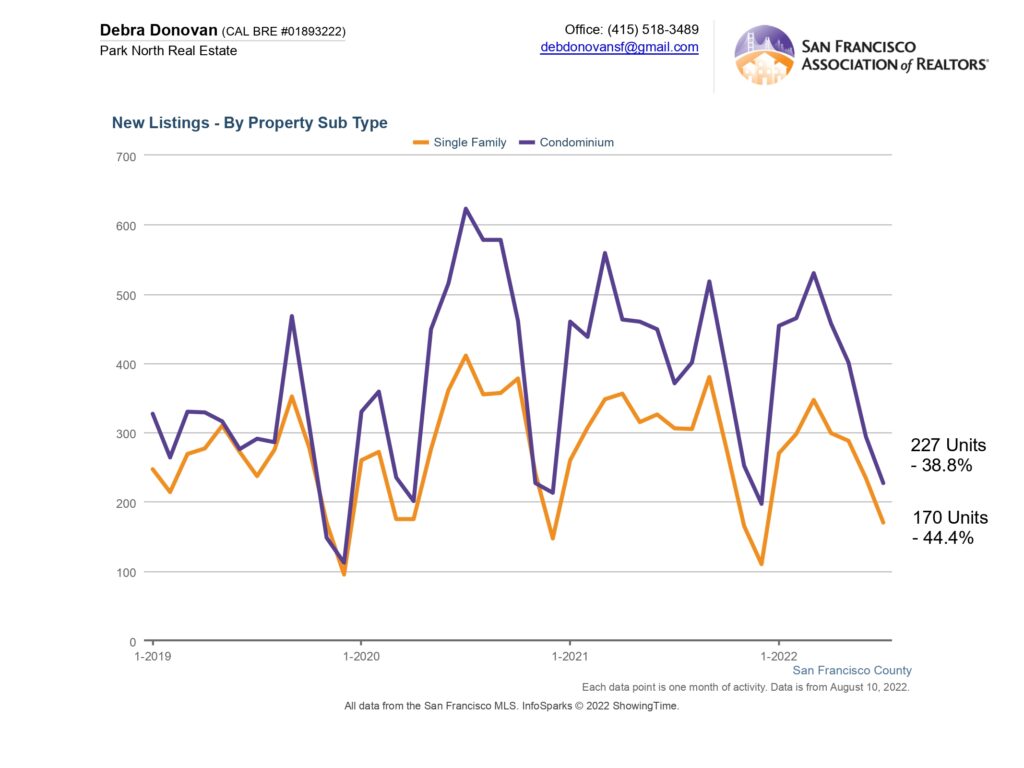
New Listings:
New listings were also down year-over-year in July, a month that is typically among the slowest in San Francisco real estate. This could be just a rightsizing after the past two pandemic years, which saw higher than normal inventory in both July 2020 and July 2021. This July’s new listing numbers are more in line with pre-pandemic July data in San Francisco. New single family homes were down almost 45% and condo listings were down about 27%.
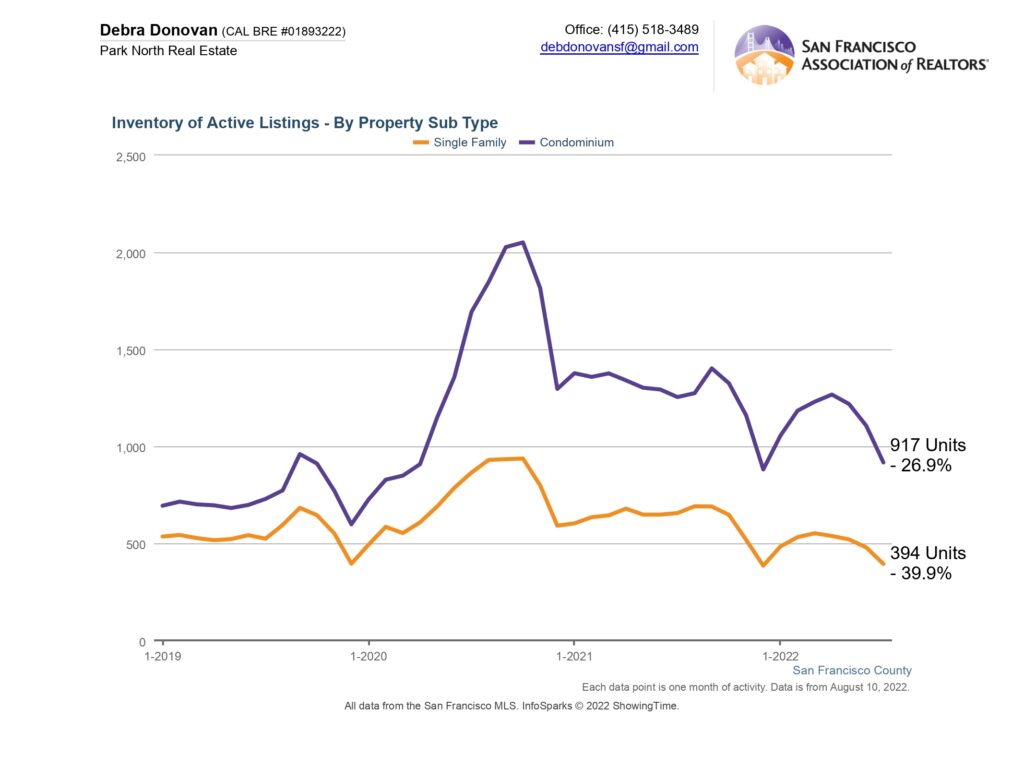
Active Listings:
Like new listings, active listings were also down in July. Active single family homes were down 40% while condo listings were down 27%.
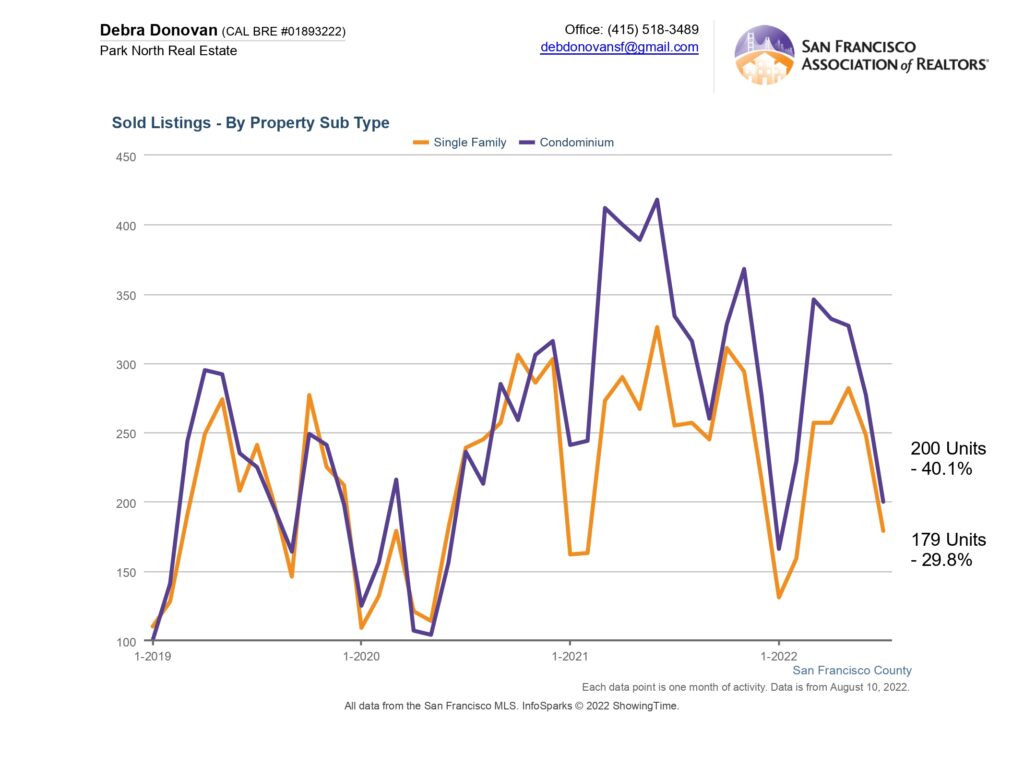
Sold Listings:
Fewer homes sold in July 2022 than they did in the same month last year. Single family homes sales were down almost 30% while condo sales were down over 40%.
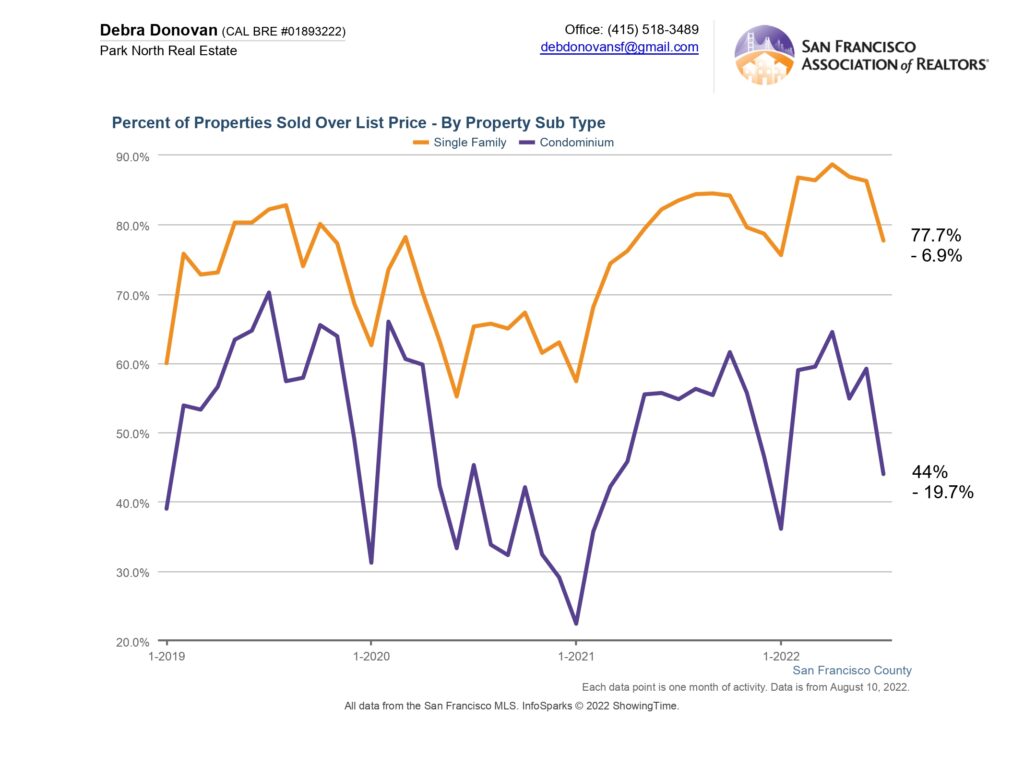
Percentage of Properties Sold Over List Price:
A smaller percentage of homes sold for over their list price in July. Whereas about 85% of single family homes were selling over their list price in 2022, in July only 78% sold over their asking price. That’s also down 7% compared to last July. Condos, of which more than half were selling over their list price this year, had just 40% sell over list price in July. That’s also down almost 20% from the same month last year.
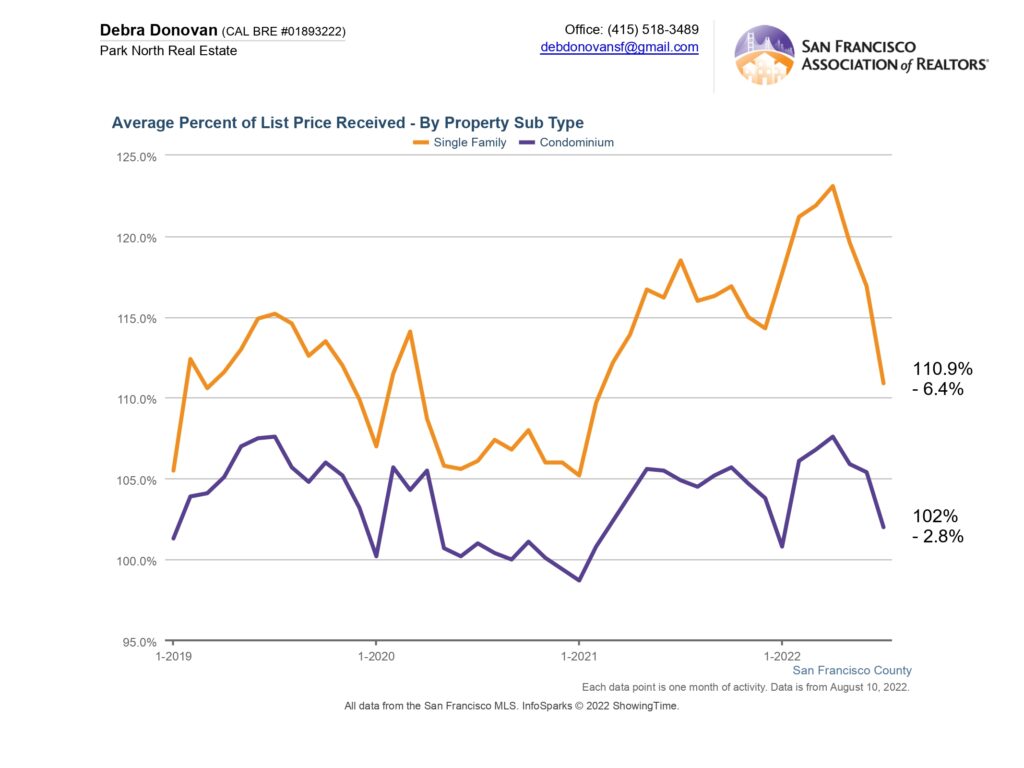
Average Percentage of List Price Received:
Single family homes sold for an average of 111% of their list price in July, down more than 6% year-over-year. Condos sold for an average of 102% of their list price, down almost 3% compared to July of last year.
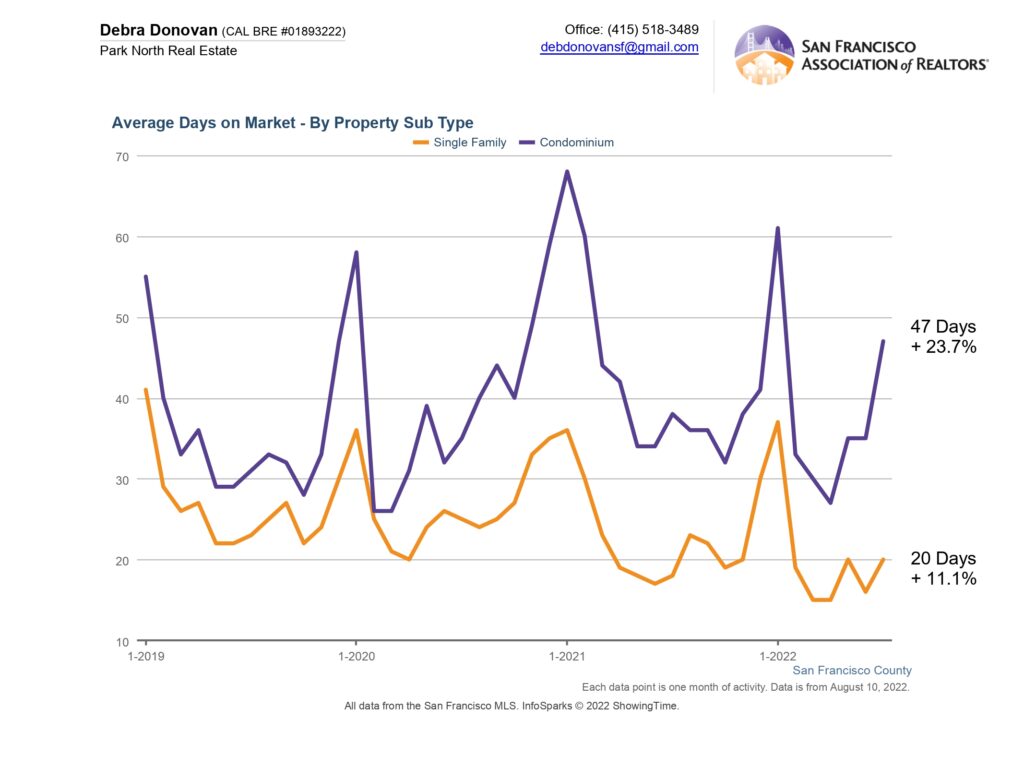
Average Days on Market:
Single family homes spent an average of 20 days on the market in July, up 20% compared to the same month last year. Condos spent an average of 47 days on the market before accepting an offer, up almost 24% year-over-year.
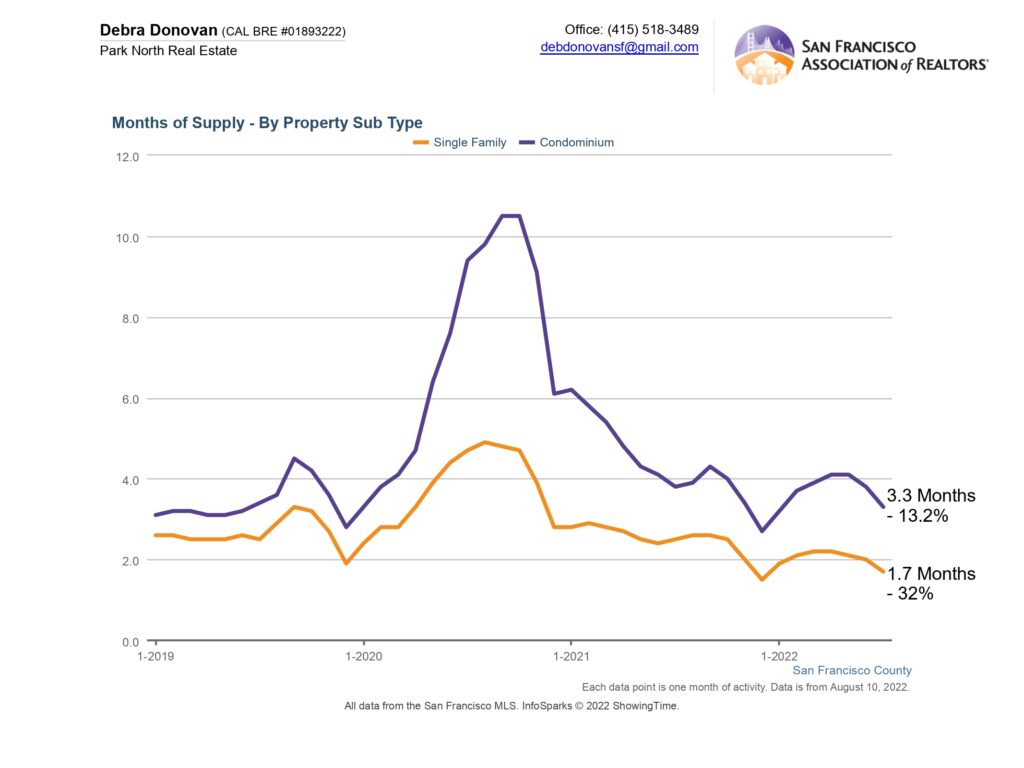
Months Supply of Inventory:
Single family homes had less than 2 months of inventory in July, down 32% compared to last July. Condos had a little over 3 months of inventory, down 13% year-over-year.
The fine print: All information deemed reliable but not guaranteed or warranted. Data comes from the MLS so does not include off-market and most new construction condo sales. The Bay Area real estate market is dynamic so statistics can change on a daily basis. These statistics are meant to be a snapshot of the day and time they were pulled.